$30 off During Our Annual Pro Sale. View Details »

Real-time anomaly detection with Cassandra, Spark ML and Akka by Natalino Busa at Big Data Spain 2015

Real-time anomaly detection with Cassandra, Spark ML and Akka by Natalino Busa at Big Data Spain 2015

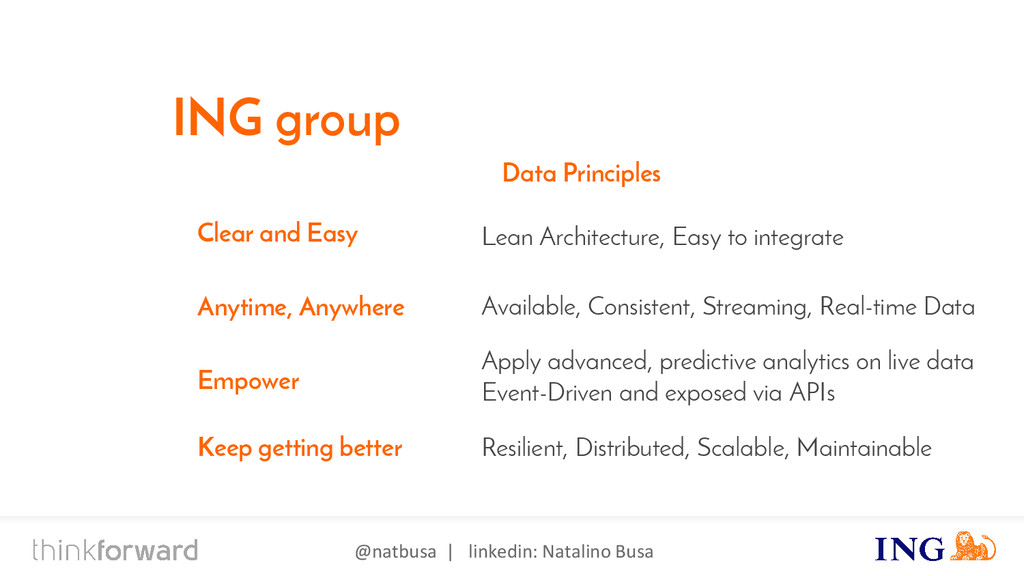
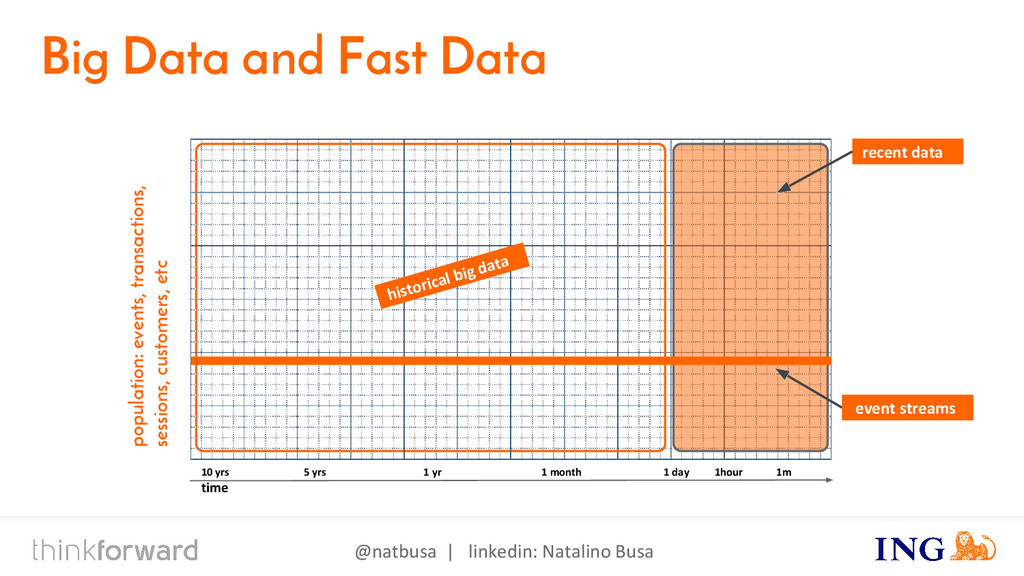
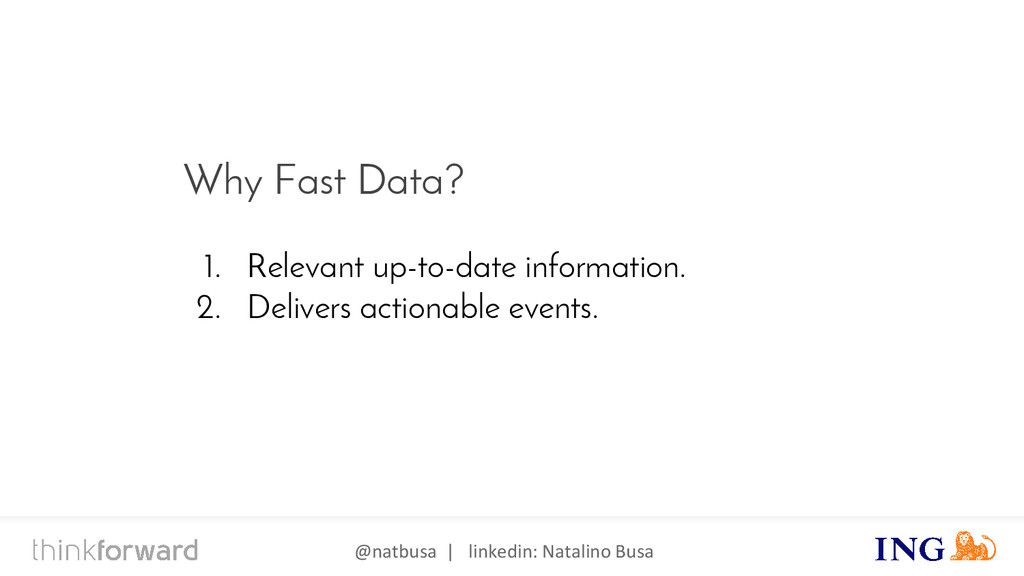
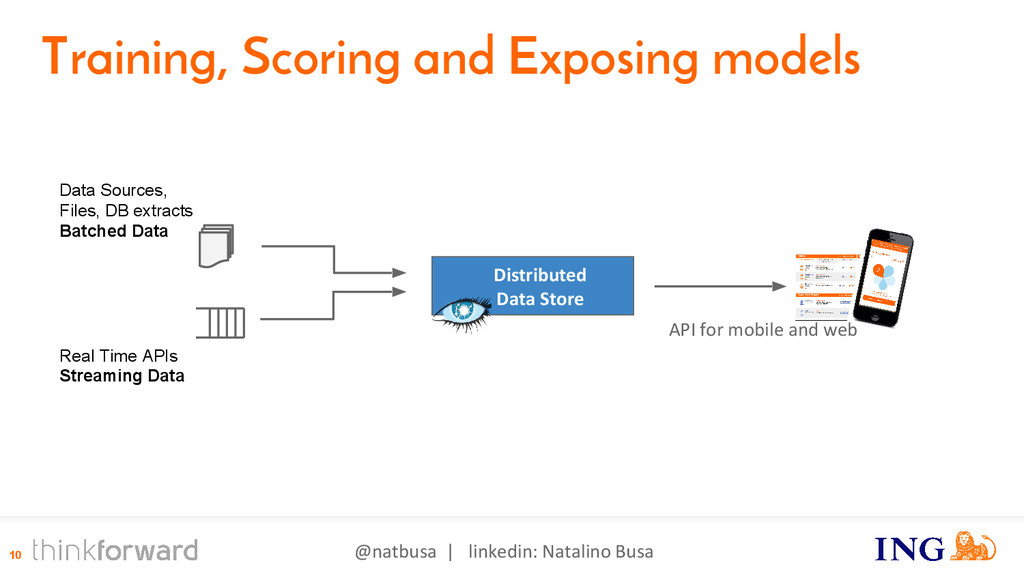
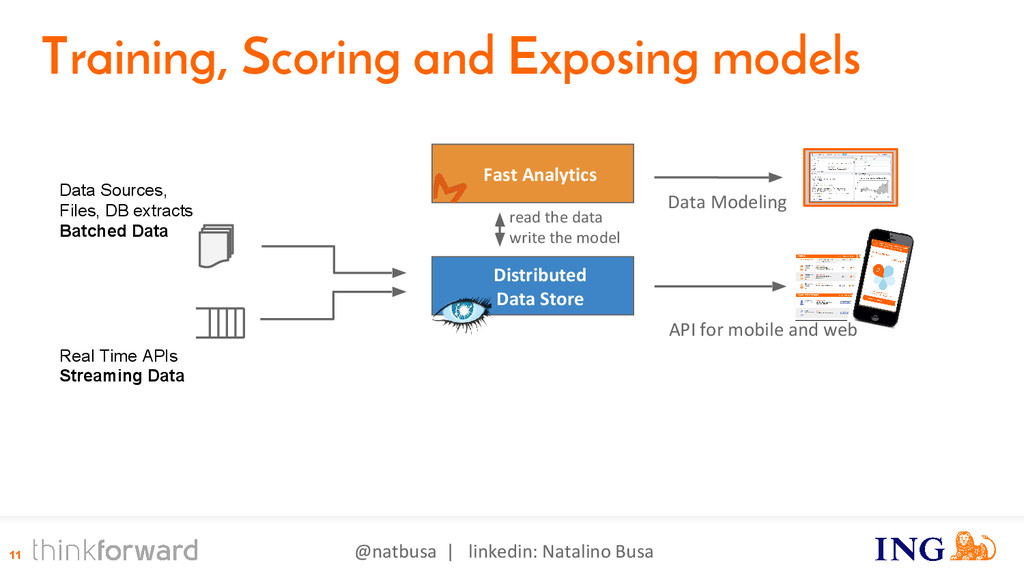
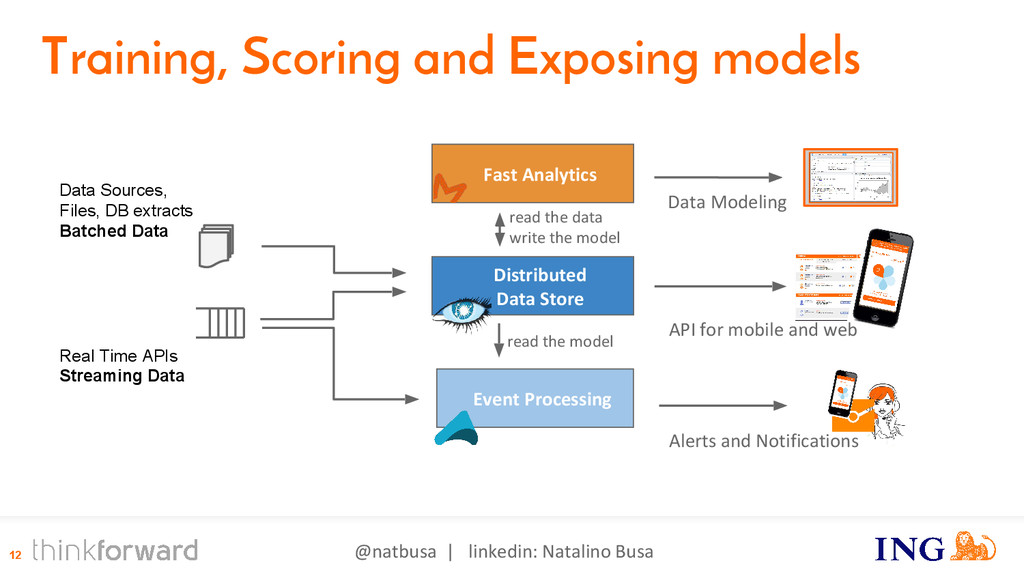
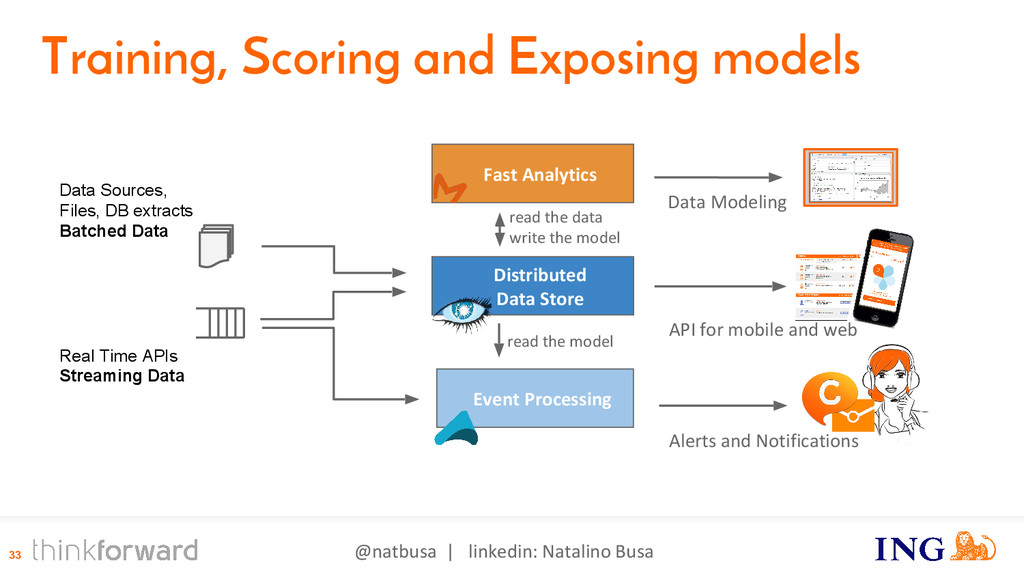
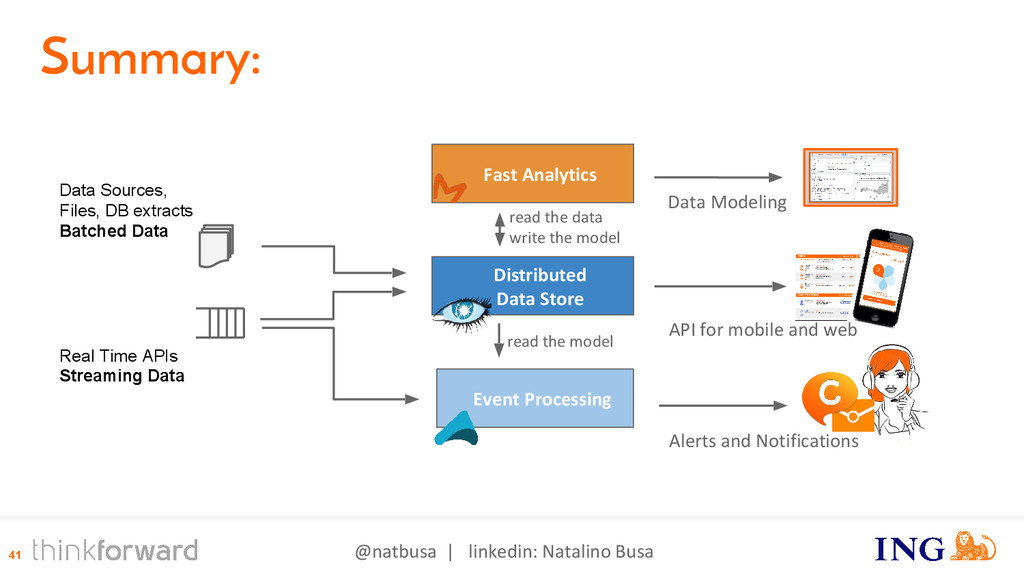
Banks are innovating. The purpose of this innovation is to transform bank services into meaningful and frictionless customer experiences. A key element in order to achieve that ambitious goal is by providing well tailored and reactive APIs and provide them as the building blocks for greater and smoother customer journeys and experiences. For these API’s to work, internal processes have to evolve as well from batch processing to real time event processing.

Session presented at Big Data Spain 2015 Conference
16th Oct 2015
Kinépolis Madrid
http://www.bigdataspain.org
Event promoted by: http://www.paradigmatecnologico.com
Abstract: http://www.bigdataspain.org/program/fri/slot-35.html

Big Data Spain

October 21, 2015
Tweet

More Decks by Big Data Spain

Other Decks in Technology

Transcript

  1. View Slide

  2. Real-Time Anomaly Detection
    with Spark MLlib, Akka and
    Cassandra
    Natalino Busa
    Data Platform Architect at Ing

    View Slide

  3. Distributed computing Machine Learning
    Statistics Big/Fast Data Streaming Computing
    @natalinobusa | linkedin.com/in/natalinobusa

    View Slide

  4. @natbusa | linkedin: Natalino Busa
    ING group
    http://www.ing.com/About-us/Purpose-Strategy.htm

    View Slide

  5. @natbusa | linkedin: Natalino Busa
    ING group
    Empowering people to stay a step ahead
    in life and in business.
    http://www.ing.com/About-us/Purpose-Strategy.htm

    View Slide

  6. @natbusa | linkedin: Natalino Busa
    ING group
    http://www.ing.com/About-us/Purpose-Strategy.htm
    Clear and Easy
    Anytime, Anywhere
    Empower
    Keep getting better

    View Slide

  7. @natbusa | linkedin: Natalino Busa
    Apply advanced, predictive analytics on live data
    Event-Driven and exposed via APIs
    Lean Architecture, Easy to integrate
    Available, Consistent, Streaming, Real-time Data
    Resilient, Distributed, Scalable, Maintainable
    Clear and Easy
    Anytime, Anywhere
    Empower
    Keep getting better
    Data Principles
    ING group

    View Slide

  8. @natbusa | linkedin: Natalino Busa
    Big Data and Fast Data
    10 yrs 5 yrs 1 yr 1 month 1 day 1hour 1m
    time
    population: events, transactions,
    sessions, customers, etc
    event streams
    recent data
    historical big data

    View Slide

  9. @natbusa | linkedin: Natalino Busa
    Why Fast Data?
    1. Relevant up-to-date information.
    2. Delivers actionable events.

    View Slide

  10. @natbusa | linkedin: Natalino Busa
    Why Big Data?
    1. Analyze and model
    2. Learn, cluster, categorize, organize facts

    View Slide

  11. @natbusa | linkedin: Natalino Busa
    10
    Distributed
    Data Store
    Real Time APIs
    Streaming Data
    Data Sources,
    Files, DB extracts
    Batched Data
    API for mobile and web
    Training, Scoring and Exposing models

    View Slide

  12. @natbusa | linkedin: Natalino Busa
    11
    Distributed
    Data Store
    Fast Analytics
    Real Time APIs
    Streaming Data
    Data Modeling
    Data Sources,
    Files, DB extracts
    Batched Data
    API for mobile and web
    Training, Scoring and Exposing models
    read the data
    write the model

    View Slide

  13. @natbusa | linkedin: Natalino Busa
    12
    Distributed
    Data Store
    Fast Analytics
    Event Processing
    Real Time APIs
    Streaming Data
    Data Modeling
    Data Sources,
    Files, DB extracts
    Batched Data
    Alerts and Notifications
    API for mobile and web
    Training, Scoring and Exposing models
    read the model
    read the data
    write the model

    View Slide

  14. @natbusa | linkedin: Natalino Busa
    Cassandra+Akka+Spark: Machine Learning
    Fast writes
    2D Data Structure
    Replicated
    Tunable consistency
    Multi-Data centers
    C*
    Akka Spark
    Very Fast processing
    Distributed, Scalable computing
    Actor-based Pipelines
    Actor state can be persisted
    Supervision strategies
    Ad-Hoc Queries
    Joins, Aggregate
    User Defined Functions
    Machine Learning,
    Advanced Stats and Analytics

    View Slide

  15. @natbusa | linkedin: Natalino Busa
    Akka-Cassandra-Spark Stack
    Cassandra-Spark Connector
    Cassandra
    Spark
    Streaming SQL MLlib Graphx
    Extract
    Data
    Create Models,
    Enrich, Transform
    Fetch from other
    Sources: Kafka
    Fetch from other
    Sources: DB’s, Files
    Akka
    Analytics, Statistics, Data
    Science, Model Training
    Access
    Model
    Persist
    Actors’ State

    View Slide

  16. @natbusa | linkedin: Natalino Busa
    Cassandra-Spark Connector
    Cassandra: Store all the data
    Spark: Analyze all the data
    DC1: replication factor 3 DC2: replication factor 3 DC3: replication factor 3 + Spark Executors
    Storage! Analytics!
    Data

    View Slide

  17. @natbusa | linkedin: Natalino Busa
    Cassandra-Spark Stack
    Cassandra: Store all the data
    Spark: Distributed Data Processing
    Executors and Workers
    Cassandra-Spark Connector:
    Data locality,
    Reduce Shuffling
    RDD’s to Cassandra
    Partitions
    DC3: replication factor 3 +
    Spark Executors

    View Slide

  18. @natbusa | linkedin: Natalino Busa
    Data Science: Anomaly Detection
    An outlier is an observation that deviates so much from other
    observations as to arouse suspicion that it was generated by a different
    mechanism.
    Hawkins, 1980

    View Slide

  19. @natbusa | linkedin: Natalino Busa
    Data Science: Anomaly Detection (1)
    Parametric Based
    Gaussian Model Based Histogram, nonparametric

    View Slide

  20. @natbusa | linkedin: Natalino Busa
    Data Science: Anomaly Detection (2)
    Distance Based Density Based

    View Slide

  21. @natbusa | linkedin: Natalino Busa
    Example: Analyze gowalla check-ins
    year | month | day | time | uid | lat | lon | ts | vid
    ------+-------+-----+------+--------+----------+-----------+--------------------------+---------
    2010 | 9 | 14 | 91 | 853 | 40.73474 | -73.87434 | 2010-09-14 00:01:31+0000 | 917955
    2010 | 9 | 14 | 328 | 4516 | 40.72585 | -73.99289 | 2010-09-14 00:05:28+0000 | 37160
    2010 | 9 | 14 | 344 | 2964 | 40.67621 | -73.98405 | 2010-09-14 00:05:44+0000 | 956870
    Check-ins dataset
    Venues dataset
    vid | name | lat | long ------+-------+-----+------+--------+----------+-----------
    +--------------------------+---------
    754108 | My Suit NY | 40.73474 | -73.87434
    249755 | UA Court Street Stadium 12 | 40.72585 | -73.99289
    6919688 | Sky Asian Bistro | 40.67621 | -73.98405

    View Slide

  22. @natbusa | linkedin: Natalino Busa
    Data Science: clustering venues
    Weekly visitors patterns!
    Madison Square, Apple Store, Radio City Music Hall
    Thursdays, Fridays, Saturdays are busy
    Statue of Liberty, Jacob K. Javits Convention Center,
    Whole Foods Market (Columbus Circle)
    Not popular on midweek
    Intuition:

    View Slide

  23. @natbusa | linkedin: Natalino Busa
    Data Science: clustering with k-means
    Histograms components as dimensions
    Similar histograms would occupy similar places in
    the feature space
    How do I compare histograms:
    - EMD
    - Chi-squared distance
    - Space transformation (DCT)
    Intuition:

    View Slide

  24. @natbusa | linkedin: Natalino Busa
    K-Means: Featurize data + cluster
    val weekly_visits = checkins_venues.select("vid","ts")
    .map(row => (row.getLong("vid"), vectorize_time(s.getTimestamp("ts"))
    .reduceByKey(_ + _)
    .mapValues(_ => featurize_histogram(_._1))
    val numClusters = 15
    val numIterations = 100
    val clusters = KMeans.train(weekly_visits, numClusters, numIterations)
    PairRDDs, weekly patterns per venue
    cluster similar weekly patterns

    View Slide

  25. @natbusa | linkedin: Natalino Busa
    Assigning venues to clusters
    val venues_clustered = checkins_venues.select("vid","ts").where("ts > dateof(now())")
    .map(row => (row.getLong("vid"), vectorize_time(s.getTimestamp("ts"))
    .reduceByKey(_ + _)
    .mapValues(_ => clusters.predict(featurize_time(_)))
    venues_clustered.saveToCassandra("lbsn", "venues_cl") score and assign each venue to a cluster
    Store the cluster centers in cassandra

    View Slide

  26. @natbusa | linkedin: Natalino Busa
    How to use it
    1) Classification
    Classify venues to given groups
    2) Anomaly Detection
    Detect shift in the clustering assignment for a given venue for a given week
    Keep monitoring weekly change in patterns, when it happens trigger a signal
    week 26 week 27
    alert!

    View Slide

  27. @natbusa | linkedin: Natalino Busa
    Data Science: clustering users’ venues
    Intuition:
    Users tend to stick in the same places
    People have habits
    By clustering the places together
    We can identify anomalous locations
    Size of the cluster matters
    More points means less anomalous
    Mini-clusters and single anomalies are
    treated in similar ways ...

    View Slide

  28. @natbusa | linkedin: Natalino Busa
    Data Science: clustering users’ venues
    Users tend to stick in the same places
    People have habits
    By clustering the places together
    We can identify anomalous locations
    Size of the cluster matters
    More points means less anomalous
    Mini-clusters and single anomalies are
    treated in similar ways ...
    Intuition:

    View Slide

  29. @natbusa | linkedin: Natalino Busa
    Data Science: clustering with DBSCAN
    DBSCAN find clusters based on neighbouring density
    Does not require the number of cluster k beforehand.
    Clusters are not spherical

    View Slide

  30. @natbusa | linkedin: Natalino Busa
    Data Science: clustering with DBSCAN
    DBSCAN find clusters based on neighbouring density
    Does not require the number of cluster k beforehand.
    Clusters are not spherical
    It’s a graph!

    View Slide

  31. @natbusa | linkedin: Natalino Busa
    Data Science: clustering users’ venues
    val locs = checkins_venues.select("uid", "lat","lon")
    .map(s => (s.getLong(0), Seq( (s.getDouble(1), s.getDouble(2)) ))
    .reduceByKey(_ + _)
    .mapValues( dbscan cluster _ )
    Have a look at: scalanlp/nak

    View Slide

  32. @natbusa | linkedin: Natalino Busa
    Data Science:
    Two ways to find anomalies with clustering
    - Cluster big amount of data with k-means and histograms
    - Apply clustering independently to million of users,
    to each identify the patterns with dbscan algorithm

    View Slide

  33. @natbusa | linkedin: Natalino Busa
    MLlib vs PairRDDs
    KMeans.train(FeaturesRDD, numClusters, numIterations)
    UserFeaturesPairRDD.GroupbyKey().mapValues( dbscan cluster _ )
    RDDs map functions
    Parallelism easy to exploit
    The function runs locally for each Key
    Pick your fav machine learning algorithms
    Limited nr of points
    Running in parallel for millions of Keys
    MLlib
    Truly distributed algorithm
    Classify venues to given groups
    Millions of datapoints
    Limited amount of clusters

    View Slide

  34. @natbusa | linkedin: Natalino Busa
    33
    Distributed
    Data Store
    Fast Analytics
    Event Processing
    Real Time APIs
    Streaming Data
    Data Modeling
    Data Sources,
    Files, DB extracts
    Batched Data
    Alerts and Notifications
    API for mobile and web
    Training, Scoring and Exposing models
    read the model
    read the data
    write the model

    View Slide

  35. @natbusa | linkedin: Natalino Busa
    Training vs Scoring: Time budgets
    ● Akka: millisecond response
    ● Spark: in-memory (big)-data models
    Train: Spark
    Score: Spark
    Train: Spark
    Score: Akka
    slow: minutes fast: millisecs
    Train: Akka
    Score: Akka
    Model Scoring
    Model Training
    slow: minutes
    fast: millisecs

    View Slide

  36. @natbusa | linkedin: Natalino Busa
    Which processing? .. and the granularity of data?
    What is the latency and the throughput?

    View Slide

  37. @natbusa | linkedin: Natalino Busa
    It’s all about latency!
    Map Reduce
    Big Data
    Batch based
    RDDs
    Big Data
    Micro-Batch Based
    CRDT’s + Monoids
    Fast Data
    Event Based
    MillWheel
    Fast + Big Data
    Event & Window

    View Slide

  38. @natbusa | linkedin: Natalino Busa
    Akka
    Mixed Load Cassandra Cluster
    Coral: Web API for dynamic data flows

    View Slide

  39. @natbusa | linkedin: Natalino Busa
    Data
    events
    POST http://coral/api/actors/23/in
    {
    "amount":23.45,
    "user": 76232,
    "city": "Berlin"
    }
    @natalinobusa | linkedin.com/in/natalinobusa
    Coral: Streaming data via Web APIs

    View Slide

  40. @natbusa | linkedin: Natalino Busa
    Trigger Emit
    Params
    State
    GET http://coral/api/actors/23
    {
    "actors": {
    "def": {
    "type": "stats",
    "params": {
    "field": "amount"
    }
    },
    "state": {
    "count": 134,
    "avg": 39.84,
    "min": 1.99,
    "max": 204.19,
    "sd": 38.01
    }
    }
    }
    Coral: Streaming data via Web APIs

    View Slide

  41. @natbusa | linkedin: Natalino Busa
    Akka
    Coral: Web API for dynamic data flows
    ● a web api to define/manage/run streaming data-flows
    ● open source and community managed
    ● event processing as a service
    ● connect to Cassandra to access models
    ● connect to kafka to consume and produce events
    Steven Raemaekers
    Jasper van Zandbeek
    Ger van Rossum
    Hoda Alemi
    Koen Verschuren

    View Slide

  42. @natbusa | linkedin: Natalino Busa
    41
    Distributed
    Data Store
    Fast Analytics
    Event Processing
    Real Time APIs
    Streaming Data
    Data Modeling
    Data Sources,
    Files, DB extracts
    Batched Data
    Alerts and Notifications
    API for mobile and web
    Summary:
    read the model
    read the data
    write the model

    View Slide

  43. @natbusa | linkedin: Natalino Busa
    Akka
    Feedback to the community:
    More Algorithms for machine learning!
    - DBSCAN, OPTICS, PAM
    - More metrics, non-euclidean spaces, etc
    - Non distributed algorithms: more scalanlp integration?
    Streaming all the way:
    Unify batch (Spark) and event streaming (Akka) computing

    View Slide

  44. @natbusa | linkedin: Natalino Busa
    Thanks!
    - Vision and strategy on an event-driven bank
    - ING CIO management team and awesome colleagues
    Spark, Cassandra, Akka communities !

    View Slide

  45. @natbusa | linkedin: Natalino Busa
    Resources
    Coral: event processing webapi
    https://github.com/coral-streaming/coral
    Spark + Cassandra: Clustering Events
    http://www.natalinobusa.com/2015/07/clustering-check-ins-with-spark-and.html
    Spark: Machine Learning, SQL frames
    https://spark.apache.org/docs/latest/mllib-guide.html
    https://spark.apache.org/docs/latest/sql-programming-guide.html
    Datastax: Analytics and Spark connector
    http://www.slideshare.net/doanduyhai/spark-cassandra-connector-api-best-practices-and-usecases
    http://docs.datastax.com/en/datastax_enterprise/4.7/datastax_enterprise/anaHome/anaHome.html
    Anomaly Detection
    Chandola, V.; Banerjee, A.; Kumar, V. (2009). "Anomaly detection: A survey"(PDF). ACM Computing Surveys 41 (3): 1. doi:10.1145/1541880.1541882.

    View Slide

  46. @natbusa | linkedin: Natalino Busa
    Resources
    Datasets
    https://snap.stanford.edu/data/loc-gowalla.html
    E. Cho, S. A. Myers, J. Leskovec. Friendship and Mobility: Friendship and Mobility: User Movement in Location-Based Social Networks ACM SIGKDD International
    Conference on Knowledge Discovery and Data Mining (KDD), 2011
    https://code.google.com/p/locrec/downloads/detail?name=gowalla-dataset.zip
    The project is being developed in the context of the SInteliGIS project financed by the Portuguese Foundation for Science and Technology (FCT) through project grant
    PTDC/EIA-EIA/109840/2009. .
    Pictures:
    "DBSCAN-density-data" by Chire - Own work. Licensed under CC BY-SA 3.0 via Commons - https://commons.wikimedia.org/wiki/File:DBSCAN-density-data.
    svg#/media/File:DBSCAN-density-data.svg
    "DBSCAN-Illustration" by Chire - Own work. Licensed under CC BY-SA 3.0 via Commons - https://commons.wikimedia.org/wiki/File:DBSCAN-Illustration.svg#/media/File:
    DBSCAN-Illustration.svg
    "Multimodal" by Visnut - Own work. Licensed under CC BY-SA 4.0 via Commons -
    https://commons.wikimedia.org/wiki/File:Multimodal.png#/media/File:Multimodal.png
    "Standard deviation diagram" by Mwtoews - Own work, based (in concept) on figure by Jeremy Kemp, on 2005-02-09. Licensed under CC BY 2.5 via Commons - https:
    //commons.wikimedia.org/wiki/File:Standard_deviation_diagram.svg#/media/File:Standard_deviation_diagram.svg
    "Michelsonmorley-boxplot" by User:Schutz - Own work. Licensed under Public Domain via Commons - https://commons.wikimedia.org/wiki/File:Michelsonmorley-boxplot.
    svg#/media/File:Michelsonmorley-boxplot.svg

    View Slide