Upgrade to Pro — share decks privately, control downloads, hide ads and more …

Digital Humanities Research Network: Cool Tools Lightning Talks

Digital Humanities Research Network: Cool Tools Lightning Talks

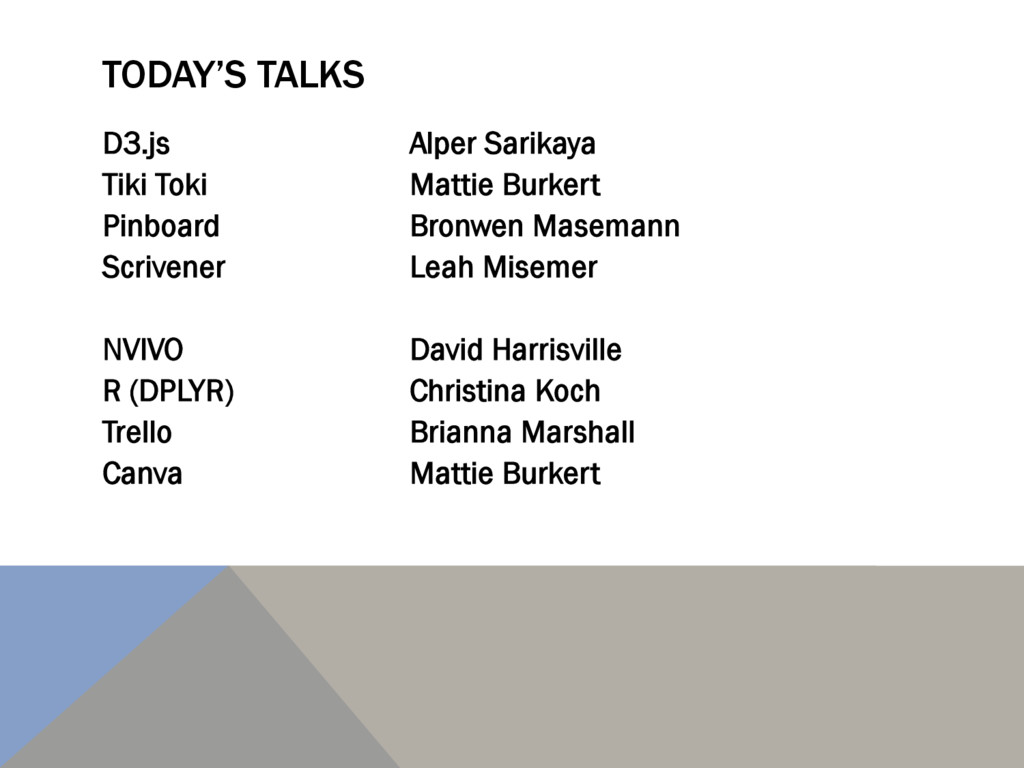
This slide deck was compiled from slides provided by the lightning talk speakers featured at the 11/17 DHRN meeting. Speakers include: Apler Sarikaya, Mattie Burkert, Bronwen Masemann, Leah Misemer, David Harrisville, Christina Koch, and Brianna Marshall.

Brianna Marshall

November 17, 2015
Tweet

More Decks by Brianna Marshall

Other Decks in Technology

Transcript

  1. TODAY’S TALKS D3.js Alper Sarikaya Tiki Toki Mattie Burkert Pinboard

    Bronwen Masemann Scrivener Leah Misemer NVIVO David Harrisville R (DPLYR) Christina Koch Trello Brianna Marshall Canva Mattie Burkert
  2. D3.JS http://d3js.org An online, JavaScript library for constructing flexible data

    visualizations. PROs: •  Allows for binding data to visual representations (reuse the vis for different data) •  Super-powerful and flexible, use any online data source CONs: •  Lots of cognitive programming (simple scatter plots are not simple to program) •  Not super analyst-friendly to get up and running
  3. So… why tell us then? Interactive vis, based on data

    Keep visual representation the same, change the data One-time dev. cost, then exploratory analysis (grab a Computer Science student!)
  4. Alexander et al. “Serendip: Topic Model-Driven Visual Exploration of Text

    Corpora” VAST 2014. https://graphics.cs.wisc.edu/Papers/2014/AKVWG14/
  5. TIKI-TOKI http://www.tiki-toki.com/ Free, web-based software for creating interactive timelines. PROs:

    •  The app is browser-based, so there’s no downloading or installing •  Color-coded tagging allows you to visually juxtapose events in different categories. •  Supports embedded images and videos. CONs: •  Only one timeline per free account. (Additional timelines require a premium account, with options ranging from $7.50 to $25 per month) •  Available time stamp formats don’t reflect the ambiguity of historical dating. •  Timelines are automatically archived if you don’t access them for a while.
  6. PINBOARD www.pinboard.in Save interesting stuff from anywhere, keep track of

    stuff to read, organize stuff with tags, access stuff anywhere, follow other users and/or tags to discover even more interesting stuff. PROs: •  No ads •  Does what you want it to do: intuitive, simple design with handy features and nothing extra •  Privacy – no third-party tracking of your bookmarks, and you can mark bookmarks as private CONs: •  Cost to sign-up (currently $11.00/year) •  Limited/unknown user base •  Text-heavy design
  7. SCRIVENER literatureandlatte.com Helps you keep your long projects organized. PROs:

    •  1 Ability to toggle between small parts of a project (e.g. paragraphs, sections) and the long view (outlines, cork board view) •  2 Ensures all parts of a project are available in one place with split screen viewing and versioning capabilities •  3 Writing Center has a workshop designed to help you learn how to use this software CONs: •  1 Files have to be exported as .doc, .txt, etc. for formatting and sharing •  2 In house citation abilities aren’t wonderful, but the tool does integrate with citation software (Zotero, Endnote, etc.)
  8. NVivo http://www.qsrinternational.com/product Tool for analyzing text-based data, ideal for large

    research projects. PROs: •  Stores data from a variety of formats (Word docs, pdfs, images) in one place •  Organize your information any way you want •  Run complex queries to retrieve specific data from any/all sources CONs: •  Cost (~$200 for 12-month student/educator license) •  Involves a lot of initial work to set everything up
  9. R (DPLYR) https://cran.r-project.org/web/packages/dplyr/index.html Slice, dice, and analyze tabular data PROs:

    •  Few commands to learn -> combine commands for complex queries •  Can handle very large datasets •  Easy to re-execute and modify analysis CONs: •  Learning curve for those unfamiliar with text-based (vs graphic) interfaces •  Less suitable for pure text analysis (but another R package might be!)
  10. R Programming language developed by stats/data folks Think of R

    as a way to “do data” (parse, analyze, present) using text commands instead of point-and-click application. Same tasks, but a different way of telling the computer how to do the work. R packages provide extra functionality for doing specific things: spreadsheets graphs/figures papers/reports …and more
  11. On campus • R classes at SSCC https://www.ssc.wisc.edu/ sscc_jsp/training/ • Intro to

    R through CS368 Online • Twitter! #rstats • Package “vignettes” • Jenny Bryan’s STAT545 course stat545-ubc.github.io • Karl Broman’s tutorials kbroman.org/pages/tutorials.html LEARN MORE
  12. TRELLO https://trello.com/ A free online platform for managing projects and

    tasks. PROs: •  Cloud-based, so you can access it anywhere. •  Easy to modify, move, and change tasks. •  Can collaborate with others. CONs: •  Like any other system, you have to be intentional about how you’re using it in order for it to work well.
  13. CANVA https://www.canva.com Free software for designing posters, presentations, and social

    media graphics PROs: •  Free tutorials help you learn design principles. •  Drag-and-drop interface is easy to start using quickly. CONs: •  Premium elements cost $1 each. •  Resizing your designs requires a “Canva for Work” account.