Baby Boomers and Gen X-ers across key financial wellness indicators, including debt and savings rates. However, Millennials diverge when it comes to investing for the future. 1 1 Based on Retiremap implementation data from Q2 2015
less than the Gen X population and Baby Boomers, but these youngest members of the workforce are demonstrating smart decision-making in areas that will prepare them well for retirement. At the start of this year, the Pew Research Center forecasted that Millennials will overtake Baby Boomers by population in 2015 . According to Pew, Baby Boomers 1 always have had an outsized presence in comparison to other generations, while Gen X-ers have had a smaller presence. The imbalance of Baby Boomers near or at retirement age and Gen X-ers in the workforce has raised concerns about the viability of Social Security. Millennials Strongly Allocated to Cash As the Millennial population in the workforce continues to grow, their ability to make sound financial decisions will be crucial to ensuring their well-being in the long-term, and avoiding additional pressures on the previous generations. Millennials have faced an upward battle. Many entered the workforce during the recession. College has become more competitive, expensive, and crucial to professional success, creating more student loans for those who have a bachelor’s degree and worsening job prospects for those who do not. Millennials are the best-educated generation, but they are making less in real dollars than previous generations . 2 In an analysis of employee data collected from Retiremap implementations in Q2 2015, it was found that Millennials, by many measures of financial wellness, are stacking up well against Gen X-ers and Baby Boomers. Millennials’ Savings Rates Not Far Behind Other Workers Millennials appear to fall behind Gen X-ers and Baby Boomers in liquid savings. Gen X-ers have over 8 times more liquid savings than Millennials, even though Gen X-ers have only 40% more income than Millennials. Richard Fry, "This year, Millennials will overtake Baby Boomers," Pew Research Center, January 15, 2015, http:// 1 www.pewresearch.org/fact-tank/2015/01/16/this-year-millennials-will-overtake-baby-boomers/ Steven Rattner, "We're Making Life Too Hard for Millennials," The New York Times, July 31, 2015, http:// 2 www.nytimes.com/2015/08/02/opinion/sunday/were-making-life-too-hard-for-millennials.html?_r=0 Gen X-ers have over 8 times more liquid savings than Millennials.” “ 1 1
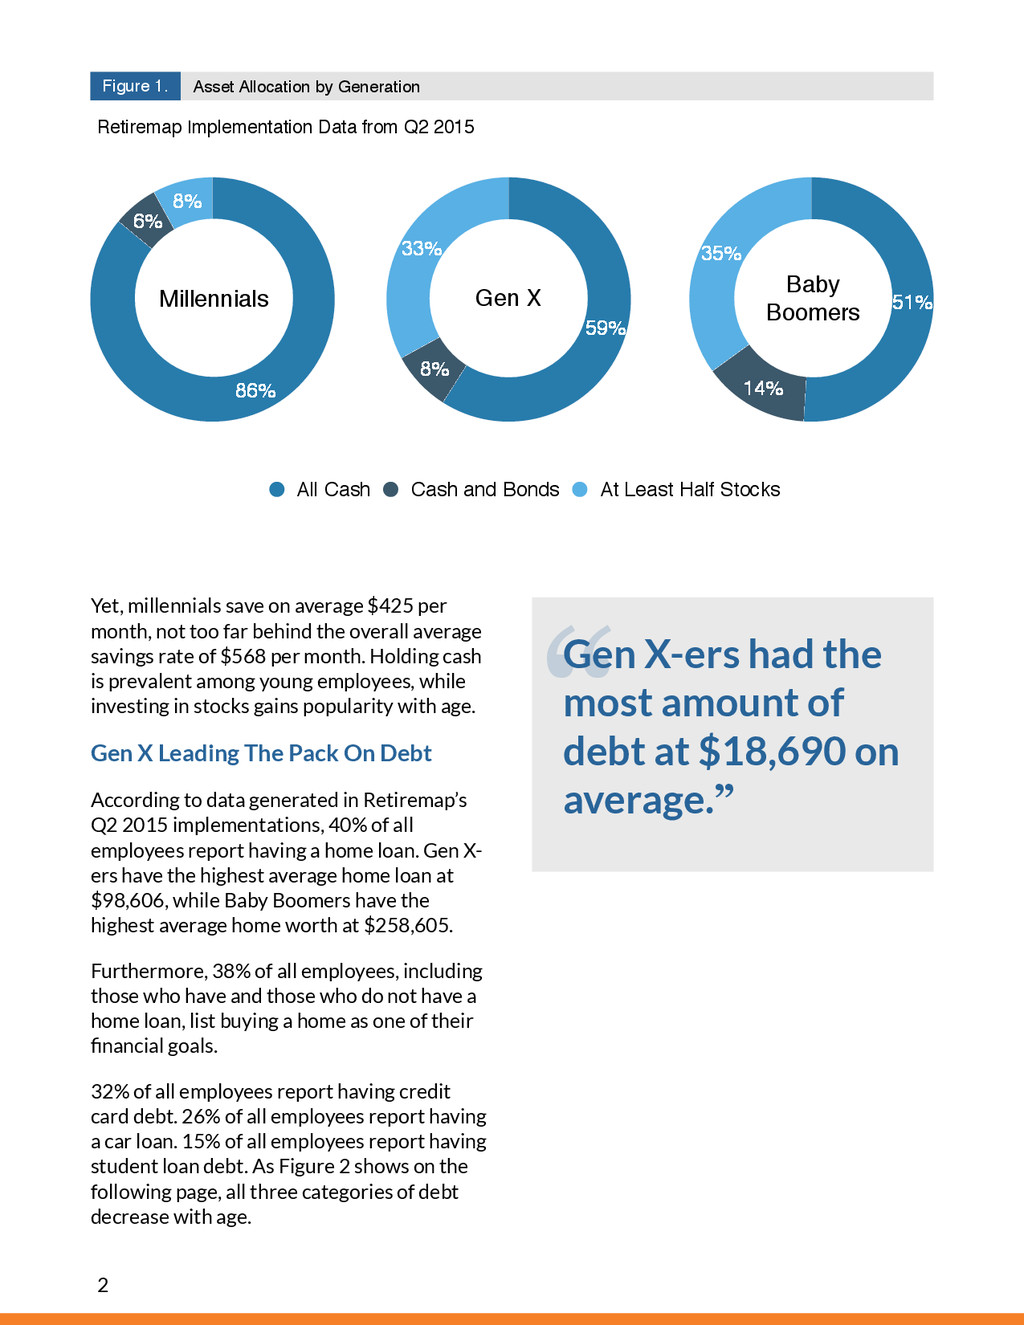
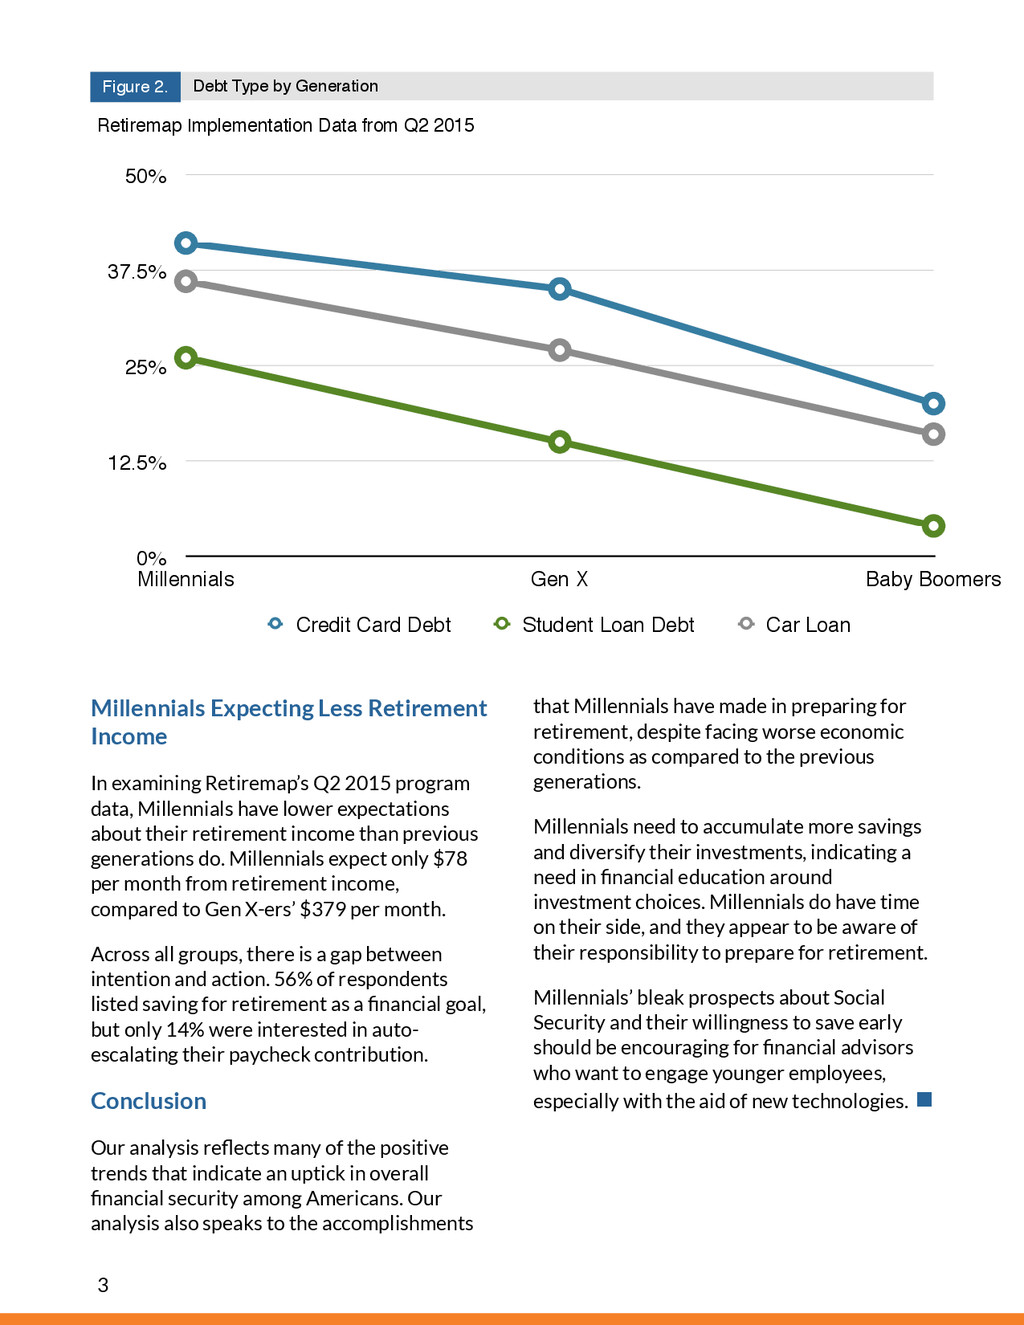
too far behind the overall average savings rate of $568 per month. Holding cash is prevalent among young employees, while investing in stocks gains popularity with age. Gen X Leading The Pack On Debt According to data generated in Retiremap’s Q2 2015 implementations, 40% of all employees report having a home loan. Gen X- ers have the highest average home loan at $98,606, while Baby Boomers have the highest average home worth at $258,605. Furthermore, 38% of all employees, including those who have and those who do not have a home loan, list buying a home as one of their financial goals. 32% of all employees report having credit card debt. 26% of all employees report having a car loan. 15% of all employees report having student loan debt. As Figure 2 shows on the following page, all three categories of debt decrease with age. Asset Allocation by Generation Figure 1. Retiremap Implementation Data from Q2 2015 8% 6% 86% All Cash Cash and Bonds At Least Half Stocks Millennials 33% 8% 59% Gen X 35% 14% 51% Baby Boomers Gen X-ers had the most amount of debt at $18,690 on average.” “ 2
program data, Millennials have lower expectations about their retirement income than previous generations do. Millennials expect only $78 per month from retirement income, compared to Gen X-ers’ $379 per month. Across all groups, there is a gap between intention and action. 56% of respondents listed saving for retirement as a financial goal, but only 14% were interested in auto- escalating their paycheck contribution. Conclusion Our analysis reflects many of the positive trends that indicate an uptick in overall financial security among Americans. Our analysis also speaks to the accomplishments that Millennials have made in preparing for retirement, despite facing worse economic conditions as compared to the previous generations. Millennials need to accumulate more savings and diversify their investments, indicating a need in financial education around investment choices. Millennials do have time on their side, and they appear to be aware of their responsibility to prepare for retirement. Millennials’ bleak prospects about Social Security and their willingness to save early should be encouraging for financial advisors who want to engage younger employees, especially with the aid of new technologies. ! Debt Type by Generation Figure 2. Retiremap Implementation Data from Q2 2015 0% 12.5% 25% 37.5% 50% Millennials Gen X Baby Boomers Credit Card Debt Student Loan Debt Car Loan 3
and Analysis The PricewaterhouseCooper’s Employee Financial Wellness Survey 2015 found that Millennials are catching up to older generations across several factors of financial wellbeing. However, 35% of Millennials still find it difficult to meet household expenses on time (compared to 41% last year). 77% of all employees are saving for retirement, but 23% have already withdrawn money held in retirement plans to pay for other expenses and 35% think it’s likely they will need to do so. The PwC study also found that more than 60% of employees think that Social Security benefits will either not be available or will be reduced when they retire. 48% of Millennials think that Social Security benefits will not be available, compared to 36% of Gen X-ers and 10% of Baby Boomers. The Bank of America Merrill Lynch 2015 Workplace Benefits Report found that 60% of employers believe that Millennials value health benefits more than other generations. Employers who market benefit packages to specific generations are much more likely to have targeted communications for Gen X-ers or Baby Boomers than for Millennials. The MetLife 2014 &2015 Employee Benefit Trends Study found that Millennials’ key financial concern is “progress made toward financial security.” The Hartford Funds Advisor Anxiety Survey 2015 found that 56% of financial advisors said that they attract Millennial clients “less than other age groups” or “not at all.” Yet, 70% report that they target clients in the late-twenties to mid-thirties age range. New Expectations, New Rewards: Work in Retirement for Middle-income Boomers, a study from the Center for a Secure Retirement, found that 60% of middle-income Boomers plan to work in retirement, primarily because they will want to work. The study defined middle-income Americans as having an annual household income between $25,000 and $100,000 and with less than $1 million in investable assets. According to the New York Times, Millennials have less wealth than previous generations; Millennials’s median net worth was under $10,400 in 2013, down from the $18,200 that Gen X- ers had when they were under 35 in 1995. Homeownership among Americans under 35 reached 34.8% in 2015, the lowest point since the Census Bureau began tracking the metric in 1994. By the time Millennials retire in 2045, federal debt as a percent of G.D.P is projected to be over 100%, up from 74% in 2015. T. Rowe Price’s Retirement Saving & Spending Study found that Millennials with 401(k)s have relatively good financial habits, especially in comparison to Baby Boomers with 401(k)s. 4
Boomers (as a percentage of annual salary) and are more likely to track expenses and budget. Furthermore, more Millennials wish their employers enrolled them in 401(k)s at a higher contribution rate, want more advice and are more likely to use robo-advisers. 60% of Millennials in T. Rowe Price’s study agreed with the statement, “I expect Social Security to go bankrupt before I retire.” Retirement Throughout the Ages: Expectations and Preparations of American Workers from Transamerica Center for Retirement Studies found that workers in their twenties start saving at the median age of 22, despite having credit card debt and student loans. However, 37% say they know “nothing” about asset allocation. 76% of workers in their 30s are saving for retirement; 57% say they “guessed” about their retirement saving needs. Retiremap Bishop Ranch 3 2603 Camino Ramon, Suite 200 San Ramon, CA 94583 (925) 242-2500 [email protected] Retiremap is the first financial wellness program designed for how retirement plan advisors work with employees. Retiremap’s award-winning program combines today's technology, behavioral economics and your trusted retirement plan advisor to engage employees and help them achieve their financial goals. Retiremap’s custom online campaigns and Plan For Your Future iPad workshops drive the retirement plan concept in fresh new ways, while gathering data on key financial wellness issues for employees. By measuring and documenting the program’s positive impact, Retiremap enhances transparency, while reducing fiduciary liability for the employer. 5