This talk presents a discussion of the central limit theorem as applied to EXAFS. Examples are given and the implications of measurement statistics on the design of your experiment are discussed.
Always Works! Statistics, EXAFS, and Knowing when to stop measuring data Bruce Ravel Synchrotron Methods Group, Ceramics Division Materials Measurement Laboratory National Institute of Standards and Technology & Local Contact, Beamline X23A2 National Synchrotron Light Source July 3, 2012 1 / 20 The Central Limit Thoerem Always Works!
copyright c 2010-2011 Bruce Ravel. This work is licensed under the Creative Commons Attribution-ShareAlike License. To view a copy of this license, visit http://creativecommons.org/licenses/by-sa/3.0/ or send a letter to Creative Commons, 559 Nathan Abbott Way, Stanford, California 94305, USA. You are free: to Share to copy, distribute, and transmit the work to Remix to adapt the work to make commercial use of the work Under the following conditions: Attribution – You must attribute the work in the manner specified by the author or licensor (but not in any way that suggests that they endorse you or your use of the work). Share Alike – If you alter, transform, or build upon this work, you may distribute the resulting work only under the same, similar or a compatible license. With the understanidng that: Waiver – Any of the above conditions can be waived if you get permission from the copyright holder. Public Domain – Where the work or any of its elements is in the public domain under applicable law, that status is in no way affected by the license. Other Rights – In no way are any of the following rights affected by the license: Your fair dealing or fair use rights, or other applicable copyright exceptions and limitations; The author’s moral rights; Rights other persons may have either in the work itself or in how the work is used, such as publicity or privacy rights. Notice – For any reuse or distribution, you must make clear to others the license terms of this work. This is a human-readable summary of the Legal Code (the full license). 2 / 20 The Central Limit Thoerem Always Works!
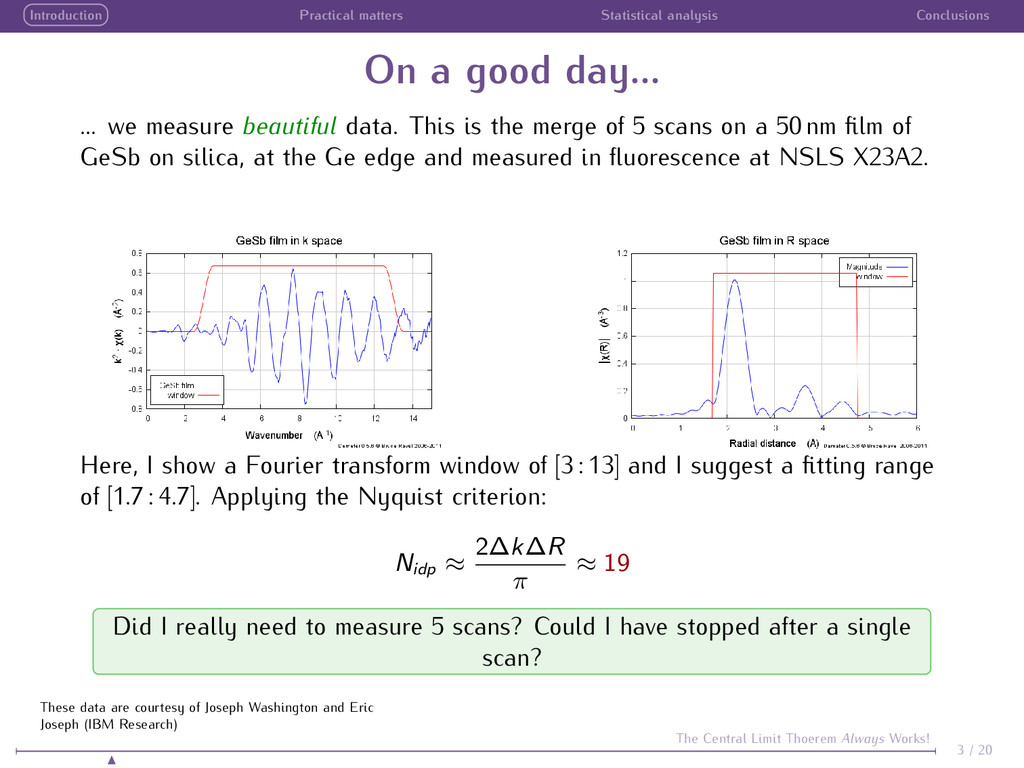
... we measure beautiful data. This is the merge of 5 scans on a 50 nm film of GeSb on silica, at the Ge edge and measured in fluorescence at NSLS X23A2. Here, I show a Fourier transform window of [3 : 13] and I suggest a fitting range of [1.7 : 4.7]. Applying the Nyquist criterion: Nidp ≈ 2∆k∆R π ≈ 19 Did I really need to measure 5 scans? Could I have stopped after a single scan? 3 / 20 The Central Limit Thoerem Always Works! These data are courtesy of Joseph Washington and Eric Joseph (IBM Research)
of the days... ... we measure ... ummm ... less-than-beautiful data. This is the merge of 42 scans on a solution containing 3 mM of Hg bound to a synthetic DNA complex, measured in fluorescence at APS 20BM. Here, I show a Fourier transform window of [2 : 8.8] and I suggest a fitting range of [1 : 3]. Applying the Nyquist criterion: Nidp ≈ 2∆k∆R π ≈ 8 Many real research problems are more like this. Why were 42 scans measured? Was that too many? Not enough? How can we know? 4 / 20 The Central Limit Thoerem Always Works! B. Ravel, et al., EXAFS studies of catalytic DNA sensors for mercury contamination of water, Radiation Physics and Chemistry 78:10 (2009) pp S75-S79. DOI:10.1016/j.radphyschem.2009.05.024
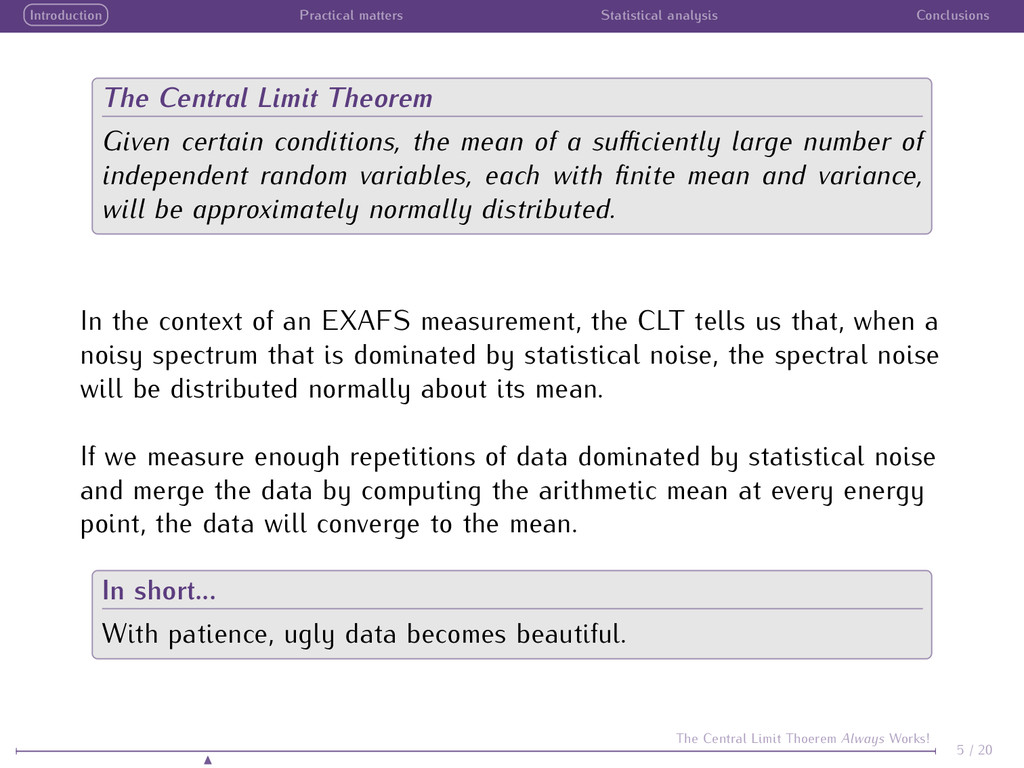
Given certain conditions, the mean of a sufficiently large number of independent random variables, each with finite mean and variance, will be approximately normally distributed. In the context of an EXAFS measurement, the CLT tells us that, when a noisy spectrum that is dominated by statistical noise, the spectral noise will be distributed normally about its mean. If we measure enough repetitions of data dominated by statistical noise and merge the data by computing the arithmetic mean at every energy point, the data will converge to the mean. In short... With patience, ugly data becomes beautiful. 5 / 20 The Central Limit Thoerem Always Works!
of thumb Before making a measurement, you have no idea what the data will look like. You cannot know how many repetitions will be required before examining the first scan. One scan? Never∗ measure a single scan. How would you know if something went wrong with the measurement? Two scans? What if the two repetitions are different? How do know which one is right? Three scans? There you go! Now you can know which on is right. Always plan on at least three repetitions. 6 / 20 The Central Limit Thoerem Always Works! ∗ Did I just say “never”? Yikes! Never say “never”! Why, on the very next page I am going to show examples where single scans were measured.
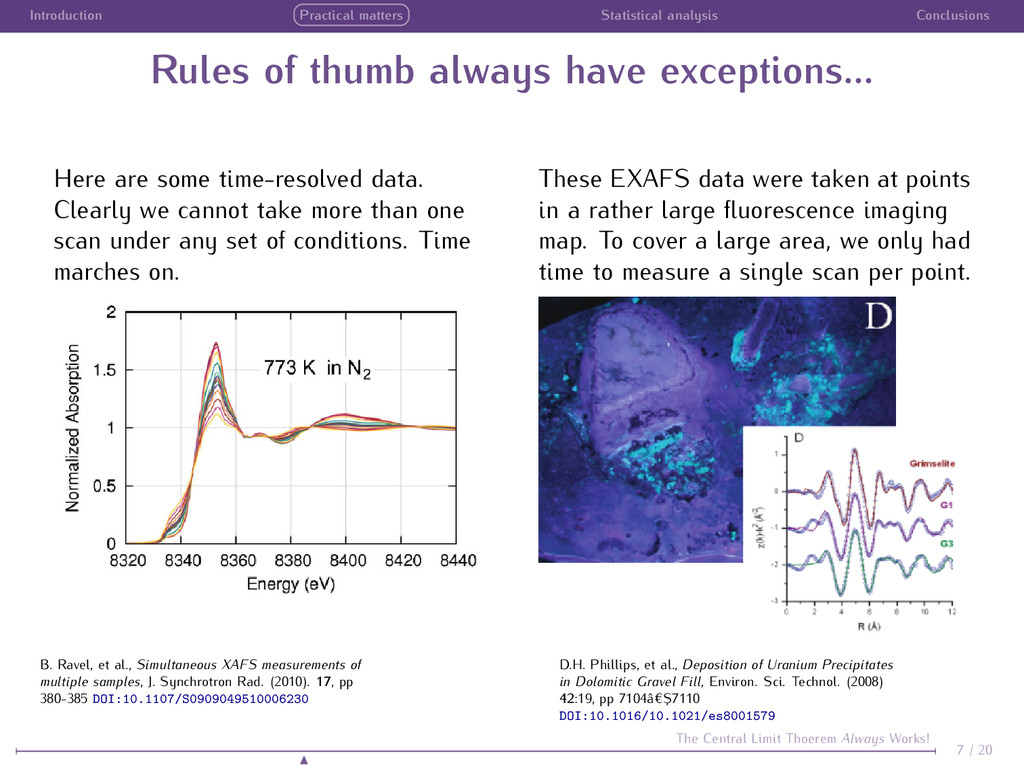
have exceptions... Here are some time-resolved data. Clearly we cannot take more than one scan under any set of conditions. Time marches on. These EXAFS data were taken at points in a rather large fluorescence imaging map. To cover a large area, we only had time to measure a single scan per point. 7 / 20 The Central Limit Thoerem Always Works! B. Ravel, et al., Simultaneous XAFS measurements of multiple samples, J. Synchrotron Rad. (2010). 17, pp 380-385 DOI:10.1107/S0909049510006230 D.H. Phillips, et al., Deposition of Uranium Precipitates in Dolomitic Gravel Fill, Environ. Sci. Technol. (2008) 42:19, pp 7104â€Ș7110 DOI:10.1016/10.1021/es8001579
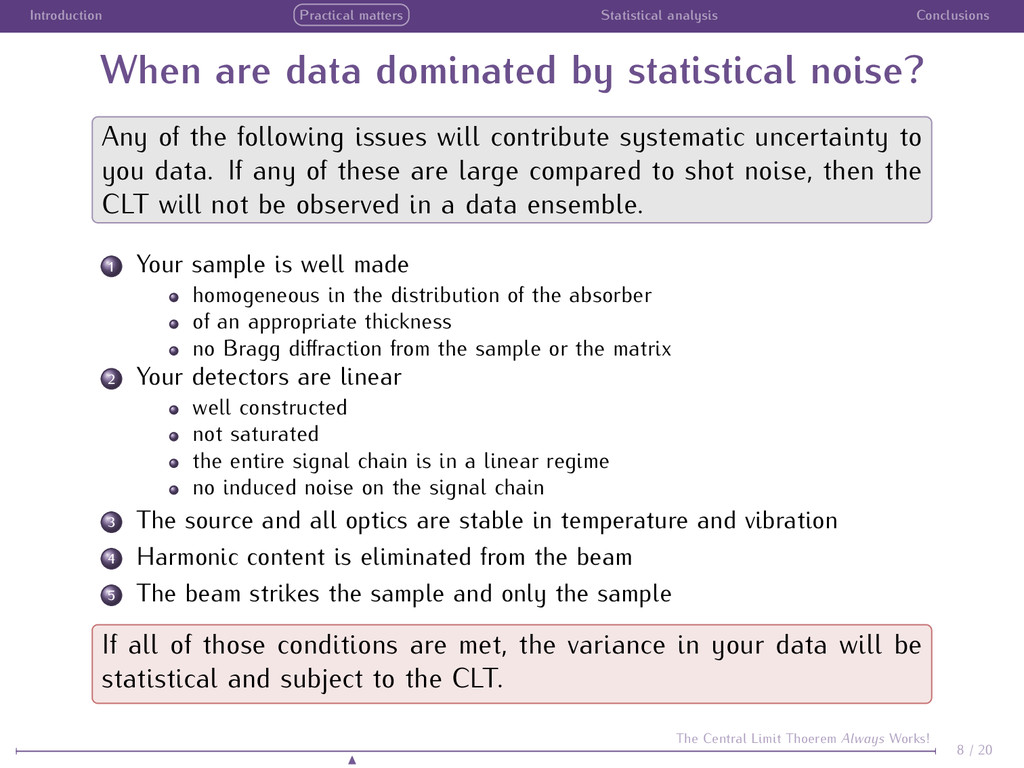
by statistical noise? Any of the following issues will contribute systematic uncertainty to you data. If any of these are large compared to shot noise, then the CLT will not be observed in a data ensemble. 1 Your sample is well made homogeneous in the distribution of the absorber of an appropriate thickness no Bragg diffraction from the sample or the matrix 2 Your detectors are linear well constructed not saturated the entire signal chain is in a linear regime no induced noise on the signal chain 3 The source and all optics are stable in temperature and vibration 4 Harmonic content is eliminated from the beam 5 The beam strikes the sample and only the sample If all of those conditions are met, the variance in your data will be statistical and subject to the CLT. 8 / 20 The Central Limit Thoerem Always Works!
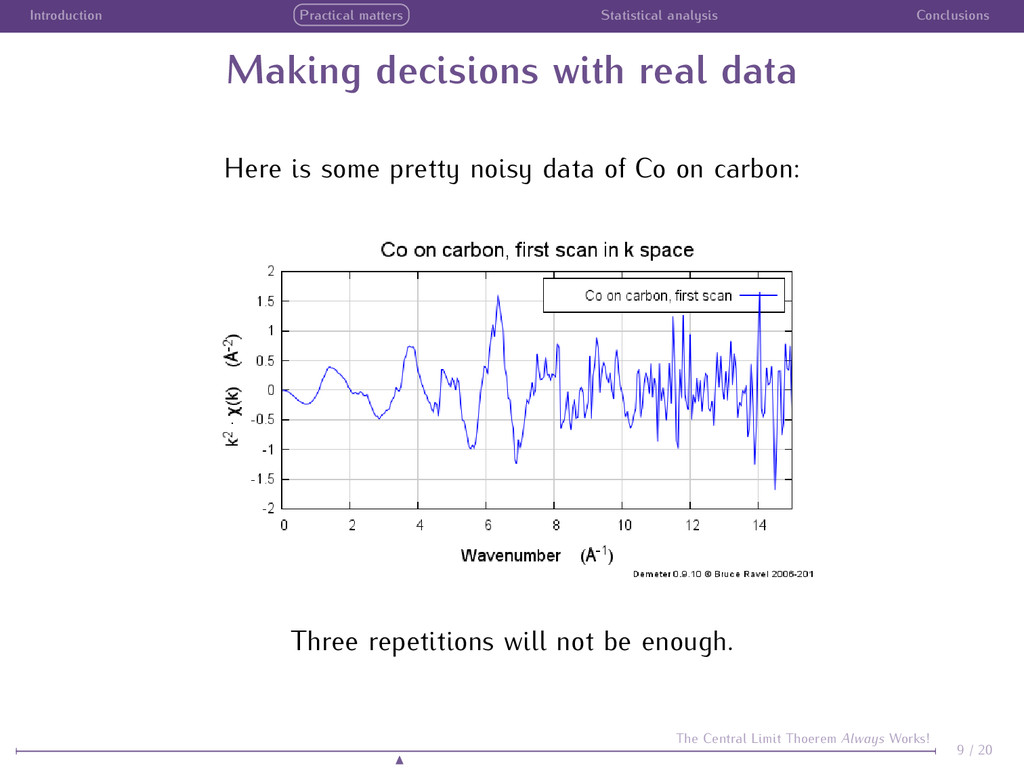
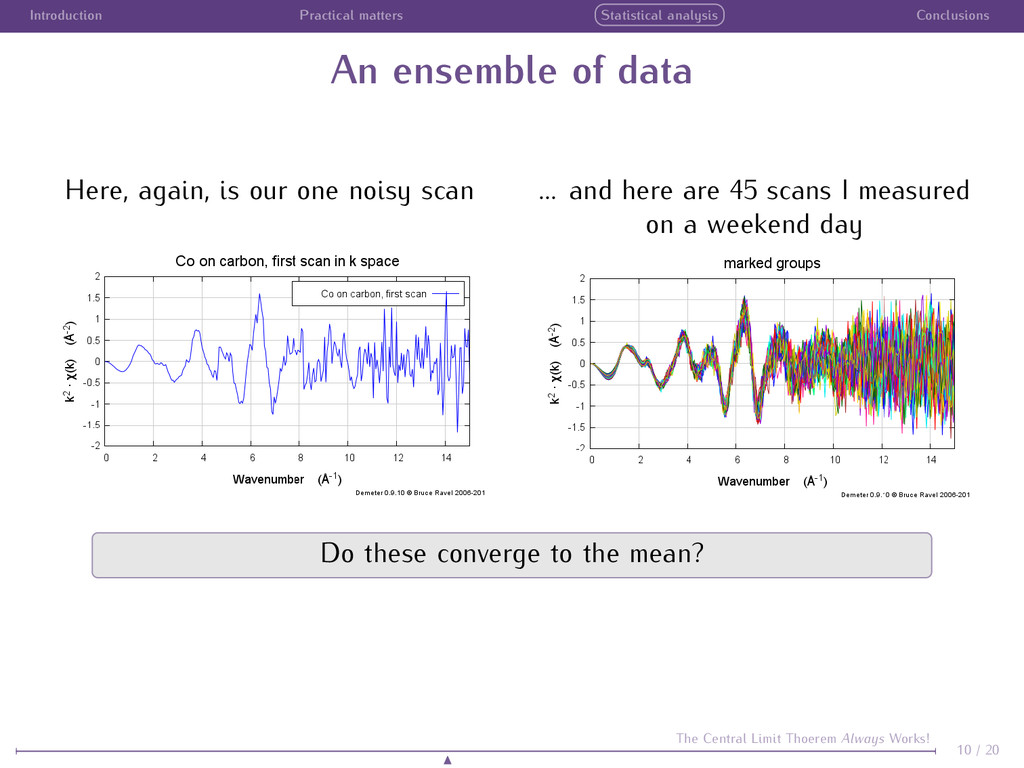
Here, again, is our one noisy scan ... and here are 45 scans I measured on a weekend day Do these converge to the mean? 10 / 20 The Central Limit Thoerem Always Works!
is the single scan compared as k2 · χ(k) to the merge of all 45 And as |˜ χ(R)| A day’s worth of patience paid off! The merge of the 45 scans is fairly beautiful data, even if each individual scan seems hopelessly noisy. 11 / 20 The Central Limit Thoerem Always Works!
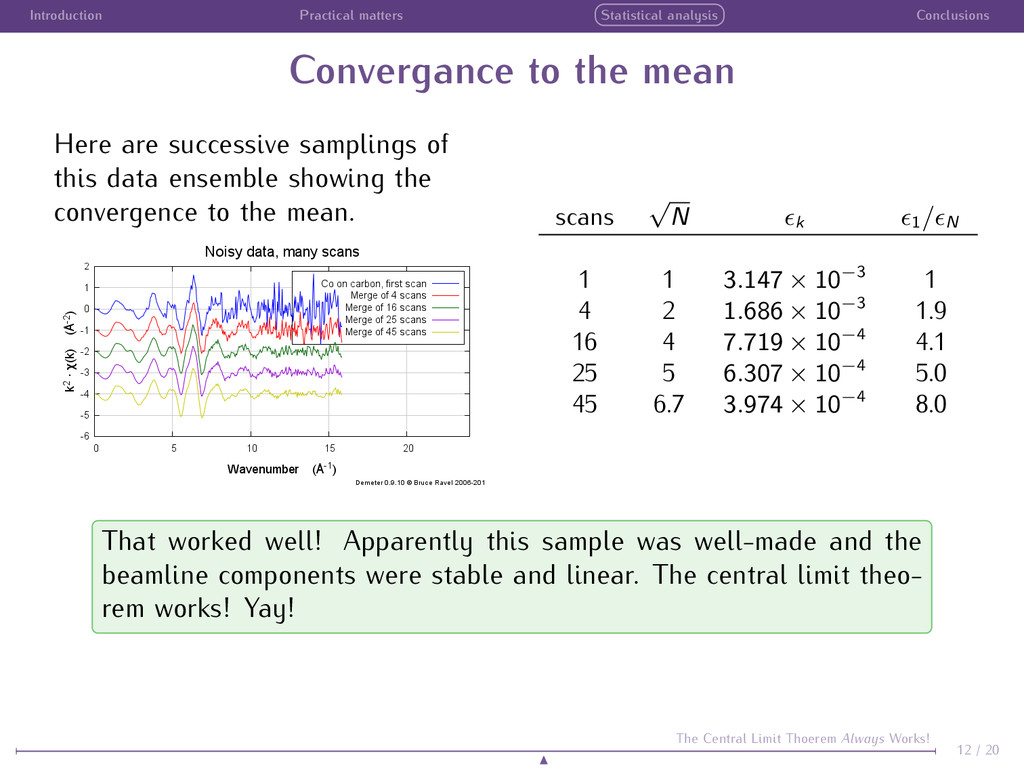
Here are successive samplings of this data ensemble showing the convergence to the mean. scans √ N k 1/ N 1 1 3.147 × 10⁻³ 1 4 2 1.686 × 10⁻³ 1.9 16 4 7.719 × 10⁻⁴ 4.1 25 5 6.307 × 10⁻⁴ 5.0 45 6.7 3.974 × 10⁻⁴ 8.0 That worked well! Apparently this sample was well-made and the beamline components were stable and linear. The central limit theo- rem works! Yay! 12 / 20 The Central Limit Thoerem Always Works!
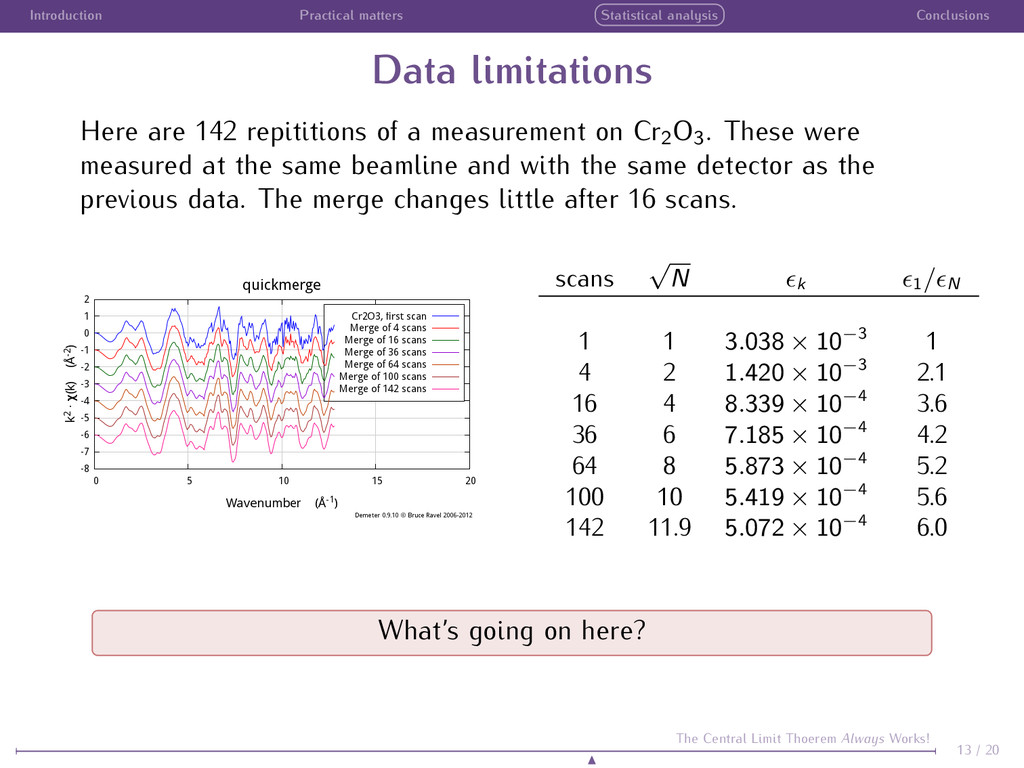
142 repititions of a measurement on Cr2 O3 . These were measured at the same beamline and with the same detector as the previous data. The merge changes little after 16 scans. scans √ N k 1/ N 1 1 3.038 × 10⁻³ 1 4 2 1.420 × 10⁻³ 2.1 16 4 8.339 × 10⁻⁴ 3.6 36 6 7.185 × 10⁻⁴ 4.2 64 8 5.873 × 10⁻⁴ 5.2 100 10 5.419 × 10⁻⁴ 5.6 142 11.9 5.072 × 10⁻⁴ 6.0 What’s going on here? 13 / 20 The Central Limit Thoerem Always Works!
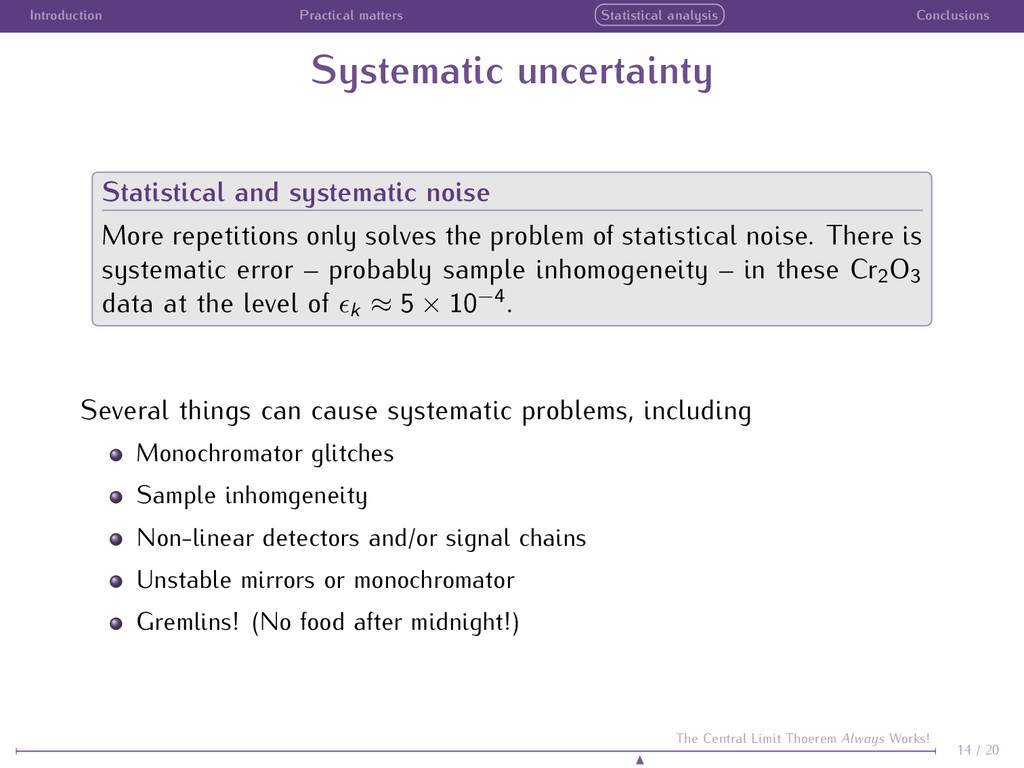
systematic noise More repetitions only solves the problem of statistical noise. There is systematic error – probably sample inhomogeneity – in these Cr2 O3 data at the level of k ≈ 5 × 10⁻⁴. Several things can cause systematic problems, including Monochromator glitches Sample inhomgeneity Non-linear detectors and/or signal chains Unstable mirrors or monochromator Gremlins! (No food after midnight!) 14 / 20 The Central Limit Thoerem Always Works!
gross systematic problem Here’s an obvious example of a systematic problem. These data were measured with a detector that has an energy-dependent non-linearity. No number of repititions will ever fix that feature of the data. The only solution is to fix the detection problem. 15 / 20 The Central Limit Thoerem Always Works!
be a fool’s game Counting statistics is mean-spirited and N2 is an unhappy requirement. Here again is the convergance of the Co on carbon data. It took 45 scans – about 13 hours at my beamline – to turn these data into the sort of excellent EXAFS data we like to work on. We typically give users 3 days of beamtime, enough for 5 or 6 such samples. Sometimes we have to compromise on data quality in order to measure enough samples to make a full experiment. 16 / 20 The Central Limit Thoerem Always Works!
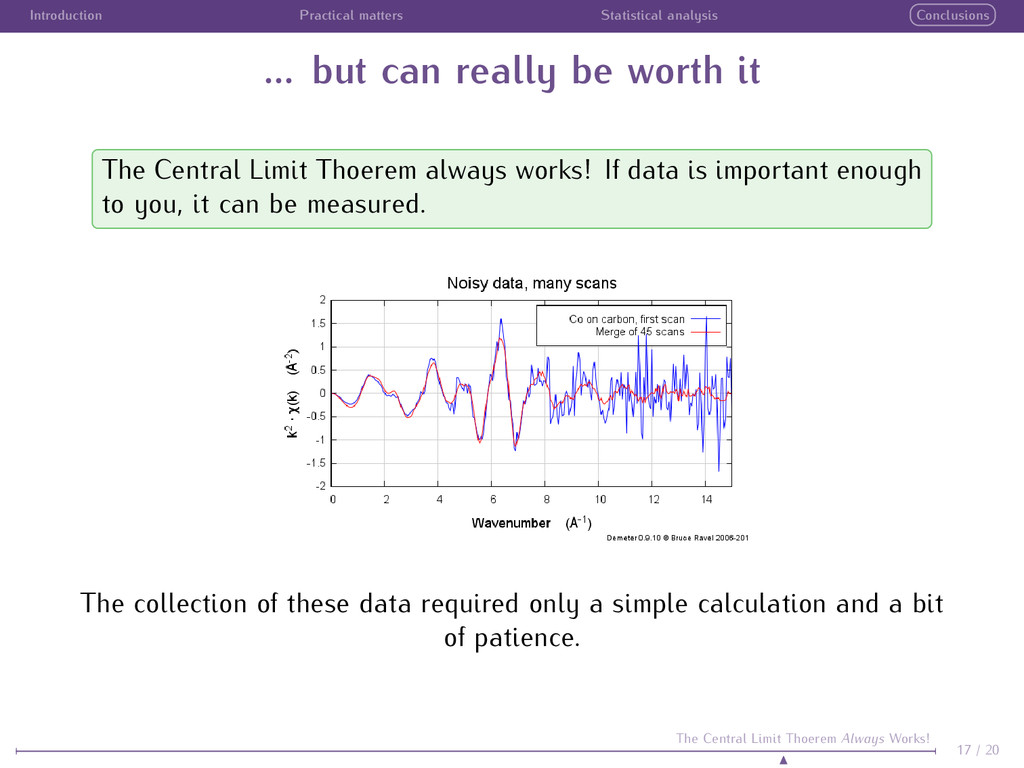
be worth it The Central Limit Thoerem always works! If data is important enough to you, it can be measured. The collection of these data required only a simple calculation and a bit of patience. 17 / 20 The Central Limit Thoerem Always Works!
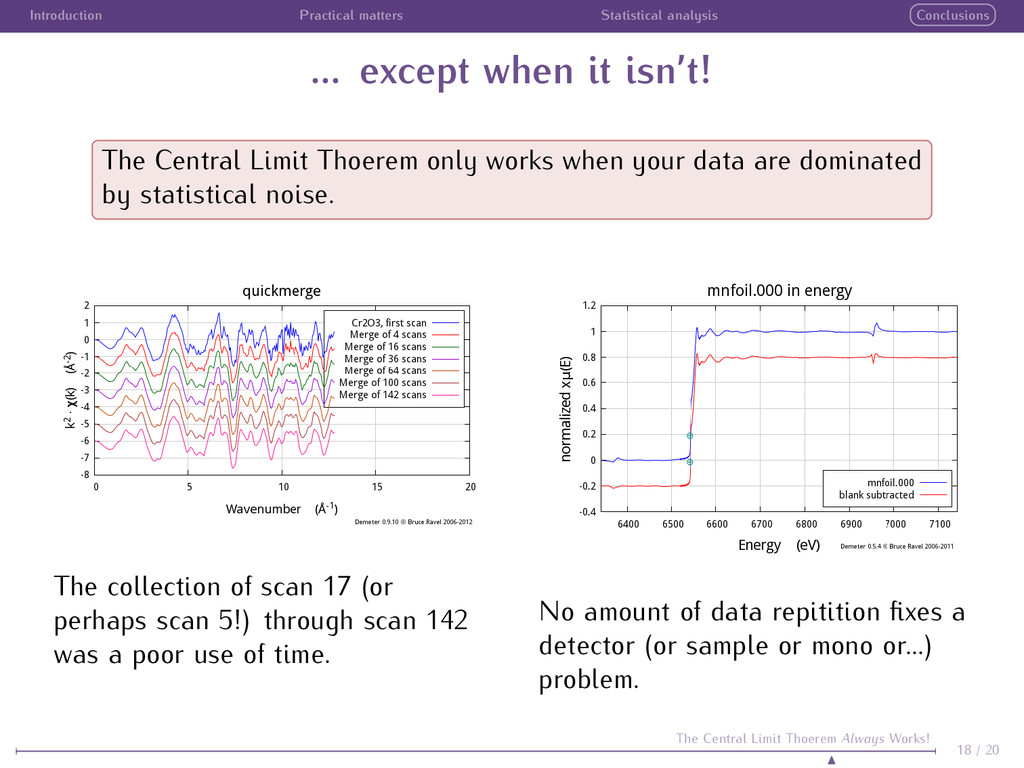
isn’t! The Central Limit Thoerem only works when your data are dominated by statistical noise. The collection of scan 17 (or perhaps scan 5!) through scan 142 was a poor use of time. No amount of data repitition fixes a detector (or sample or mono or...) problem. 18 / 20 The Central Limit Thoerem Always Works!
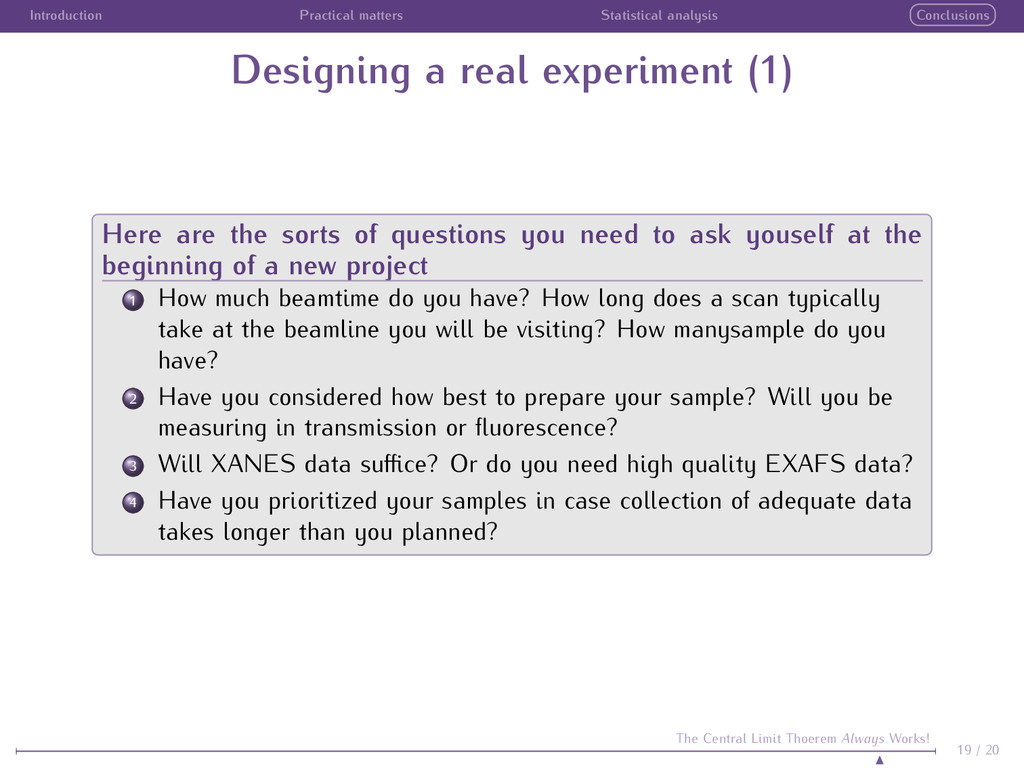
(1) Here are the sorts of questions you need to ask youself at the beginning of a new project 1 How much beamtime do you have? How long does a scan typically take at the beamline you will be visiting? How manysample do you have? 2 Have you considered how best to prepare your sample? Will you be measuring in transmission or fluorescence? 3 Will XANES data suffice? Or do you need high quality EXAFS data? 4 Have you prioritized your samples in case collection of adequate data takes longer than you planned? 19 / 20 The Central Limit Thoerem Always Works!
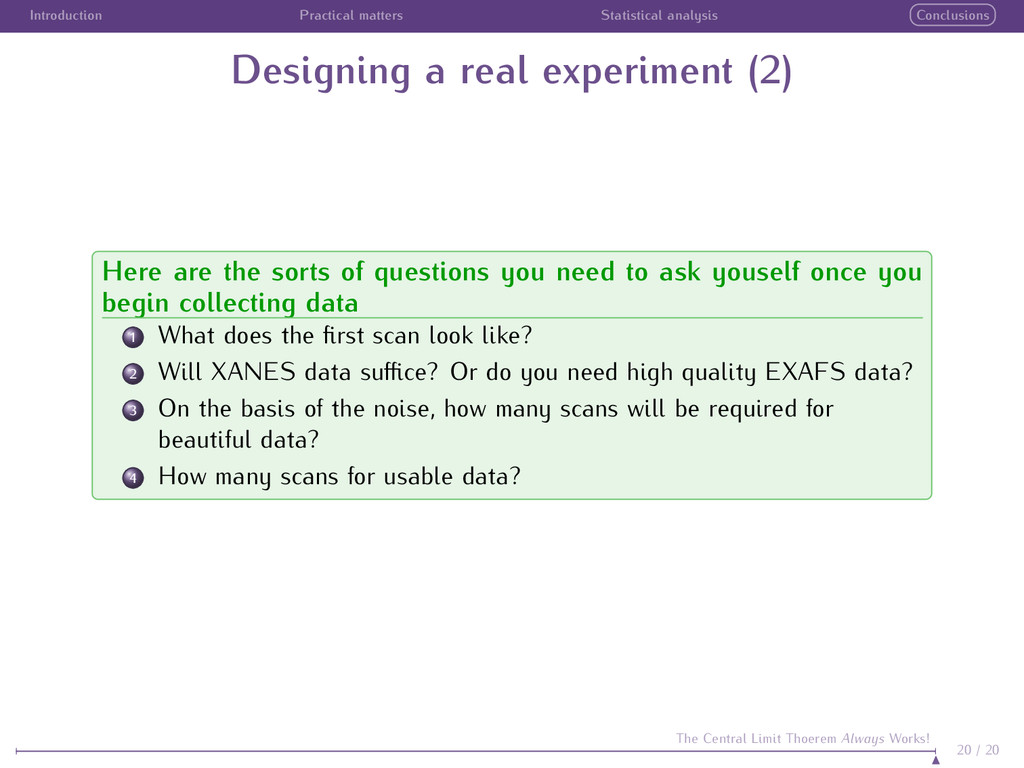
(2) Here are the sorts of questions you need to ask youself once you begin collecting data 1 What does the first scan look like? 2 Will XANES data suffice? Or do you need high quality EXAFS data? 3 On the basis of the noise, how many scans will be required for beautiful data? 4 How many scans for usable data? 20 / 20 The Central Limit Thoerem Always Works!