learn from experience E with respect to some class of tasks T and performance measure P, if its performance at tasks in T, as measured by P, improves with experience E" (Tom Mitchell)
• classification • clustering General purposes: • prediction (maximize accuracy) • inference (maximize interpretability) Evaluation criteria may vary: • minimizing mean error vs reducing the number of extreme results • accuracy vs reducing the number of false positives/negatives
a programming language, but as an environment for statistical computing which has a programming language • R was created by Ross Ihaka and Robert Gentleman at the University of Auckland in 1993 • interpreted language • supports both procedural and functional programming • vectors and matrices are first class citizens, many functions are vectorized • open source
• package management is integrated in the core language • vectors and matrices are core language features • great IDE (RStudio) • very good visualizations, more alternatives(lattice, ggplot2, ggvis, ggmaps) • easy data manipulation(dplyr, tidyr, lubridate)
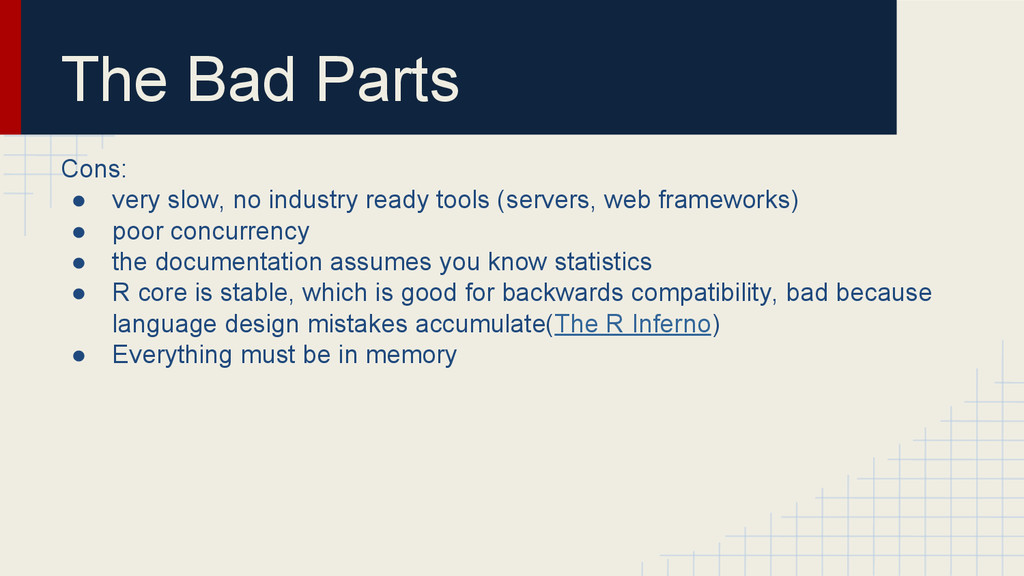
tools (servers, web frameworks) • poor concurrency • the documentation assumes you know statistics • R core is stable, which is good for backwards compatibility, bad because language design mistakes accumulate(The R Inferno) • Everything must be in memory
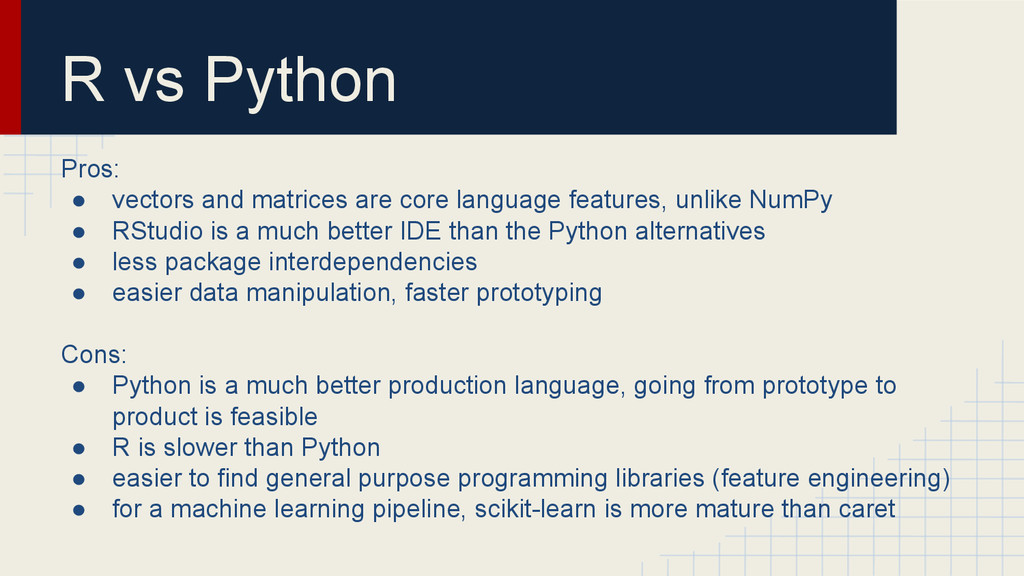
language features, unlike NumPy • RStudio is a much better IDE than the Python alternatives • less package interdependencies • easier data manipulation, faster prototyping Cons: • Python is a much better production language, going from prototype to product is feasible • R is slower than Python • easier to find general purpose programming libraries (feature engineering) • for a machine learning pipeline, scikit-learn is more mature than caret
process of deriving actionable insight from data. “80% of the work is data wrangling”, study presented at the Strata conference “It is an absolute myth that you can send an algorithm over raw data and have insights pop up”, Jeffrey Heer, co-founder of Trifacta “Data wrangling is a huge - and surprisingly so - part of the job”, Monica Rogati, VP at Jawbone “Data Science is 20% statistics and 80% engineering”, Sandy Ryza, Cloudera
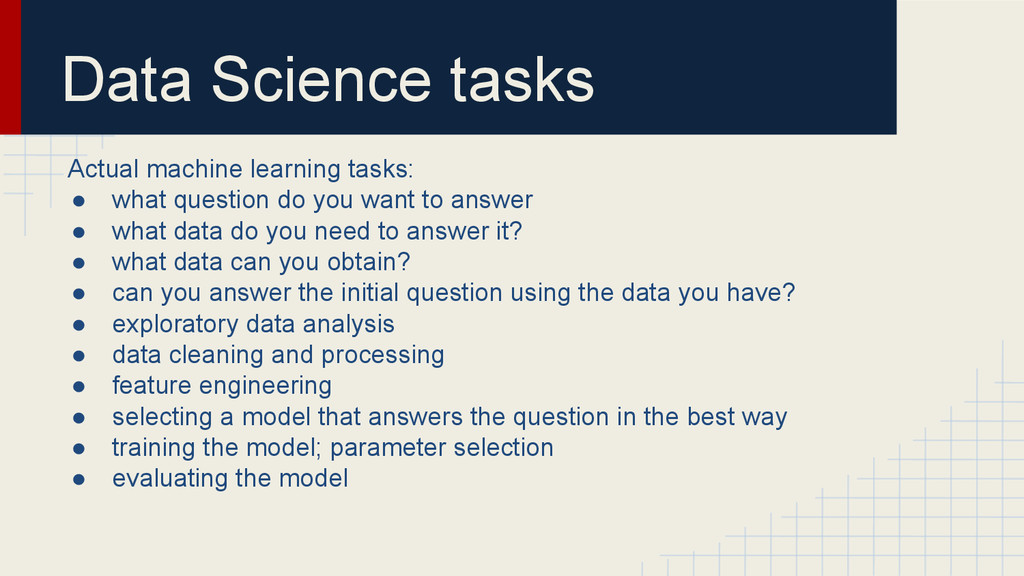
do you want to answer • what data do you need to answer it? • what data can you obtain? • can you answer the initial question using the data you have? • exploratory data analysis • data cleaning and processing • feature engineering • selecting a model that answers the question in the best way • training the model; parameter selection • evaluating the model
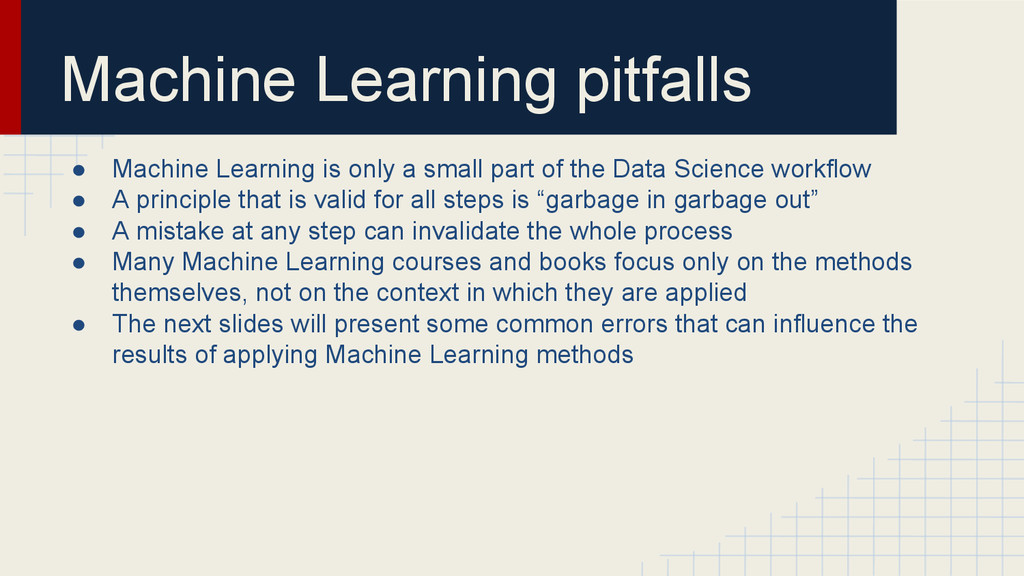
part of the Data Science workflow • A principle that is valid for all steps is “garbage in garbage out” • A mistake at any step can invalidate the whole process • Many Machine Learning courses and books focus only on the methods themselves, not on the context in which they are applied • The next slides will present some common errors that can influence the results of applying Machine Learning methods
the New England Journal of Medicine(2012): “chocolate consumption could hypothetically improve cognitive function not only in individuals but also in whole populations”
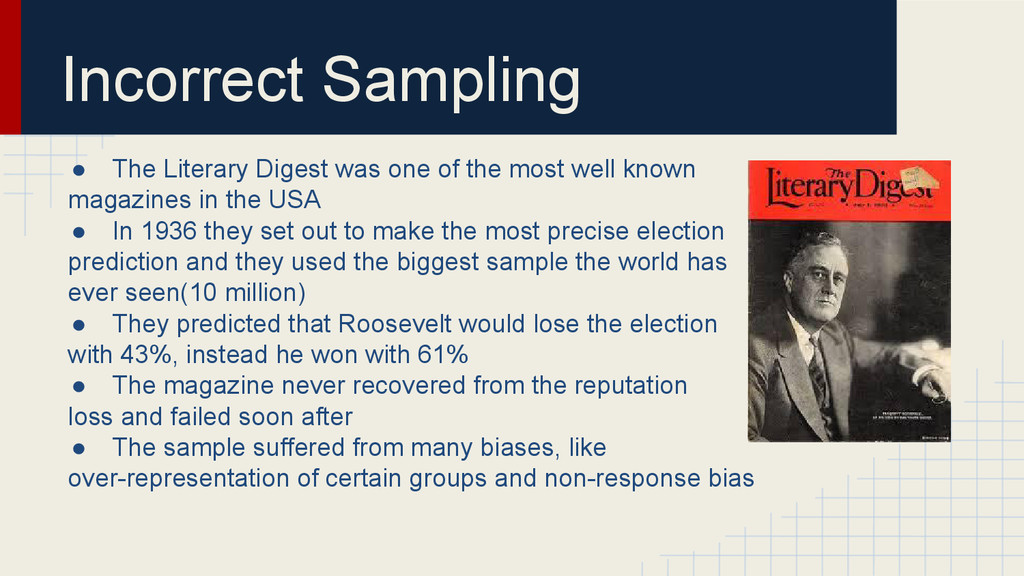
most well known magazines in the USA • In 1936 they set out to make the most precise election prediction and they used the biggest sample the world has ever seen(10 million) • They predicted that Roosevelt would lose the election with 43%, instead he won with 61% • The magazine never recovered from the reputation loss and failed soon after • The sample suffered from many biases, like over-representation of certain groups and non-response bias
version of overfitting • Many statistical methods produce a measure of significance called the p- value (the probability that you can get results at least as extreme as the ones you got given that some hypothesis is true) • The main idea: Measure many things about few subjects and you are almost guaranteed to find statistically significant results • Examples: most social sciences studies with ~30 subjects • An xkcd comic on the subject: https://xkcd.com/882/ • In some parts of academia, due to publication bias this is most of the time not an individual mistake, but an emergent collective behaviour
independence Other Examples: • the decision to allow turning right at red lights is the result of an underpowered study, which said that there would be no difference in the number of accidents, when there actually are 100% more • underpowered studies with <30 subjects also make data dredging very efficient Recommended free e-book: http://www.statisticsdonewrong.com/
dataset consisting of variables with values uniformly distributed between 0 and 1 • We want to eliminate the extreme values from all variables(<=0.05 and >=0.95) • For one dimension, the proportion of remaining data would be 0.9 • For 2 dimensions we would be left with 0.81 of the data • For 50 dimensions, the proportion of data left is 0.005 • In high dimensional spaces almost all points are at the edges • As the number of dimensions grows, you need exponentially more data to build good models
• they do not understand phenomena, but rely on correlations instead • the previous examples were funny, but it can happen to anyone working in an unfamiliar domain • the larger the number of predictors, the more likely it is to find one correlated with the variable you want to predict • more funny correlations: http://www.tylervigen.com/spurious-correlations • The curse of dimensionality and the need for more data to train complex models is one of the reasons why Big Data is such a buzzword
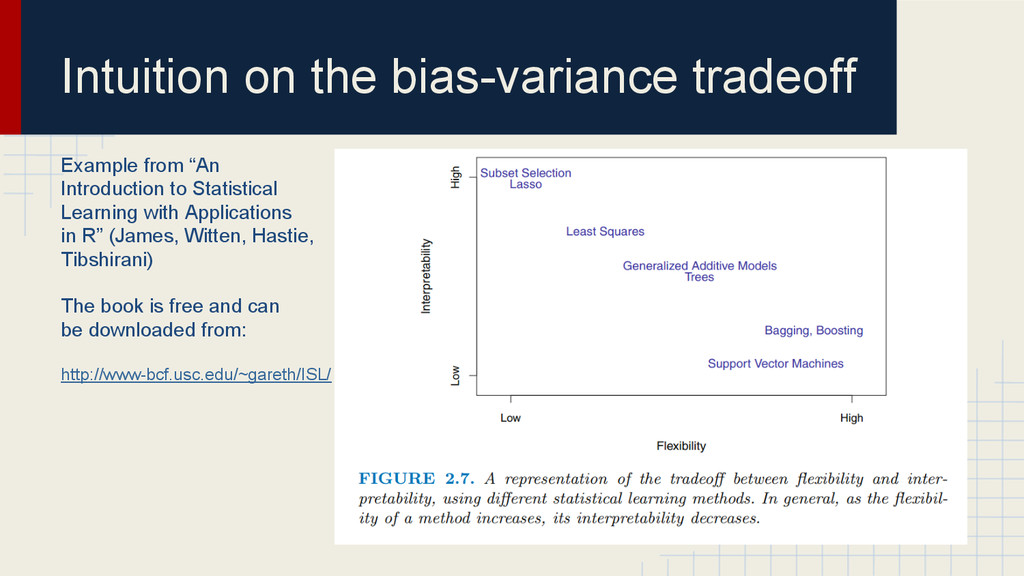
Statistical Learning with Applications in R” (James, Witten, Hastie, Tibshirani) The book is free and can be downloaded from: http://www-bcf.usc.edu/~gareth/ISL/
are applying a very complex model on too few data points or on a noisy dataset • Overfitting can be much subtler, as seen on the “Data dredging” slide • One of the most common forms of overfitting that is not recognized as such is picking a model or model parameters based on the test set results • A very good list of overfitting methods: http://hunch.net/?p=22
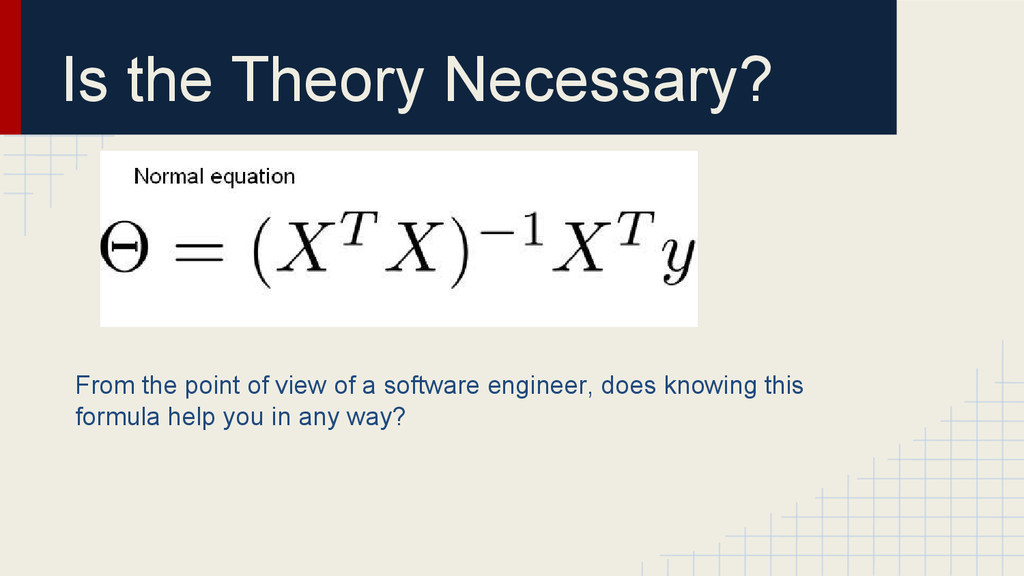
it is used by most linear regression libraries • It doesn’t work for big data • An alternative is gradient descent • There are many methods for gradient descent like L-BFGS, SGD, AdaGrad
is useful when you have a small but representative sample from the whole population • It involves generating new samples by sampling with replacement from the original sample
procedure were still too similar • Individual trees are only allowed to choose one variable out of a random subset to make a split • A good value for the size of the random subset is sqrt(nr. of variables), but it is usually chosen with cross-validation • It is the best performing algorithm on Kaggle(at least until now) • Other studies show that especially for classification problems, it is really hard to beat: Do we Need Hundreds of Classifiers to Solve Real World problems?