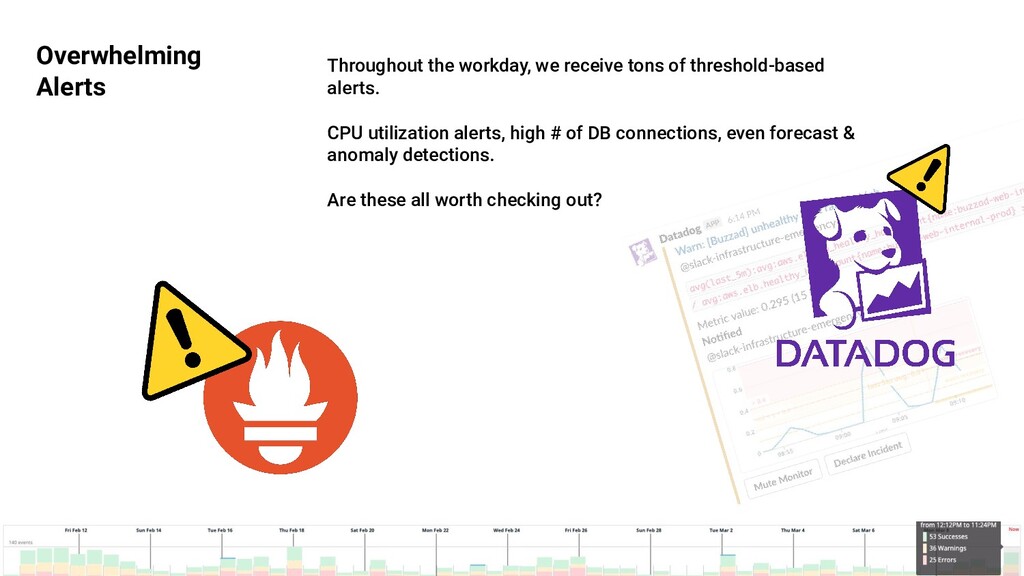
the workday, we receive tons of threshold-based alerts. CPU utilization alerts, high # of DB connections, even forecast & anomaly detections. Are these all worth checking out?
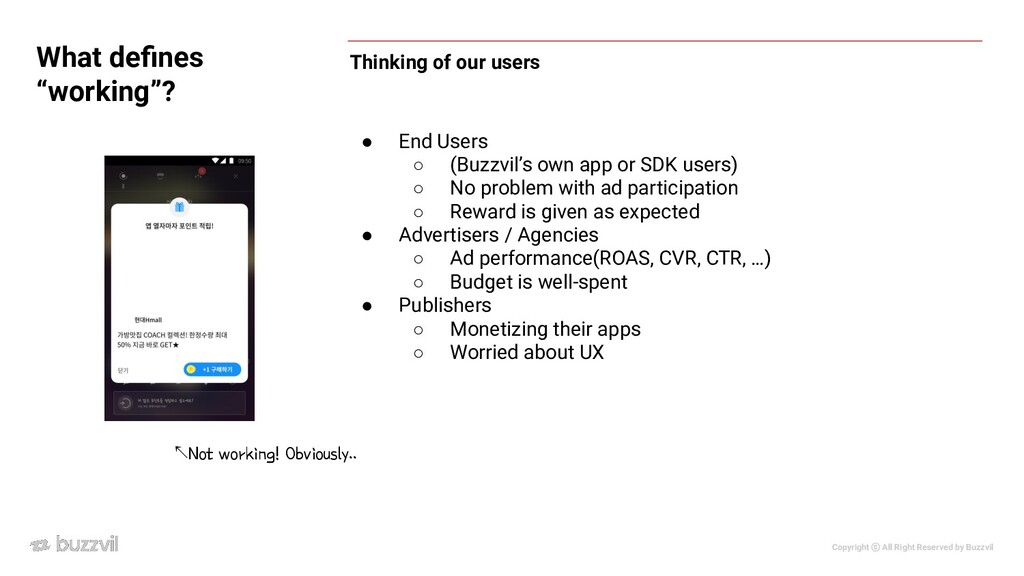
users • End Users ◦ (Buzzvil’s own app or SDK users) ◦ No problem with ad participation ◦ Reward is given as expected • Advertisers / Agencies ◦ Ad performance(ROAS, CVR, CTR, …) ◦ Budget is well-spent • Publishers ◦ Monetizing their apps ◦ Worried about UX What defines “working”? ↖Not working! Obviously..
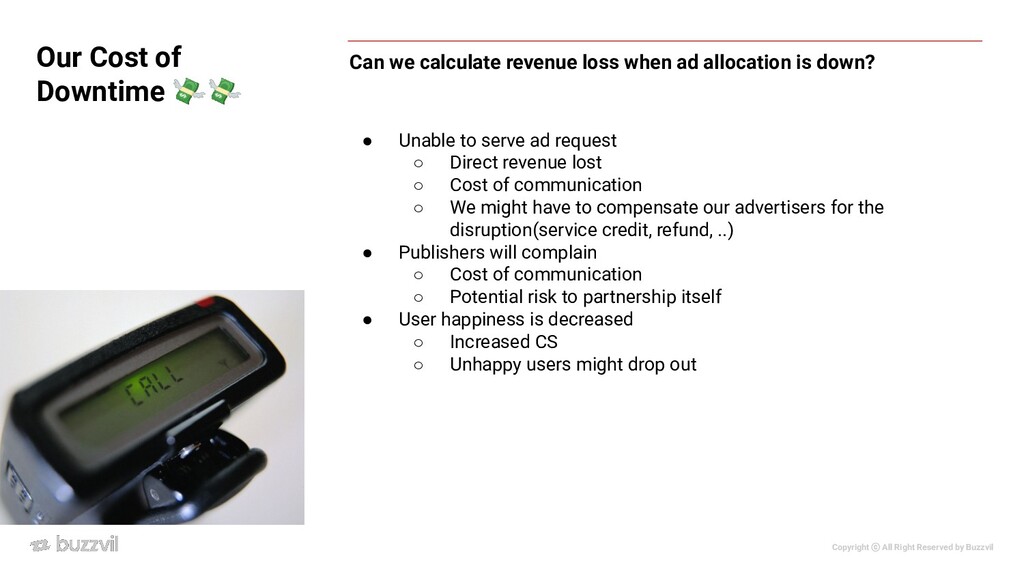
revenue loss when ad allocation is down? Our Cost of Downtime 💸💸 • Unable to serve ad request ◦ Direct revenue lost ◦ Cost of communication ◦ We might have to compensate our advertisers for the disruption(service credit, refund, ..) • Publishers will complain ◦ Cost of communication ◦ Potential risk to partnership itself • User happiness is decreased ◦ Increased CS ◦ Unhappy users might drop out
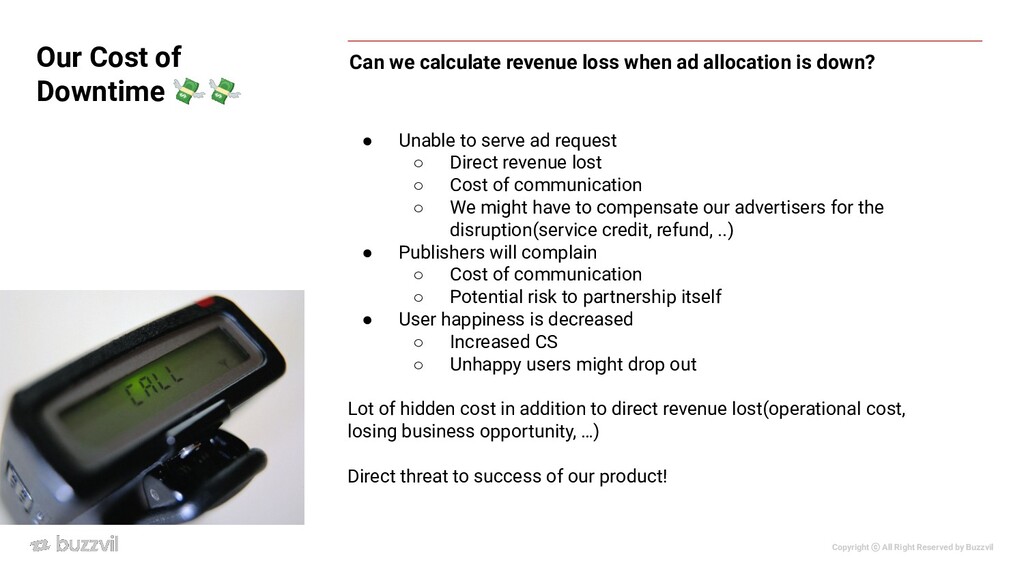
revenue loss when ad allocation is down? Our Cost of Downtime 💸💸 • Unable to serve ad request ◦ Direct revenue lost ◦ Cost of communication ◦ We might have to compensate our advertisers for the disruption(service credit, refund, ..) • Publishers will complain ◦ Cost of communication ◦ Potential risk to partnership itself • User happiness is decreased ◦ Increased CS ◦ Unhappy users might drop out Lot of hidden cost in addition to direct revenue lost(operational cost, losing business opportunity, …) Direct threat to success of our product!
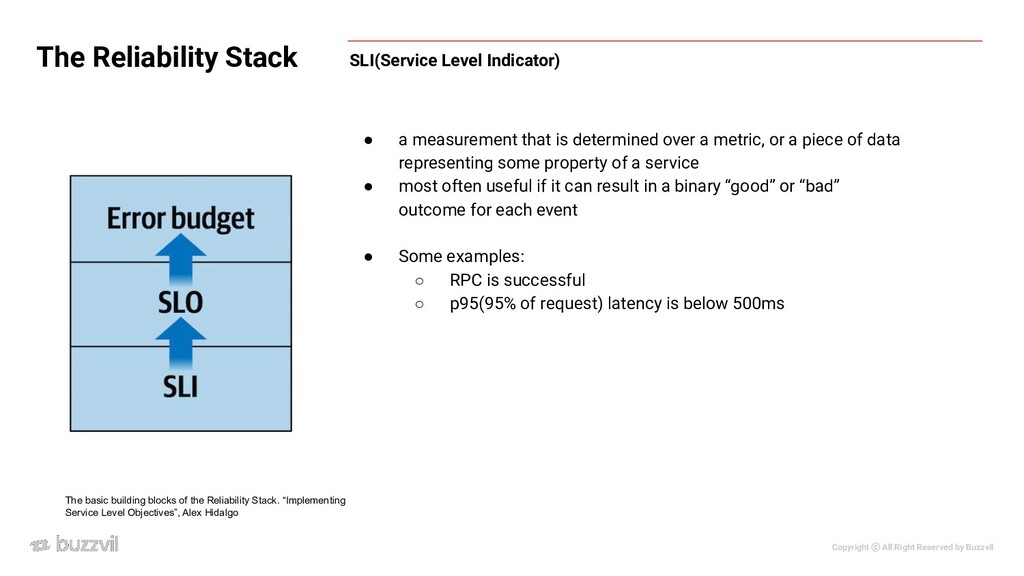
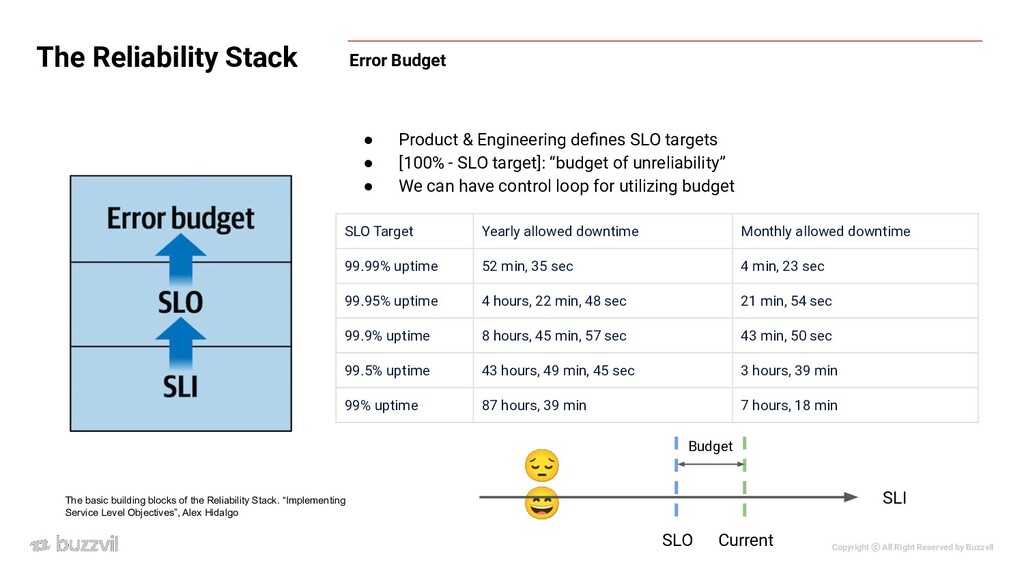
that is determined over a metric, or a piece of data representing some property of a service • most often useful if it can result in a binary “good” or “bad” outcome for each event • Some examples: ◦ RPC is successful ◦ p95(95% of request) latency is below 500ms SLI(Service Level Indicator) The Reliability Stack The basic building blocks of the Reliability Stack. “Implementing Service Level Objectives”, Alex Hidalgo
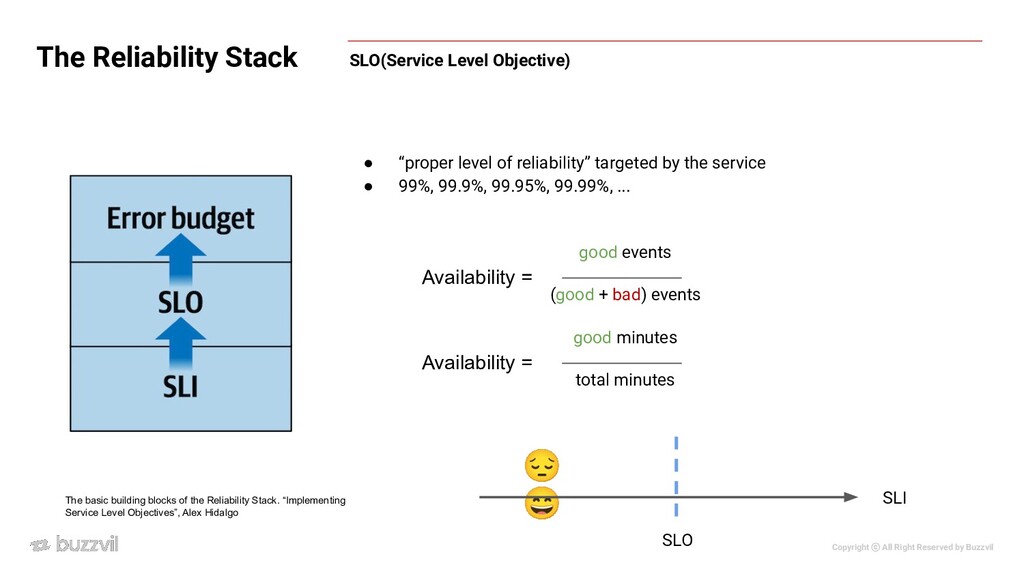
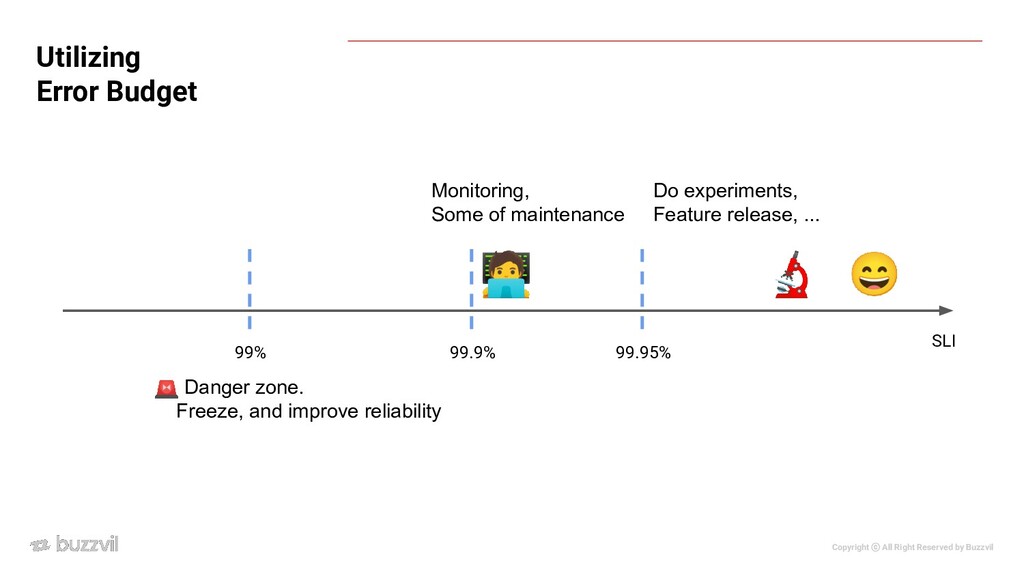
The Reliability Stack The basic building blocks of the Reliability Stack. “Implementing Service Level Objectives”, Alex Hidalgo • “proper level of reliability” targeted by the service • 99%, 99.9%, 99.95%, 99.99%, ... (good + bad) events good events Availability = total minutes good minutes Availability = 😔 😄 SLO SLI
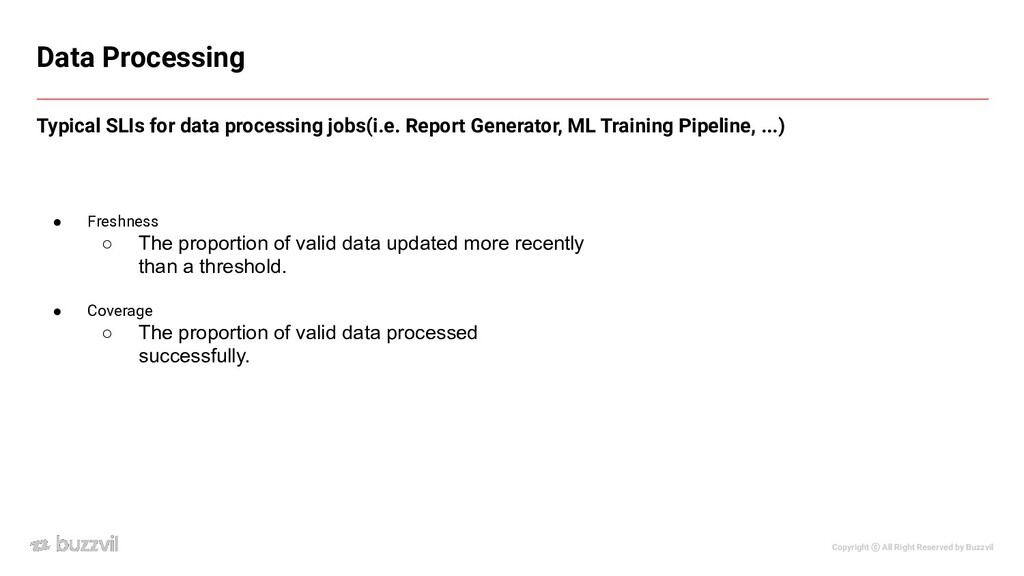
The proportion of valid data updated more recently than a threshold. • Coverage ◦ The proportion of valid data processed successfully. Typical SLIs for data processing jobs(i.e. Report Generator, ML Training Pipeline, ...) Data Processing
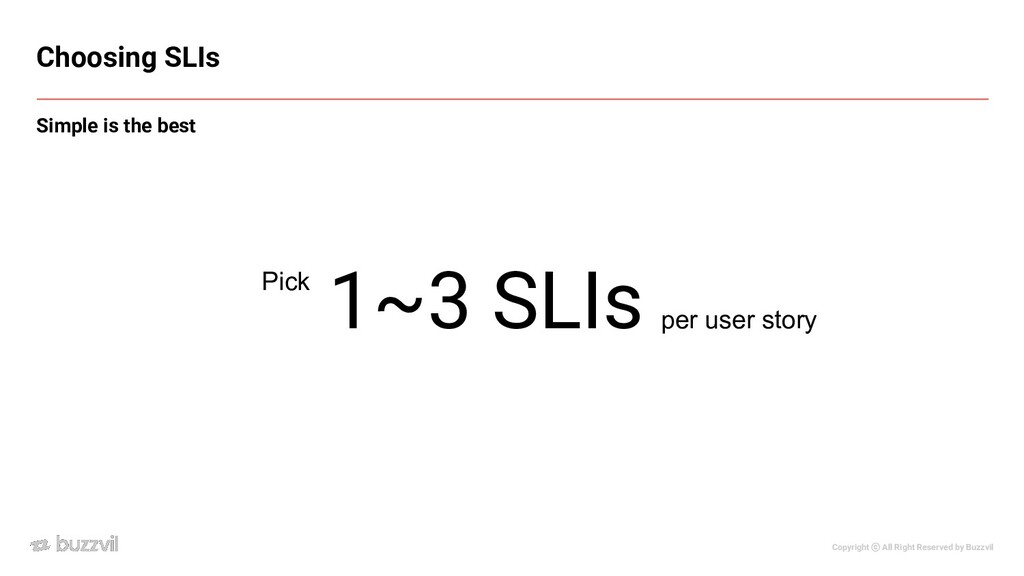
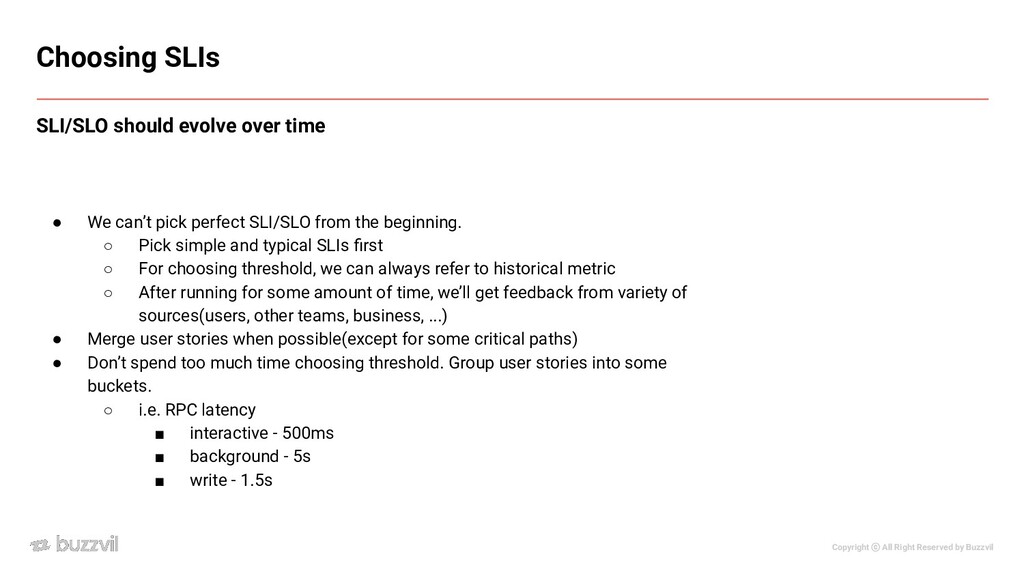
over time Choosing SLIs • We can’t pick perfect SLI/SLO from the beginning. ◦ Pick simple and typical SLIs first ◦ For choosing threshold, we can always refer to historical metric ◦ After running for some amount of time, we’ll get feedback from variety of sources(users, other teams, business, ...) • Merge user stories when possible(except for some critical paths) • Don’t spend too much time choosing threshold. Group user stories into some buckets. ◦ i.e. RPC latency ▪ interactive - 500ms ▪ background - 5s ▪ write - 1.5s
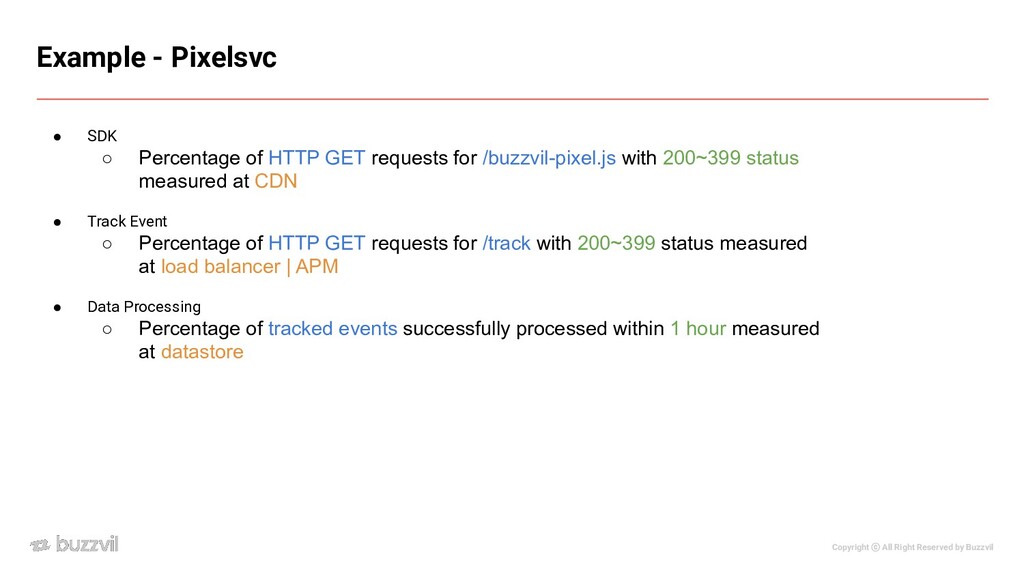
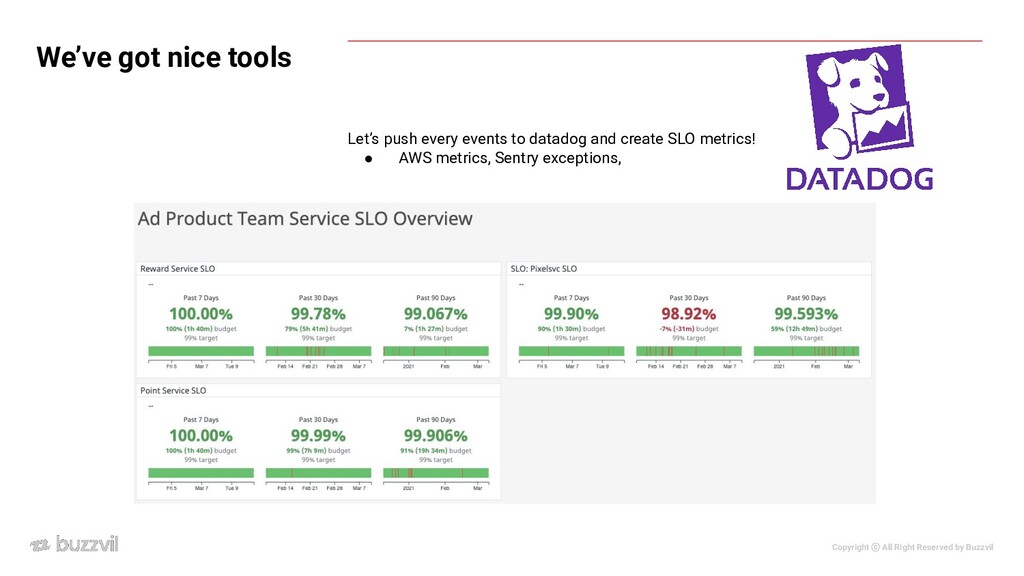
• SDK ◦ Percentage of HTTP GET requests for /buzzvil-pixel.js with 200~399 status measured at CDN • Track Event ◦ Percentage of HTTP GET requests for /track with 200~399 status measured at load balancer | APM • Data Processing ◦ Percentage of tracked events successfully processed within 1 hour measured at datastore
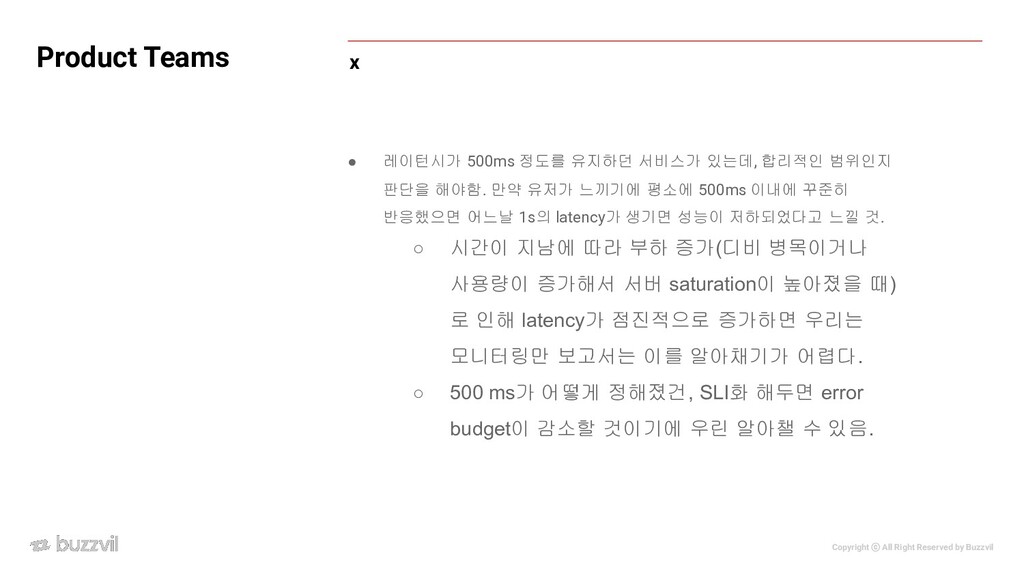
정도를 유지하던 서비스가 있는데, 합리적인 범위인지 판단을 해야함. 만약 유저가 느끼기에 평소에 500ms 이내에 꾸준히 반응했으면 어느날 1s의 latency가 생기면 성능이 저하되었다고 느낄 것. ◦ 시간이 지남에 따라 부하 증가(디비 병목이거나 사용량이 증가해서 서버 saturation이 높아졌을 때) 로 인해 latency가 점진적으로 증가하면 우리는 모니터링만 보고서는 이를 알아채기가 어렵다. ◦ 500 ms가 어떻게 정해졌건, SLI화 해두면 error budget이 감소할 것이기에 우린 알아챌 수 있음. x Product Teams
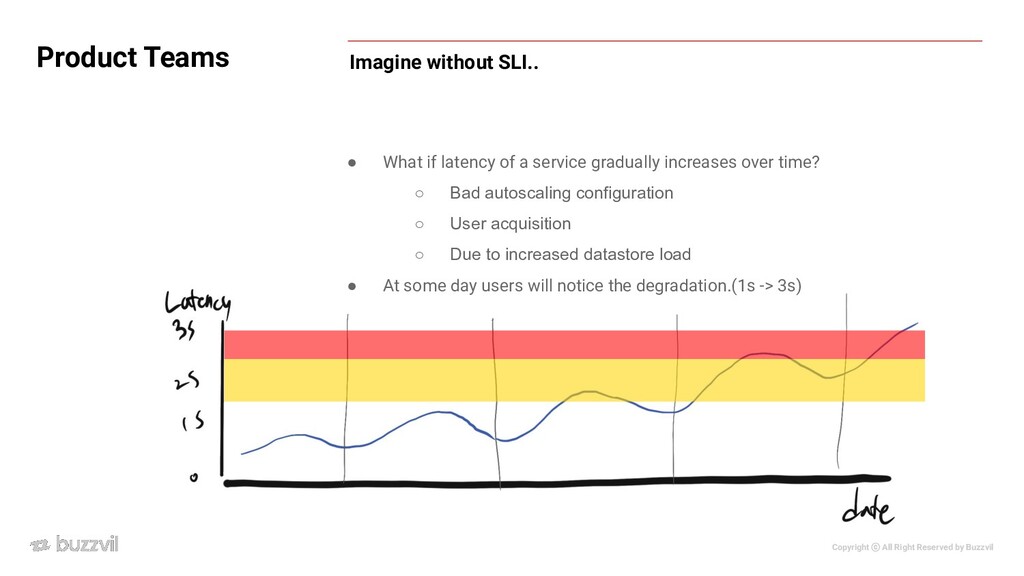
Product Teams • What if latency of a service gradually increases over time? ◦ Bad autoscaling configuration ◦ User acquisition ◦ Due to increased datastore load • At some day users will notice the degradation.(1s -> 3s)
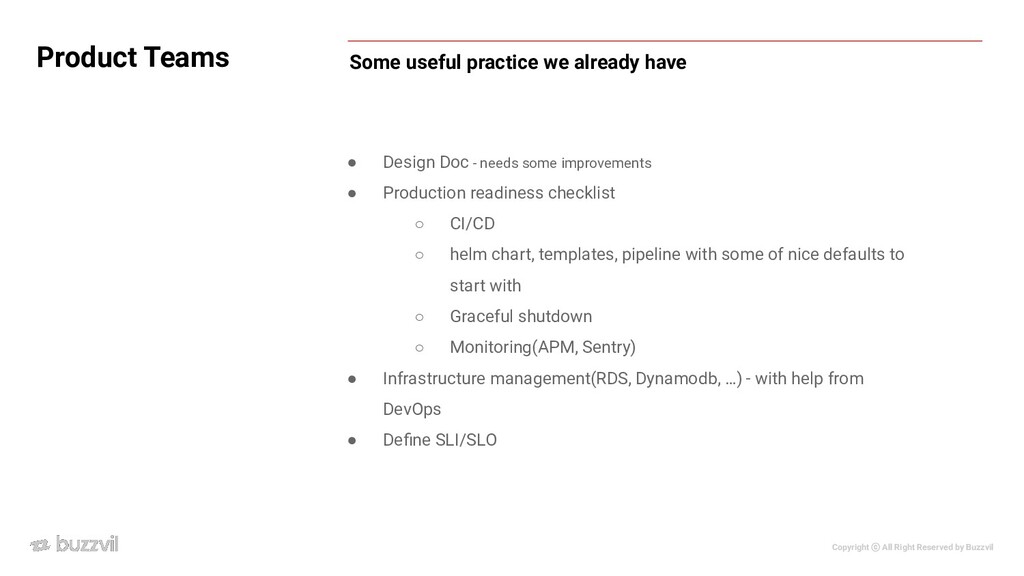
- needs some improvements • Production readiness checklist ◦ CI/CD ◦ helm chart, templates, pipeline with some of nice defaults to start with ◦ Graceful shutdown ◦ Monitoring(APM, Sentry) • Infrastructure management(RDS, Dynamodb, …) - with help from DevOps • Define SLI/SLO Some useful practice we already have Product Teams
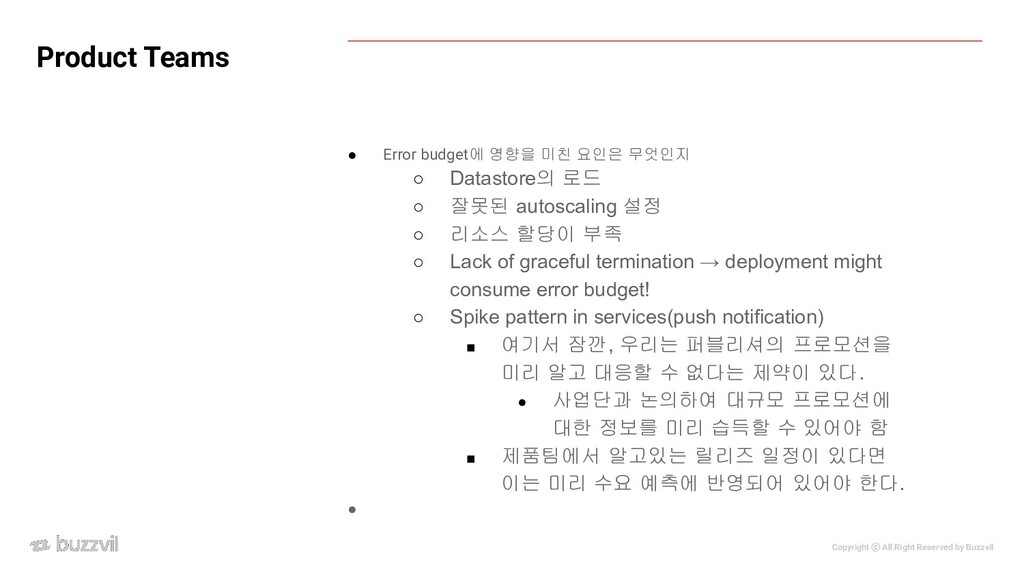
영향을 미친 요인은 무엇인지 ◦ Datastore의 로드 ◦ 잘못된 autoscaling 설정 ◦ 리소스 할당이 부족 ◦ Lack of graceful termination → deployment might consume error budget! ◦ Spike pattern in services(push notification) ▪ 여기서 잠깐, 우리는 퍼블리셔의 프로모션을 미리 알고 대응할 수 없다는 제약이 있다. • 사업단과 논의하여 대규모 프로모션에 대한 정보를 미리 습득할 수 있어야 함 ▪ 제품팀에서 알고있는 릴리즈 일정이 있다면 이는 미리 수요 예측에 반영되어 있어야 한다. • Product Teams
Book • Implementing Service Level Objectives • https://www.slideshare.net/Pivotal/six-simple-steps-to-service-level-obje ctives-slos • Solving reliability fears with service level objectives (Google) Useful Resources