Upgrade to Pro — share decks privately, control downloads, hide ads and more …

Field Sales Cost Per Visit & Cost Per Order Cal...

Field Sales Cost Per Visit & Cost Per Order Calculator for FMCG

A practical worksheet for FMCG distributors to calculate field sales cost per visit, cost per order, conversion efficiency, and beat route profitability. Includes formulas, benchmarks, operational insights, and optimization scenarios to improve field productivity and reduce distribution costs.

Learn more: https://www.byteelephants.com/beat-route-planning-optimizing-costs/
Website: https://www.byteelephants.com/

Other Decks in Business

Transcript

  1. F M C G D I S T R I

    B U T I O N I N T E L L I G E N C E · B E A T R O U T E E F F I C I E N C Y Field Sales Cost Per Visit & Cost Per Order Calculator A step-by-step worksheet for FMCG distributors to calculate the true cost of every outlet visit — and quantify exactly how much better beat route planning can save. 30% AVG. REDUCTION IN COST PER VISIT ₹1L+ ANNUAL SAVINGS PER REP POSSIBLE 5 min TIME TO COMPLETE THIS WORKSHEET www.byteelephants.com
  2. W H Y T H I S M A T

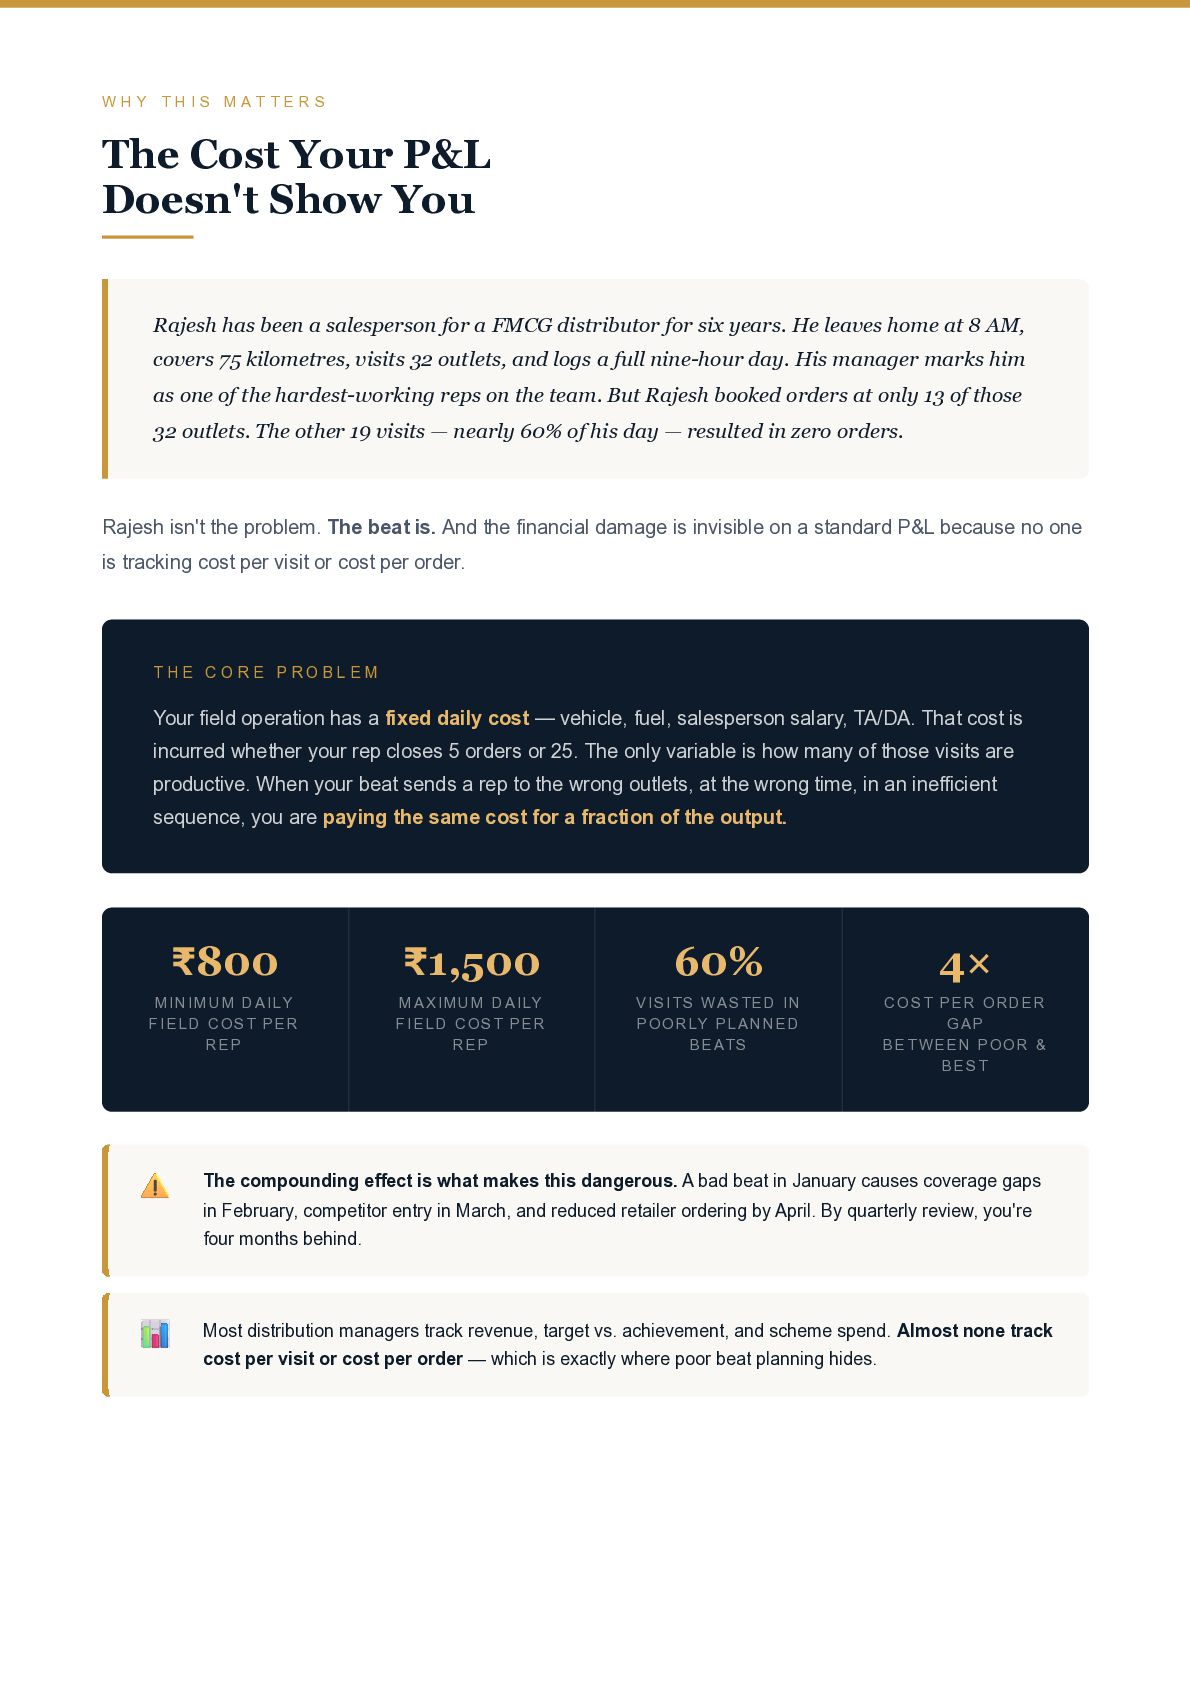
    T E R S The Cost Your P&L Doesn't Show You Rajesh has been a salesperson for a FMCG distributor for six years. He leaves home at 8 AM, covers 75 kilometres, visits 32 outlets, and logs a full nine-hour day. His manager marks him as one of the hardest-working reps on the team. But Rajesh booked orders at only 13 of those 32 outlets. The other 19 visits — nearly 60% of his day — resulted in zero orders. Rajesh isn't the problem. The beat is. And the financial damage is invisible on a standard P&L because no one is tracking cost per visit or cost per order. T H E C O R E P R O B L E M Your field operation has a fixed daily cost — vehicle, fuel, salesperson salary, TA/DA. That cost is incurred whether your rep closes 5 orders or 25. The only variable is how many of those visits are productive. When your beat sends a rep to the wrong outlets, at the wrong time, in an inefficient sequence, you are paying the same cost for a fraction of the output. ₹800 MINIMUM DAILY FIELD COST PER REP ₹1,500 MAXIMUM DAILY FIELD COST PER REP 60% VISITS WASTED IN POORLY PLANNED BEATS 4× COST PER ORDER GAP BETWEEN POOR & BEST ⚠️ The compounding effect is what makes this dangerous. A bad beat in January causes coverage gaps in February, competitor entry in March, and reduced retailer ordering by April. By quarterly review, you're four months behind. 📊 Most distribution managers track revenue, target vs. achievement, and scheme spend. Almost none track cost per visit or cost per order — which is exactly where poor beat planning hides.
  3. U N D E R S T A N D

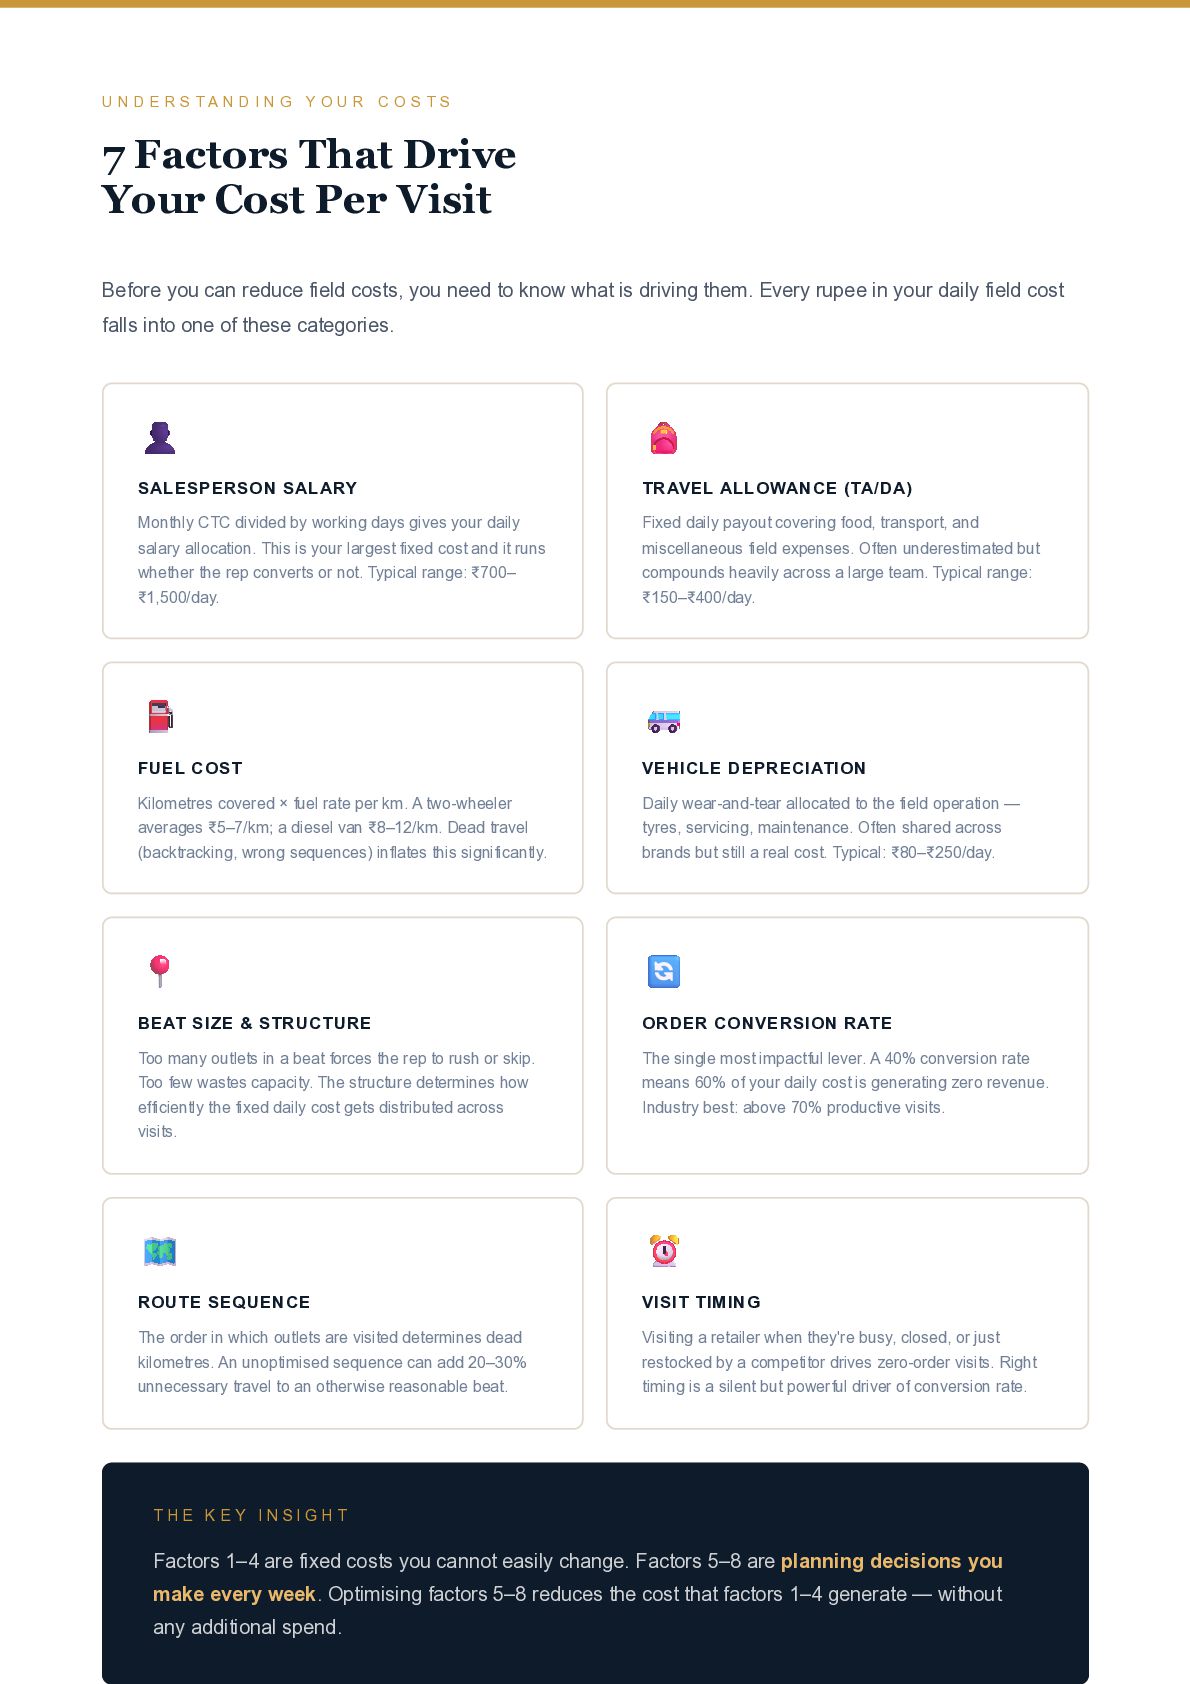
    I N G Y O U R C O S T S 7 Factors That Drive Your Cost Per Visit Before you can reduce field costs, you need to know what is driving them. Every rupee in your daily field cost falls into one of these categories. 👤 SALESPERSON SALARY Monthly CTC divided by working days gives your daily salary allocation. This is your largest fixed cost and it runs whether the rep converts or not. Typical range: ₹700– ₹1,500/day. 🎒 TRAVEL ALLOWANCE (TA/DA) Fixed daily payout covering food, transport, and miscellaneous field expenses. Often underestimated but compounds heavily across a large team. Typical range: ₹150–₹400/day. ⛽ FUEL COST Kilometres covered × fuel rate per km. A two-wheeler averages ₹5–7/km; a diesel van ₹8–12/km. Dead travel (backtracking, wrong sequences) inflates this significantly. 🚐 VEHICLE DEPRECIATION Daily wear-and-tear allocated to the field operation — tyres, servicing, maintenance. Often shared across brands but still a real cost. Typical: ₹80–₹250/day. 📍 BEAT SIZE & STRUCTURE Too many outlets in a beat forces the rep to rush or skip. Too few wastes capacity. The structure determines how efficiently the fixed daily cost gets distributed across visits. 🔄 ORDER CONVERSION RATE The single most impactful lever. A 40% conversion rate means 60% of your daily cost is generating zero revenue. Industry best: above 70% productive visits. 🗺️ ROUTE SEQUENCE The order in which outlets are visited determines dead kilometres. An unoptimised sequence can add 20–30% unnecessary travel to an otherwise reasonable beat. ⏰ VISIT TIMING Visiting a retailer when they're busy, closed, or just restocked by a competitor drives zero-order visits. Right timing is a silent but powerful driver of conversion rate. T H E K E Y I N S I G H T Factors 1–4 are fixed costs you cannot easily change. Factors 5–8 are planning decisions you make every week. Optimising factors 5–8 reduces the cost that factors 1–4 generate — without any additional spend.
  4. T H E C A L C U L A

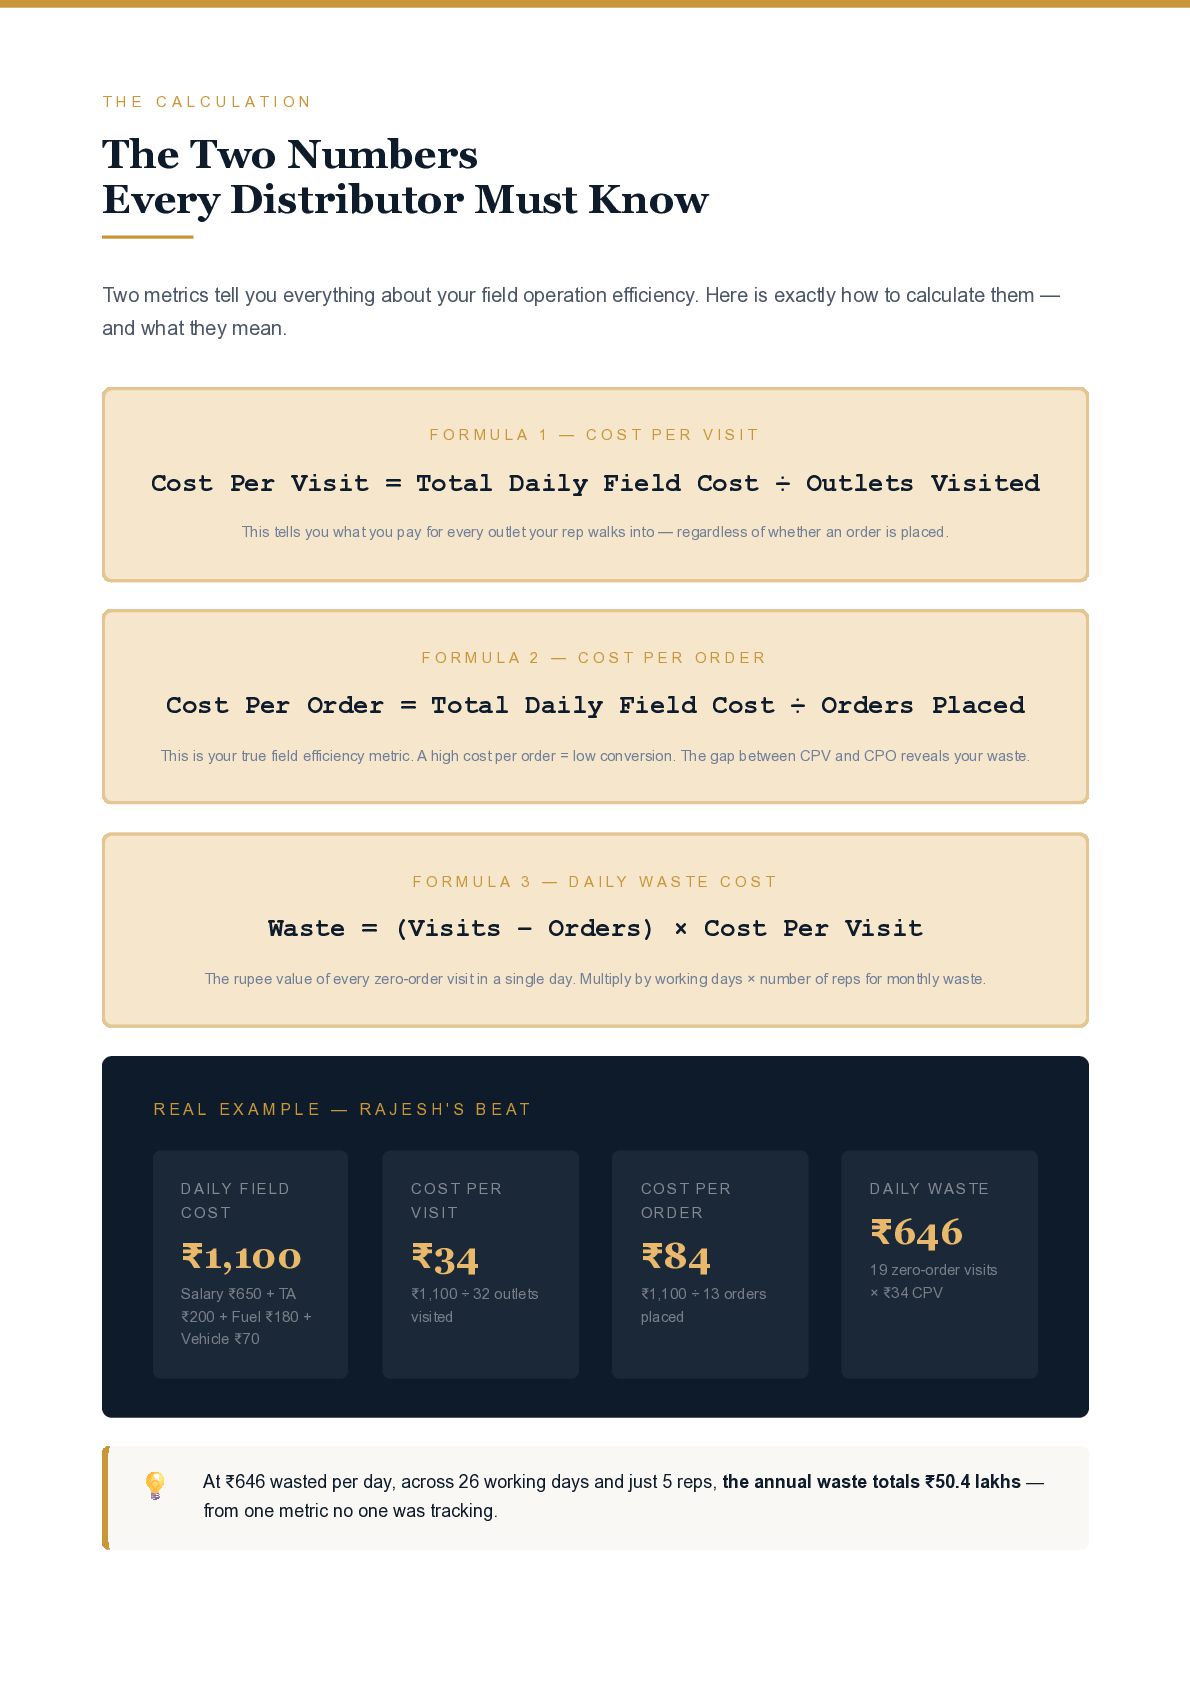
    T I O N The Two Numbers Every Distributor Must Know Two metrics tell you everything about your field operation efficiency. Here is exactly how to calculate them — and what they mean. F O R M U L A 1 — C O S T P E R V I S I T Cost Per Visit = Total Daily Field Cost ÷ Outlets Visited This tells you what you pay for every outlet your rep walks into — regardless of whether an order is placed. F O R M U L A 2 — C O S T P E R O R D E R Cost Per Order = Total Daily Field Cost ÷ Orders Placed This is your true field efficiency metric. A high cost per order = low conversion. The gap between CPV and CPO reveals your waste. F O R M U L A 3 — D A I L Y W A S T E C O S T Waste = (Visits − Orders) × Cost Per Visit The rupee value of every zero-order visit in a single day. Multiply by working days × number of reps for monthly waste. R E A L E X A M P L E — R A J E S H ' S B E A T DAILY FIELD COST ₹1,100 Salary ₹650 + TA ₹200 + Fuel ₹180 + Vehicle ₹70 COST PER VISIT ₹34 ₹1,100 ÷ 32 outlets visited COST PER ORDER ₹84 ₹1,100 ÷ 13 orders placed DAILY WASTE ₹646 19 zero-order visits × ₹34 CPV 💡 At ₹646 wasted per day, across 26 working days and just 5 reps, the annual waste totals ₹50.4 lakhs — from one metric no one was tracking.
  5. F I L L - I N W O R

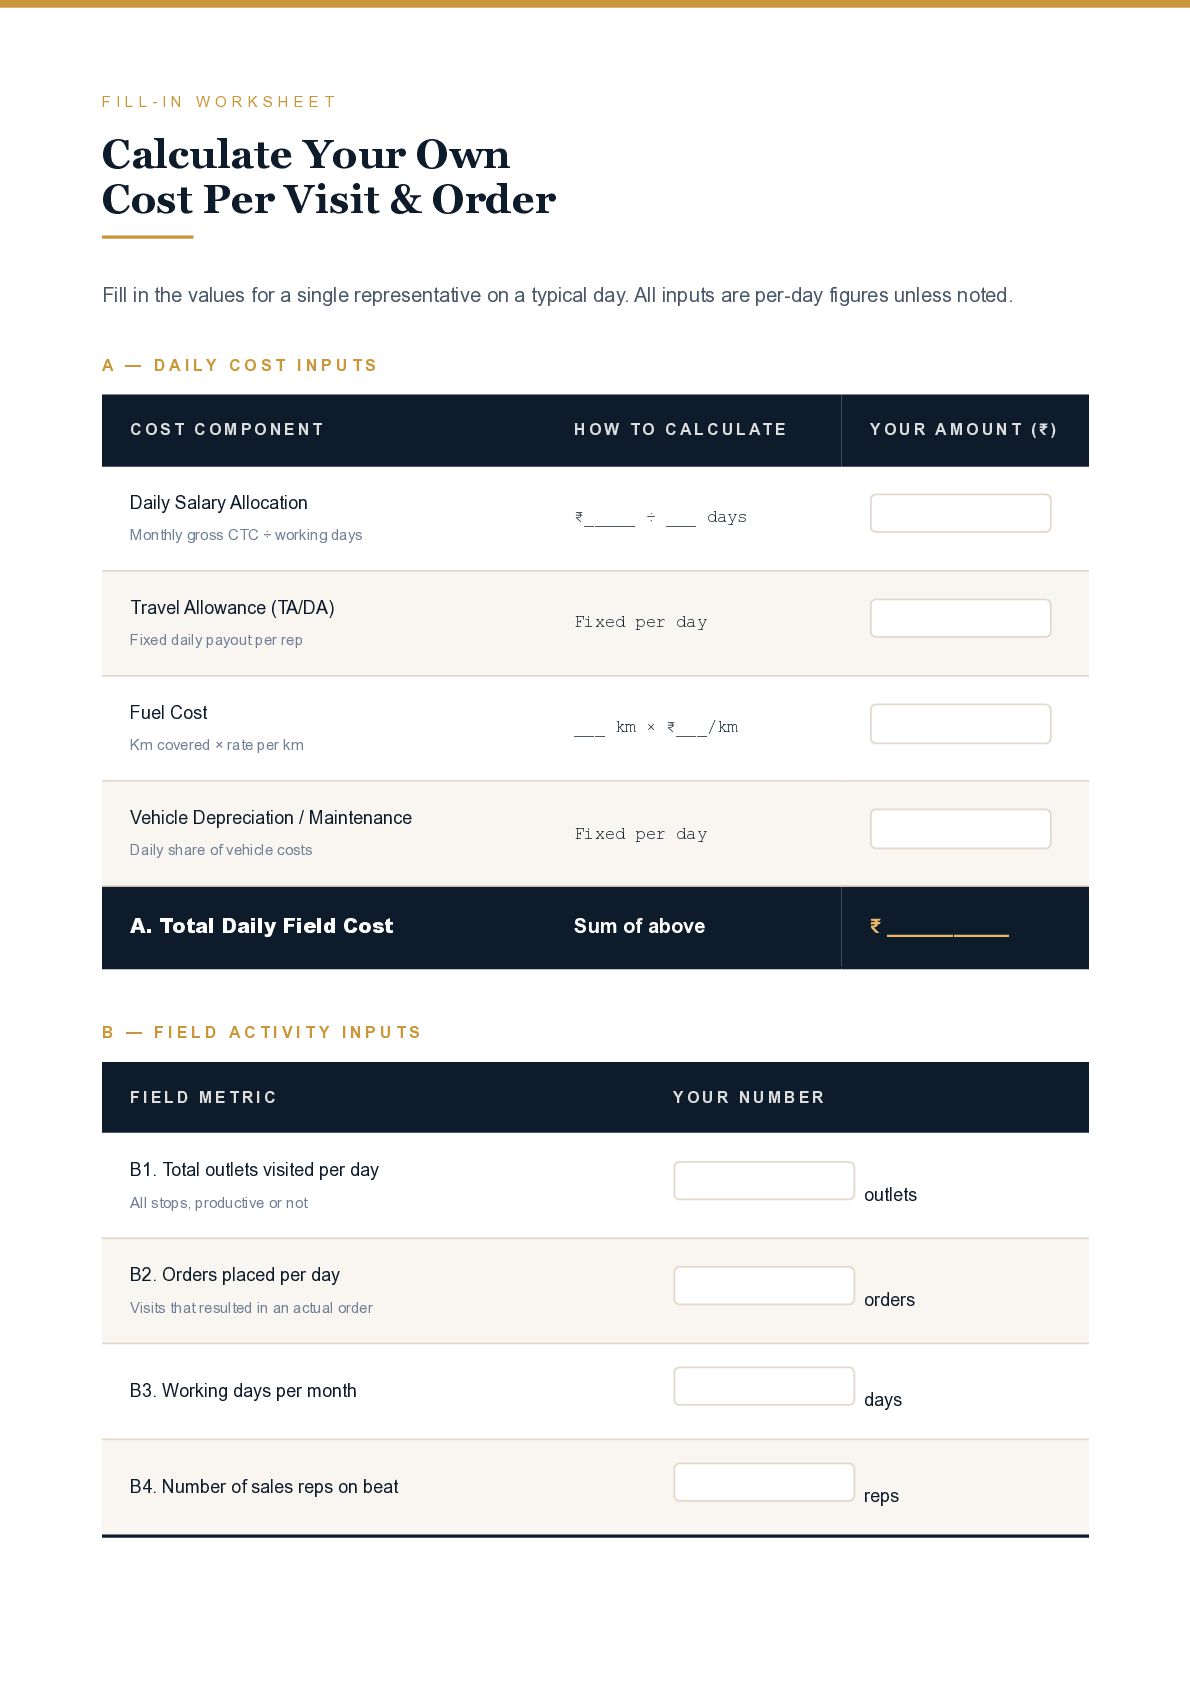
    K S H E E T Calculate Your Own Cost Per Visit & Order Fill in the values for a single representative on a typical day. All inputs are per-day figures unless noted. A — D A I L Y C O S T I N P U T S C O S T C O M P O N E N T H O W T O C A L C U L AT E Y O U R A M O U N T ( ₹ ) Daily Salary Allocation Monthly gross CTC ÷ working days ₹_____ ÷ ___ days Travel Allowance (TA/DA) Fixed daily payout per rep Fixed per day Fuel Cost Km covered × rate per km ___ km × ₹___/km Vehicle Depreciation / Maintenance Daily share of vehicle costs Fixed per day A. Total Daily Field Cost Sum of above ₹ ___________ B — F I E L D A C T I V I T Y I N P U T S F I E L D M E T R I C Y O U R N U M B E R B1. Total outlets visited per day All stops, productive or not outlets B2. Orders placed per day Visits that resulted in an actual order orders B3. Working days per month days B4. Number of sales reps on beat reps
  6. W O R K S H E E T R

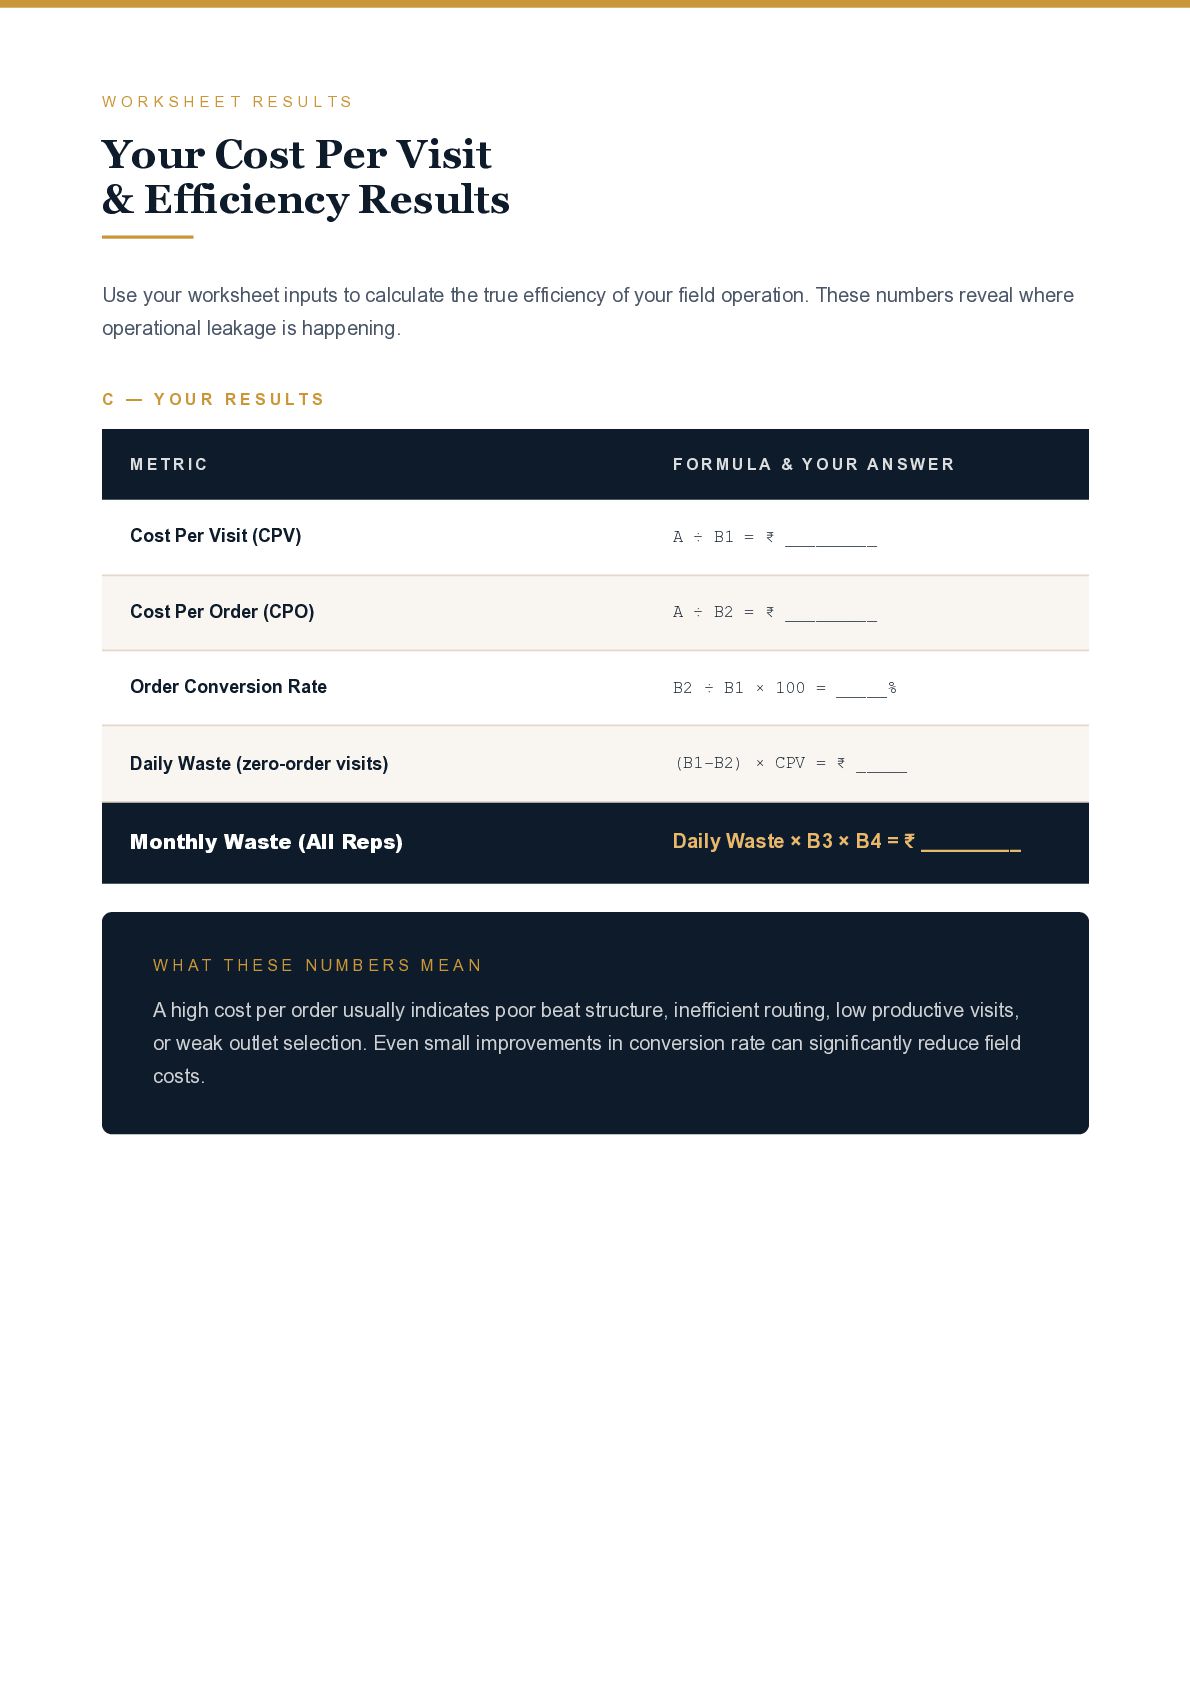
    E S U L T S Your Cost Per Visit & Efficiency Results Use your worksheet inputs to calculate the true efficiency of your field operation. These numbers reveal where operational leakage is happening. C — Y O U R R E S U L T S M E T R I C F O R M U L A & Y O U R A N S W E R Cost Per Visit (CPV) A ÷ B1 = ₹ _________ Cost Per Order (CPO) A ÷ B2 = ₹ _________ Order Conversion Rate B2 ÷ B1 × 100 = _____% Daily Waste (zero-order visits) (B1−B2) × CPV = ₹ _____ Monthly Waste (All Reps) Daily Waste × B3 × B4 = ₹ _________ W H A T T H E S E N U M B E R S M E A N A high cost per order usually indicates poor beat structure, inefficient routing, low productive visits, or weak outlet selection. Even small improvements in conversion rate can significantly reduce field costs.
  7. H O W T O R E A D Y

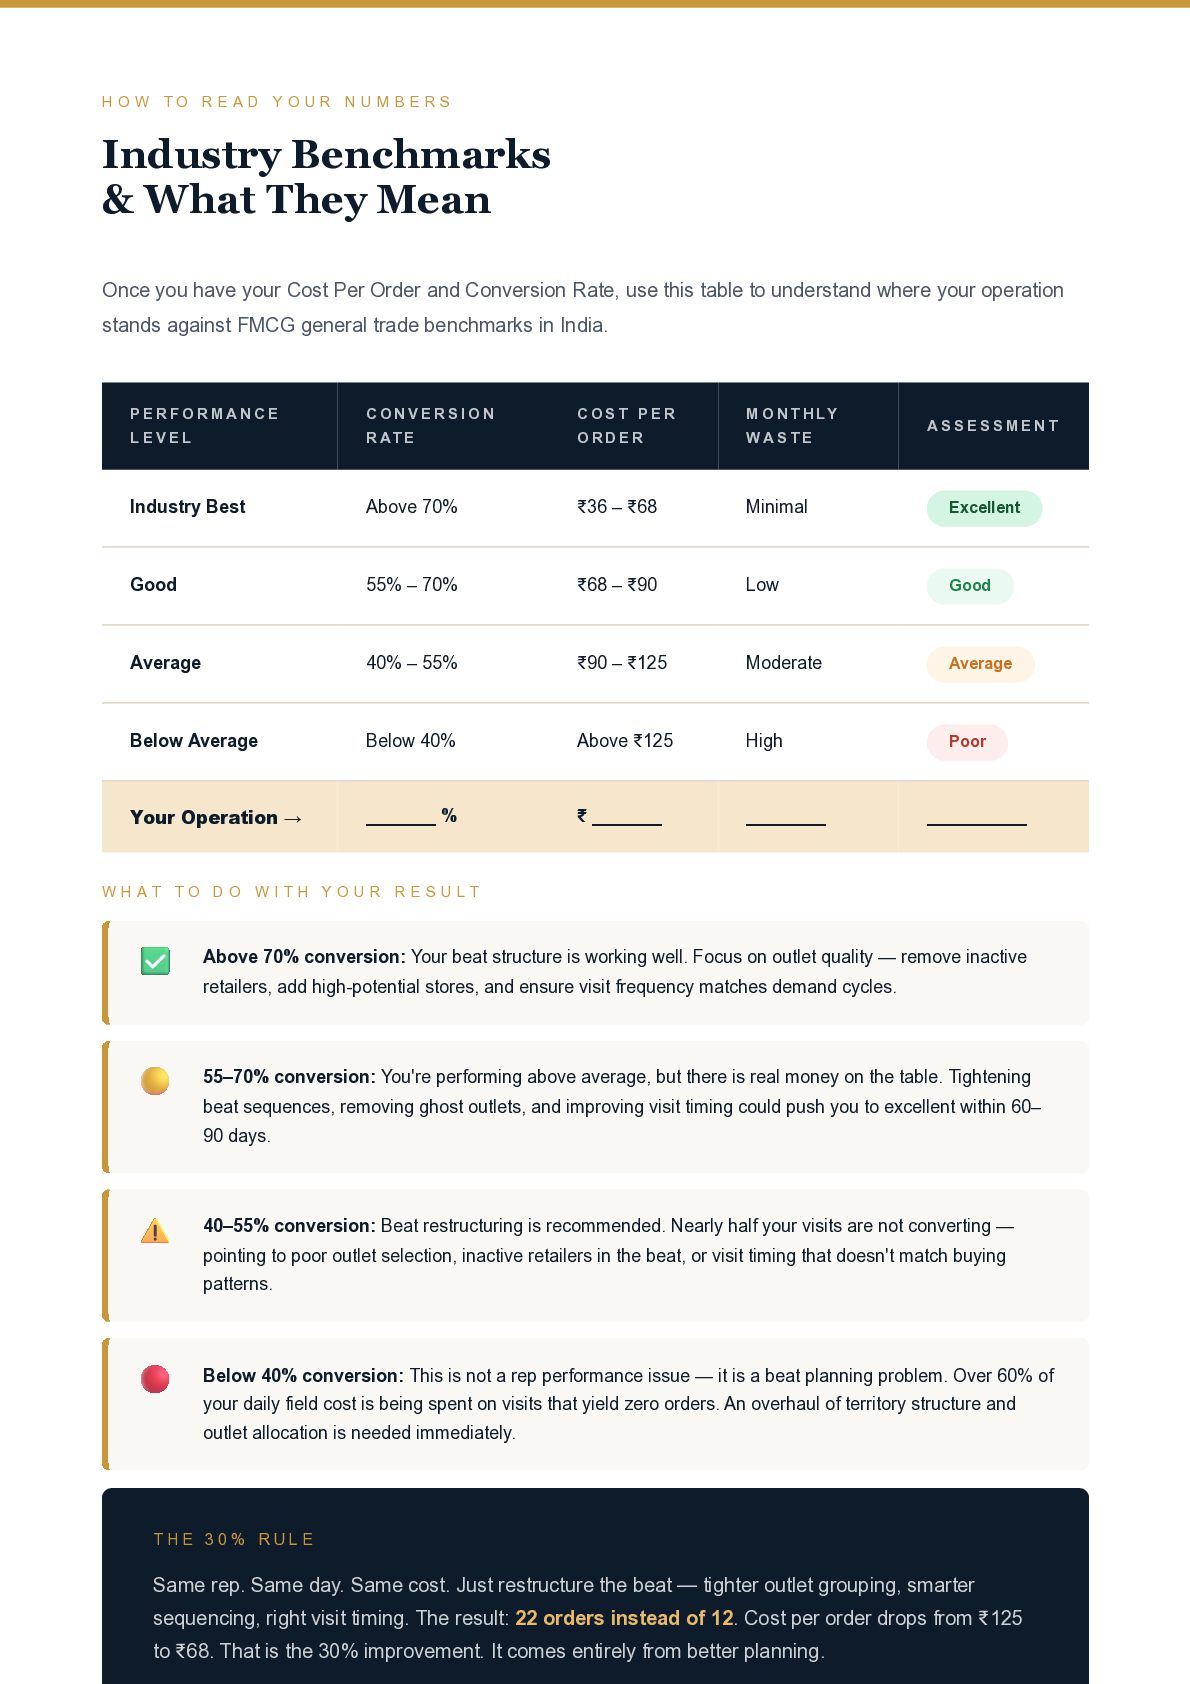
    O U R N U M B E R S Industry Benchmarks & What They Mean Once you have your Cost Per Order and Conversion Rate, use this table to understand where your operation stands against FMCG general trade benchmarks in India. P E R F O R M A N C E L E V E L C O N V E R S I O N R AT E C O S T P E R O R D E R M O N T H LY WA S T E A S S E S S M E N T Industry Best Above 70% ₹36 – ₹68 Minimal Excellent Good 55% – 70% ₹68 – ₹90 Low Good Average 40% – 55% ₹90 – ₹125 Moderate Average Below Average Below 40% Above ₹125 High Poor Your Operation → _______ % ₹ _______ ________ __________ W H A T T O D O W I T H Y O U R R E S U L T ✅ Above 70% conversion: Your beat structure is working well. Focus on outlet quality — remove inactive retailers, add high-potential stores, and ensure visit frequency matches demand cycles. 🟡 55–70% conversion: You're performing above average, but there is real money on the table. Tightening beat sequences, removing ghost outlets, and improving visit timing could push you to excellent within 60– 90 days. ⚠️ 40–55% conversion: Beat restructuring is recommended. Nearly half your visits are not converting — pointing to poor outlet selection, inactive retailers in the beat, or visit timing that doesn't match buying patterns. 🔴 Below 40% conversion: This is not a rep performance issue — it is a beat planning problem. Over 60% of your daily field cost is being spent on visits that yield zero orders. An overhaul of territory structure and outlet allocation is needed immediately. T H E 3 0 % R U L E Same rep. Same day. Same cost. Just restructure the beat — tighter outlet grouping, smarter sequencing, right visit timing. The result: 22 orders instead of 12. Cost per order drops from ₹125 to ₹68. That is the 30% improvement. It comes entirely from better planning.
  8. T H E O P T I M I S

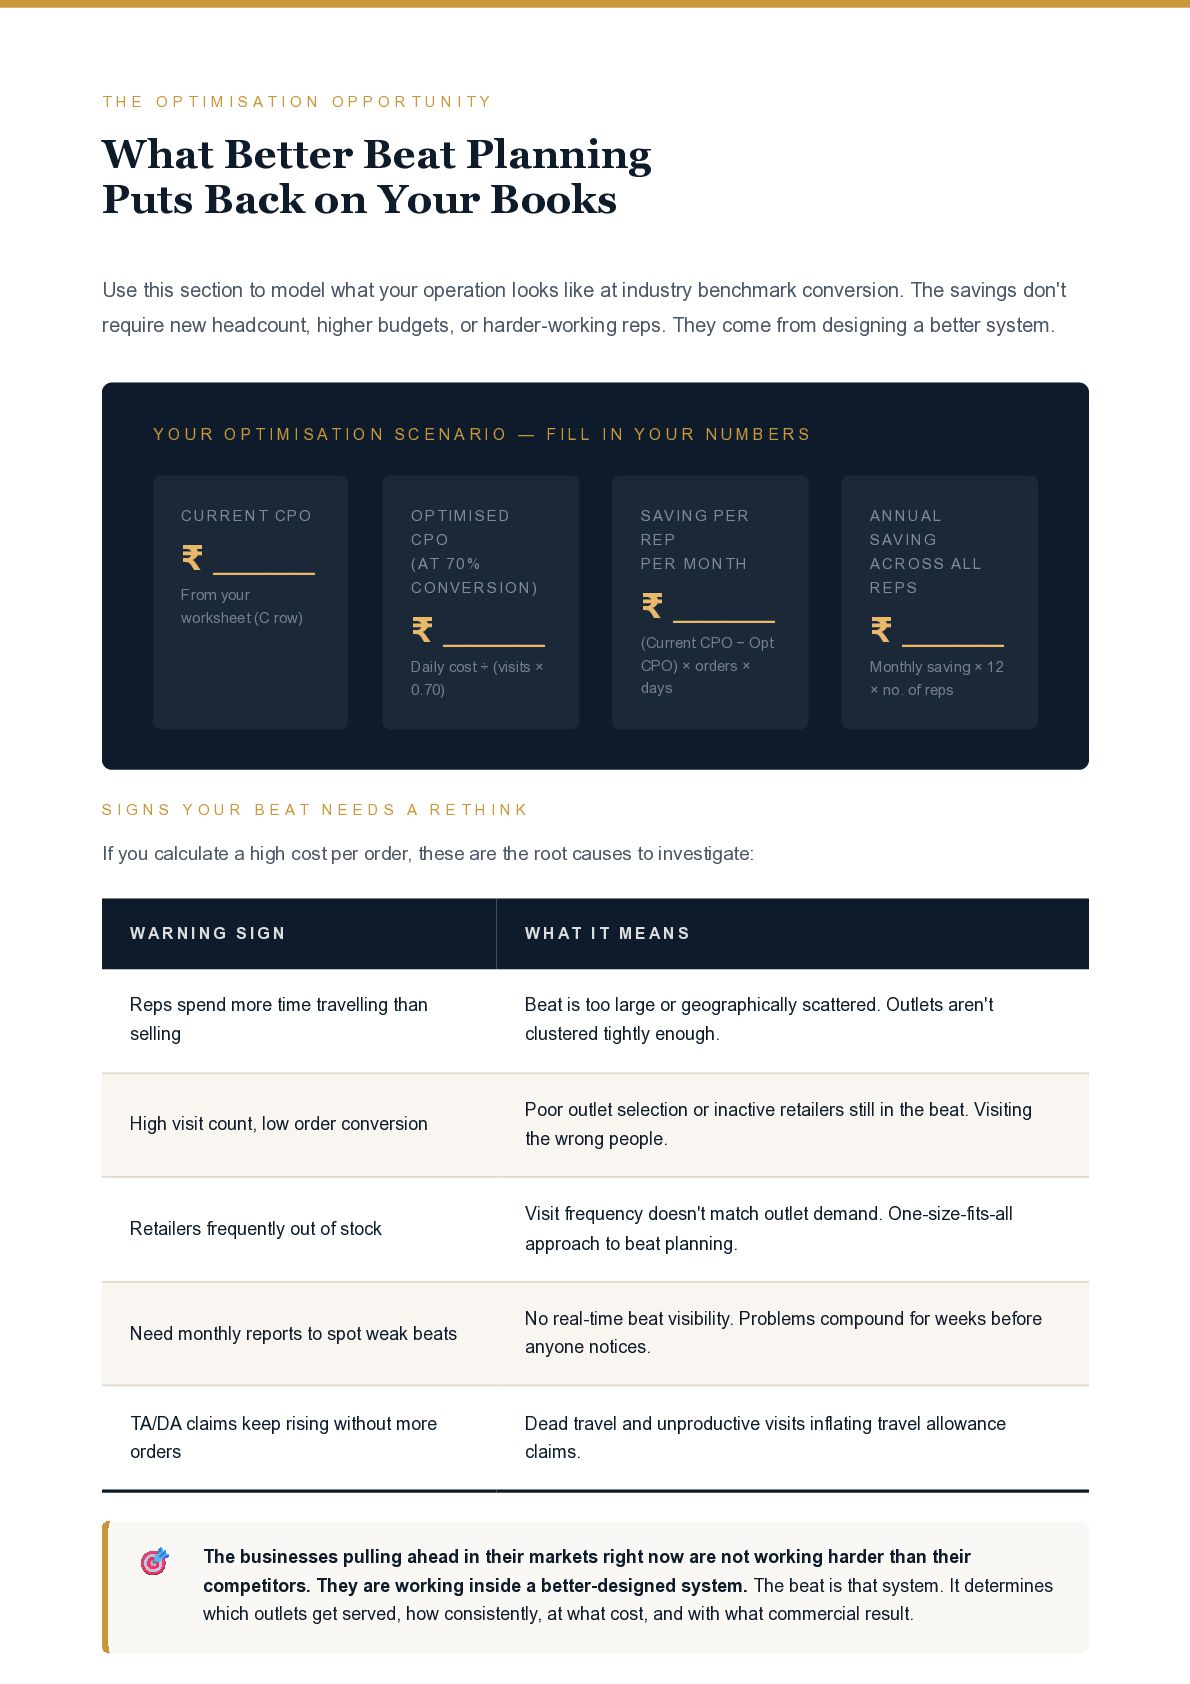
    A T I O N O P P O R T U N I T Y What Better Beat Planning Puts Back on Your Books Use this section to model what your operation looks like at industry benchmark conversion. The savings don't require new headcount, higher budgets, or harder-working reps. They come from designing a better system. Y O U R O P T I M I S A T I O N S C E N A R I O — F I L L I N Y O U R N U M B E R S CURRENT CPO ₹ ____ From your worksheet (C row) OPTIMISED CPO (AT 70% CONVERSION) ₹ ____ Daily cost ÷ (visits × 0.70) SAVING PER REP PER MONTH ₹ ____ (Current CPO − Opt CPO) × orders × days ANNUAL SAVING ACROSS ALL REPS ₹ ____ Monthly saving × 12 × no. of reps S I G N S Y O U R B E A T N E E D S A R E T H I N K If you calculate a high cost per order, these are the root causes to investigate: WA R N I N G S I G N W H AT I T M E A N S Reps spend more time travelling than selling Beat is too large or geographically scattered. Outlets aren't clustered tightly enough. High visit count, low order conversion Poor outlet selection or inactive retailers still in the beat. Visiting the wrong people. Retailers frequently out of stock Visit frequency doesn't match outlet demand. One-size-fits-all approach to beat planning. Need monthly reports to spot weak beats No real-time beat visibility. Problems compound for weeks before anyone notices. TA/DA claims keep rising without more orders Dead travel and unproductive visits inflating travel allowance claims. 🎯 The businesses pulling ahead in their markets right now are not working harder than their competitors. They are working inside a better-designed system. The beat is that system. It determines which outlets get served, how consistently, at what cost, and with what commercial result.
  9. F M C G D I S T R I

    B U T I O N I N T E L L I G E N C E You Now Know What Every Visit Costs. What's Next? The numbers you've filled in this worksheet reveal exactly where your field operation is leaking margin. The fix isn't working your reps harder — it's giving them a better system to work inside. ✓ Restructure beats so outlets are tightly clustered and sequenced intelligently ✓ Match visit frequency to actual outlet demand — high-movers get more visits ✓ Remove inactive outlets and replace with high-potential retailers ✓ Get real-time beat visibility — not end-of-month reports ✓ Track cost per order weekly, not quarterly