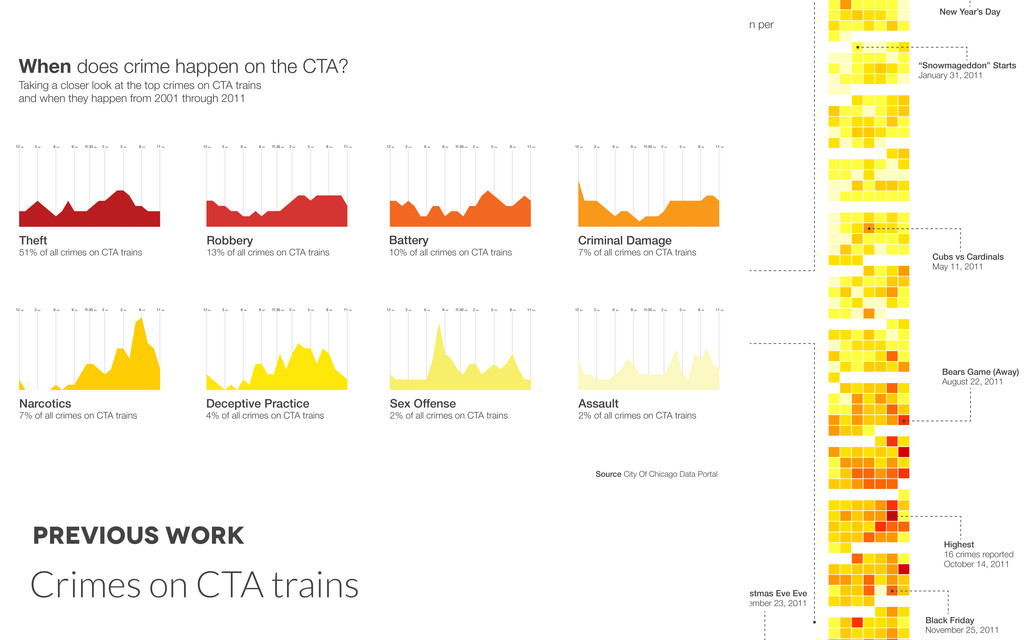
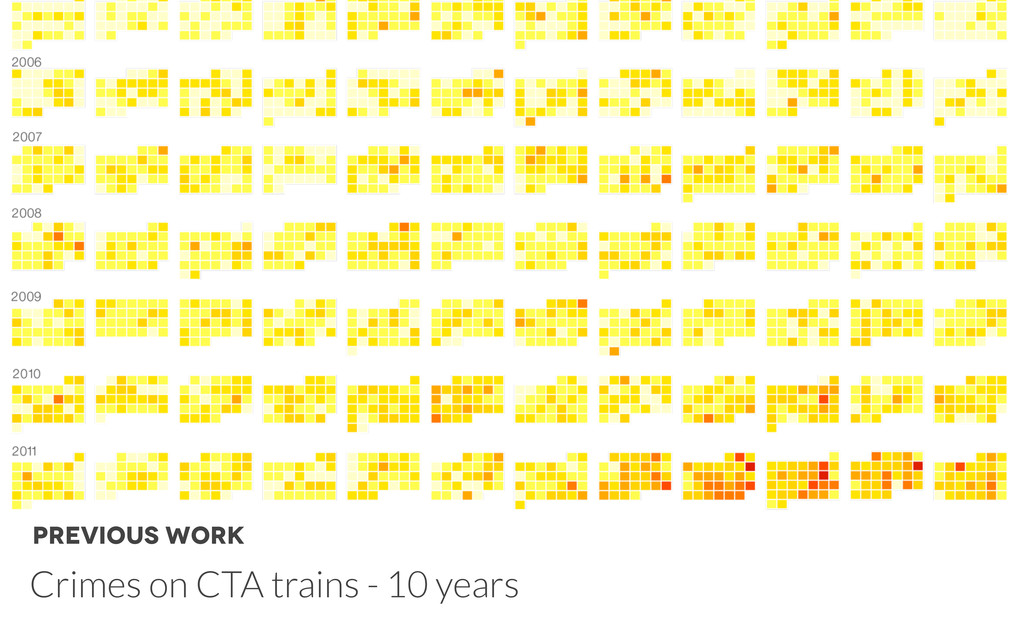
2 PM 5 PM 8 PM 11 PM 12 AM 3 AM 6 AM 9 AM 11:30 AM 2 PM 5 PM 8 PM 11 PM 12 AM 3 AM 6 AM 9 AM 11:30 AM 2 PM 5 PM 8 PM 11 PM 12 AM 3 AM 6 AM 9 AM 11:30 AM 2 PM 5 PM 8 PM 11 PM 12 AM 3 AM 6 AM 9 AM 11:30 AM 2 PM 5 PM 8 PM 11 PM 12 AM 3 AM 6 AM 9 AM 11:30 AM 2 PM 5 PM 8 PM 11 PM 12 AM 3 AM 6 AM 9 AM 11:30 AM 2 PM 5 PM 8 PM 11 PM 12 AM 3 AM 6 AM 9 AM 11:30 AM 2 PM 5 PM 8 PM 11 PM When does crime happen on the CTA? Assault 2% of all crimes on CTA trains 10% of all crimes on CTA trains Battery 7% of all crimes on CTA trains Criminal Damage 4% of all crimes on CTA trains Deceptive Practice 7% of all crimes on CTA trains Narcotics 13% of all crimes on CTA trains Robbery 2% of all crimes on CTA trains Sex Offense 51% of all crimes on CTA trains Theft Taking a closer look at the top crimes on CTA trains and when they happen from 2001 through 2011 Source City Of Chicago Data Portal New Year’s Day Cubs vs Cardinals May 11, 2011 “Snowmageddon” Starts January 31, 2011 Highest 16 crimes reported October 14, 2011 Bears Game (Away) August 22, 2011 Black Friday November 25, 2011 happen on the ‘L’? Looking at how many crimes happen per day on CTA trains throughout 2011 Number of crimes per day January through June Average of four crimes per day on CTA trains July through December Average of seven crimes per day on CTA trains Breakdown of how often crimes are happening throughout the week 0 100 200 300 400 Su M T W R F S Christmas Eve Eve December 23, 2011 15+ 0 8 Crimes on CTA trains Previous Work
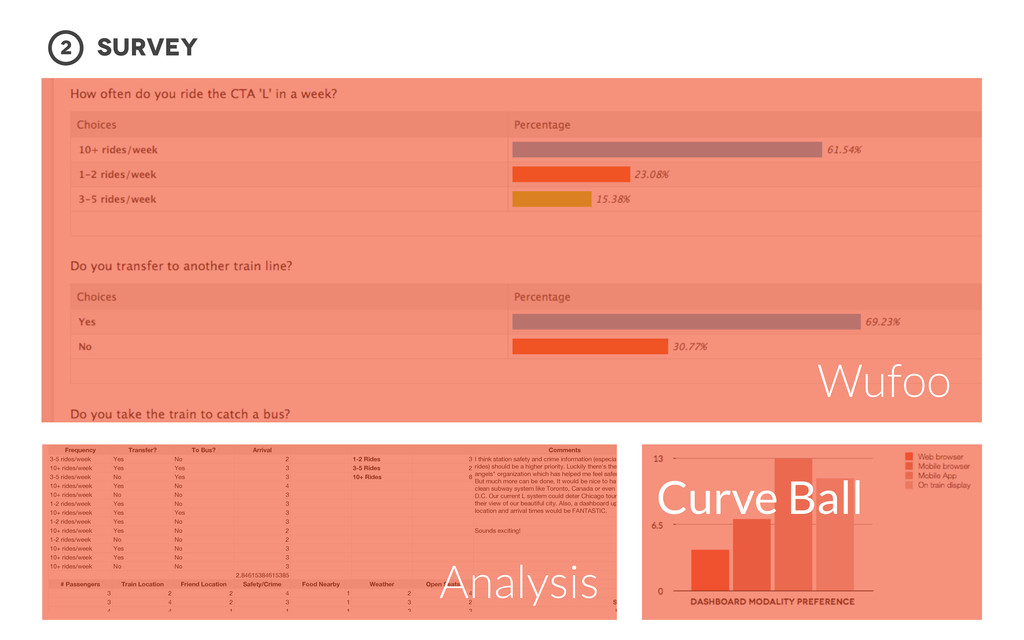
2 1-2 Rides 3 I think station safety and crime information (especially late night L rides) should be a higher priority. Luckily there's the "guardian angels" organization which has helped me feel safer in the past. But much more can be done. It would be nice to have a safe and clean subway system like Toronto, Canada or even Washington D.C. Our current L system could deter Chicago tourists, scarring their view of our beautiful city. Also, a dashboard update of train location and arrival times would be FANTASTIC. 10+ rides/week Yes Yes 3 3-5 Rides 2 I think station safety and crime information (especially late night L rides) should be a higher priority. Luckily there's the "guardian angels" organization which has helped me feel safer in the past. But much more can be done. It would be nice to have a safe and clean subway system like Toronto, Canada or even Washington D.C. Our current L system could deter Chicago tourists, scarring their view of our beautiful city. Also, a dashboard update of train location and arrival times would be FANTASTIC. 3-5 rides/week No Yes 3 10+ Rides 8 I think station safety and crime information (especially late night L rides) should be a higher priority. Luckily there's the "guardian angels" organization which has helped me feel safer in the past. But much more can be done. It would be nice to have a safe and clean subway system like Toronto, Canada or even Washington D.C. Our current L system could deter Chicago tourists, scarring their view of our beautiful city. Also, a dashboard update of train location and arrival times would be FANTASTIC. 10+ rides/week Yes No 4 I think station safety and crime information (especially late night L rides) should be a higher priority. Luckily there's the "guardian angels" organization which has helped me feel safer in the past. But much more can be done. It would be nice to have a safe and clean subway system like Toronto, Canada or even Washington D.C. Our current L system could deter Chicago tourists, scarring their view of our beautiful city. Also, a dashboard update of train location and arrival times would be FANTASTIC. 10+ rides/week No No 3 I think station safety and crime information (especially late night L rides) should be a higher priority. Luckily there's the "guardian angels" organization which has helped me feel safer in the past. But much more can be done. It would be nice to have a safe and clean subway system like Toronto, Canada or even Washington D.C. Our current L system could deter Chicago tourists, scarring their view of our beautiful city. Also, a dashboard update of train location and arrival times would be FANTASTIC. 1-2 rides/week Yes No 3 I think station safety and crime information (especially late night L rides) should be a higher priority. Luckily there's the "guardian angels" organization which has helped me feel safer in the past. But much more can be done. It would be nice to have a safe and clean subway system like Toronto, Canada or even Washington D.C. Our current L system could deter Chicago tourists, scarring their view of our beautiful city. Also, a dashboard update of train location and arrival times would be FANTASTIC. 10+ rides/week Yes Yes 3 I think station safety and crime information (especially late night L rides) should be a higher priority. Luckily there's the "guardian angels" organization which has helped me feel safer in the past. But much more can be done. It would be nice to have a safe and clean subway system like Toronto, Canada or even Washington D.C. Our current L system could deter Chicago tourists, scarring their view of our beautiful city. Also, a dashboard update of train location and arrival times would be FANTASTIC. 1-2 rides/week Yes No 3 10+ rides/week Yes No 2 Sounds exciting! 1-2 rides/week No No 2 10+ rides/week Yes No 3 10+ rides/week Yes No 3 10+ rides/week No No 3 2.84615384615385 # Passengers Train Location Friend Location Safety/Crime Food Nearby Weather Open Seats 3 2 2 4 1 2 4 Not at all = 1 3 4 2 3 1 3 2 Somewhat = 2 4 4 1 1 1 3 3 Important = 3 2 4 2 4 2 4 4 Very Important = 4 2 3 1 3 3 1 2 Survey 2 Wufoo Analysis Curve Ball
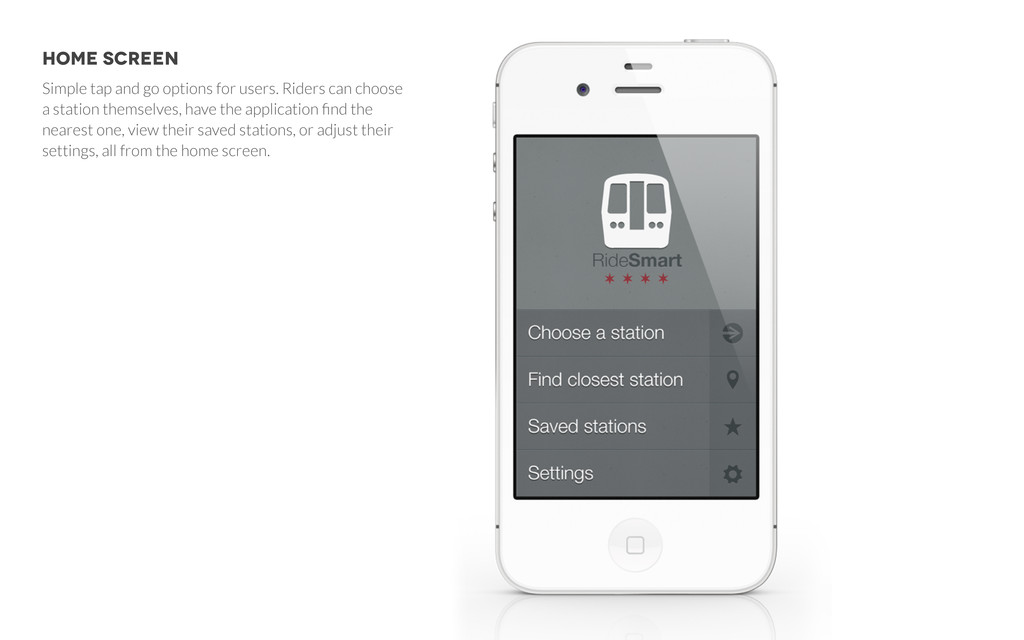
can choose a station themselves, have the application find the nearest one, view their saved stations, or adjust their settings, all from the home screen.
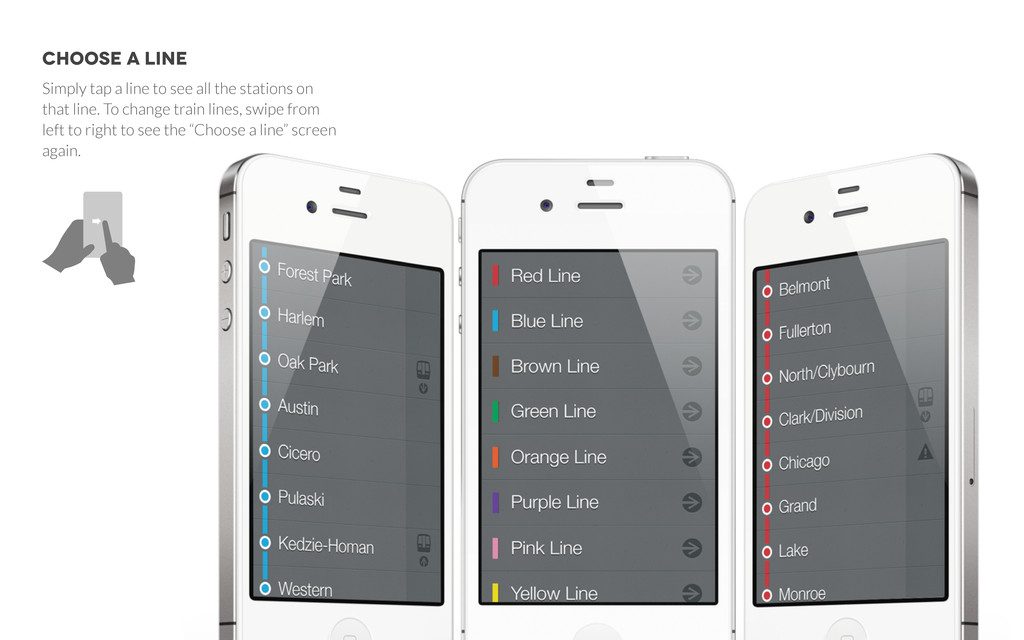
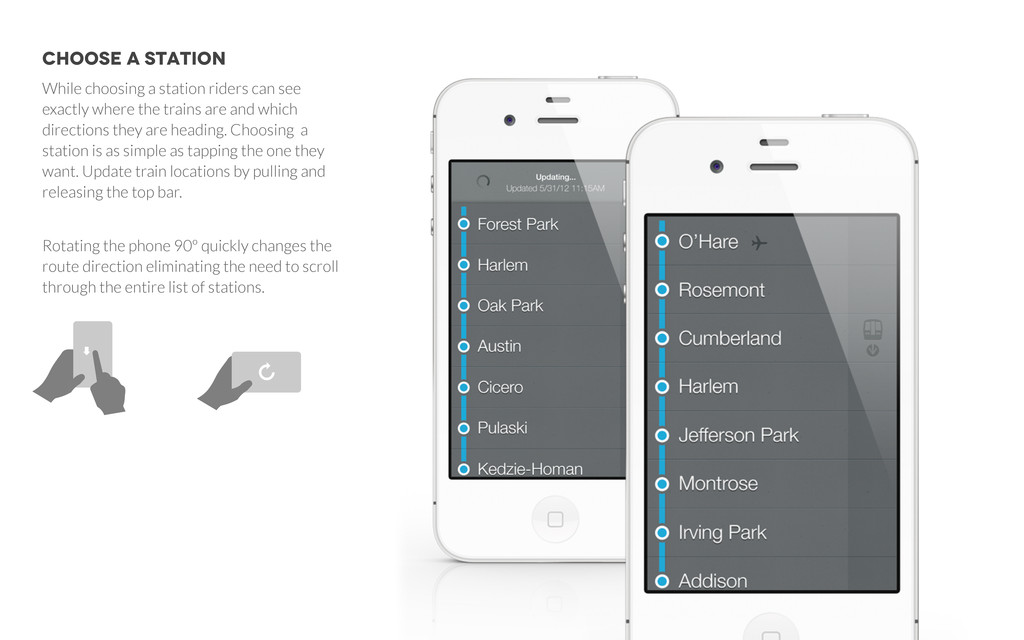
exactly where the trains are and which directions they are heading. Choosing a station is as simple as tapping the one they want. Update train locations by pulling and releasing the top bar. Rotating the phone 90º quickly changes the route direction eliminating the need to scroll through the entire list of stations.
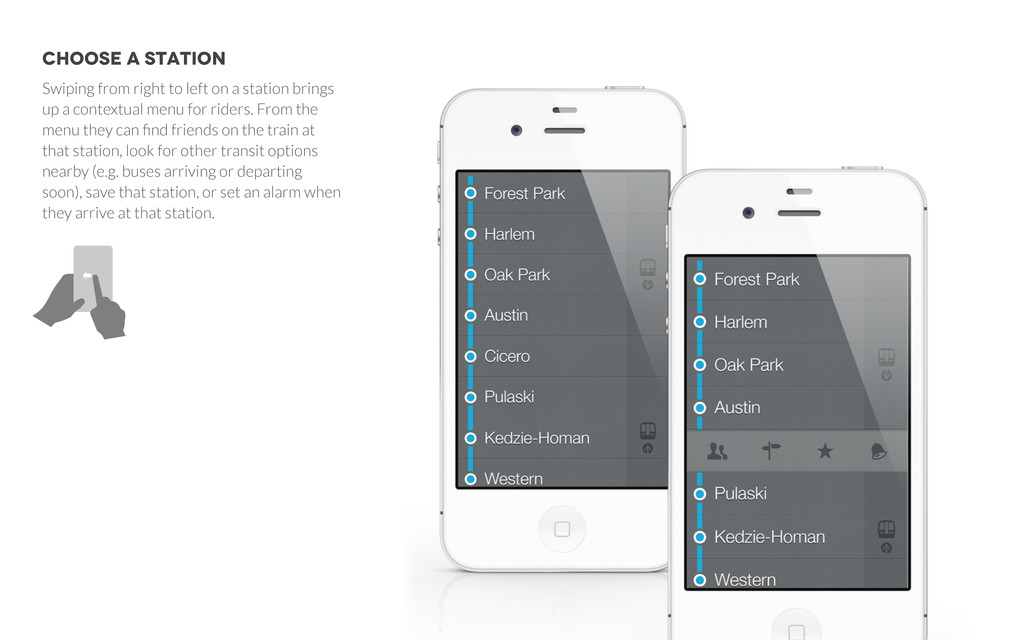
station brings up a contextual menu for riders. From the menu they can find friends on the train at that station, look for other transit options nearby (e.g. buses arriving or departing soon), save that station, or set an alarm when they arrive at that station.
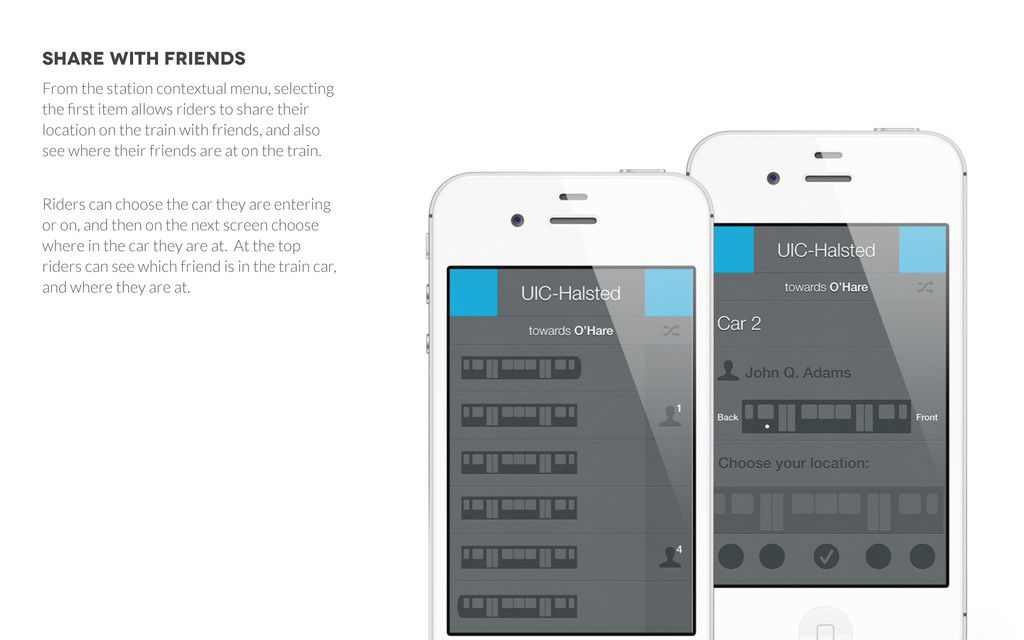
first item allows riders to share their location on the train with friends, and also see where their friends are at on the train. Riders can choose the car they are entering or on, and then on the next screen choose where in the car they are at. At the top riders can see which friend is in the train car, and where they are at.
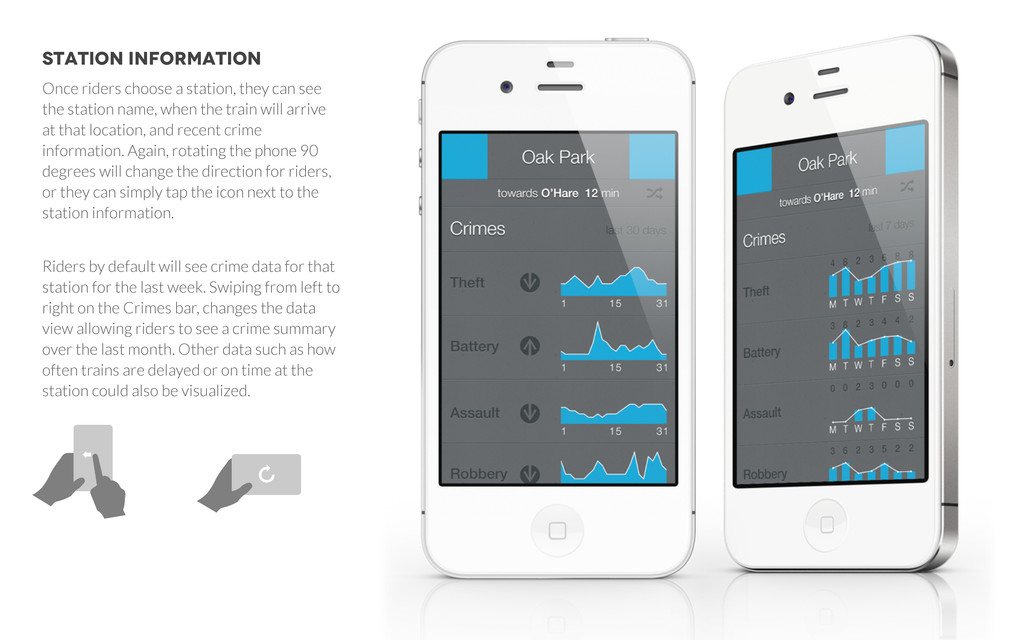
the station name, when the train will arrive at that location, and recent crime information. Again, rotating the phone 90 degrees will change the direction for riders, or they can simply tap the icon next to the station information. Riders by default will see crime data for that station for the last week. Swiping from left to right on the Crimes bar, changes the data view allowing riders to see a crime summary over the last month. Other data such as how often trains are delayed or on time at the station could also be visualized.