Upgrade to Pro
— share decks privately, control downloads, hide ads and more …
Speaker Deck
Features
Speaker Deck
PRO
Sign in
Sign up for free
Search
Search
InfluxDB + Grafana
Search
Celso Crivelaro
July 08, 2016
Technology
270
0
Share
Embed
Copy iframe code
Copy JS code
Copy link
Start on current slide
InfluxDB + Grafana
InfluxDB + Grafana: Telemetria na sua plataforma.
Celso Crivelaro
July 08, 2016
More Decks by Celso Crivelaro
See All by Celso Crivelaro
Sistemas de Recomendação
celsocrivelaro
2
240
Big Data para Gerentes de Projetos
celsocrivelaro
0
72
FileSystems em Ruby com FUSE
celsocrivelaro
2
73
Padrões e Boas Práticas de Teste de Tela
celsocrivelaro
0
440
Projeto de APIs
celsocrivelaro
0
180
Testing Network Conditions with ToxiProxy
celsocrivelaro
1
400
Testing Network Conditions with ToxiProxy
celsocrivelaro
0
90
Actor Model in Ruby
celsocrivelaro
0
270
Separando as regras de negócios do Rails
celsocrivelaro
0
190
Other Decks in Technology
See All in Technology
StepFunctionsとGraphRAGを活用した暗黙知活用のためのRAG基盤
yakumo
0
120
Jitera Company Deck
jitera
0
270
仕様駆動開発、導入半年。「本当に速くなってるの?」にデータで答える / AICon2026_hirakawa
rakus_dev
0
320
変更し続けられるシステムをどう保つか — AI時代のSSoTという設計原則
kawauso
1
1.1k
Oracle Base Database Service 技術詳細
oracle4engineer
PRO
15
110k
10年目を迎えた「ABEMA」がどのように AI 活用を推進して、AI 駆動開発にシフトしているのか / How ABEMA, entering its 10th year, is promoting the use of AI and shifting toward AI-driven development
miyukki
0
370
AI、CDK と協働する Full TypeScript アプリケーション開発 / Full TypeScript Application with AI and CDK
geekplus_tech
2
480
OpenTelemetryにおけるGoのゼロコード・コンパイル時計装について #fukuokago
quiver
0
200
『モデル + ハーネス』で読み解く AIエージェント入門
oracle4engineer
PRO
2
160
Alphaモジュール使っていいのかい!?いけないのかい!?どっちなんだいっ!?
watany
1
320
Multicaで30個のミニプロジェクトをAIエージェント運用して見えてきたこと
eiei114
1
620
AIが当たり前の組織で エンジニアはどう育つか
nishihira
1
970
Featured
See All Featured
Intergalactic Javascript Robots from Outer Space
tanoku
273
27k
Speed Design
sergeychernyshev
33
1.9k
Color Theory Basics | Prateek | Gurzu
gurzu
0
390
The AI Revolution Will Not Be Monopolized: How open-source beats economies of scale, even for LLMs
inesmontani
PRO
3
3.6k
DBのスキルで生き残る技術 - AI時代におけるテーブル設計の勘所
soudai
PRO
67
56k
The Anti-SEO Checklist Checklist. Pubcon Cyber Week
ryanjones
0
190
Navigating Algorithm Shifts & AI Overviews - #SMXNext
aleyda
1
1.5k
Designing for humans not robots
tammielis
254
26k
How To Speak Unicorn (iThemes Webinar)
marktimemedia
1
510
The Art of Programming - Codeland 2020
erikaheidi
57
14k
Facilitating Awesome Meetings
lara
57
7k
Lightning talk: Run Django tests with GitHub Actions
sabderemane
0
220
Transcript
InfluxDB + Grafana Telemetria na sua plataforma Celso Crivelaro @celsocrivelaro
DEVELOPER @
None
None
Por quê?
Crise da Plataforma
"O software está lento..."
None
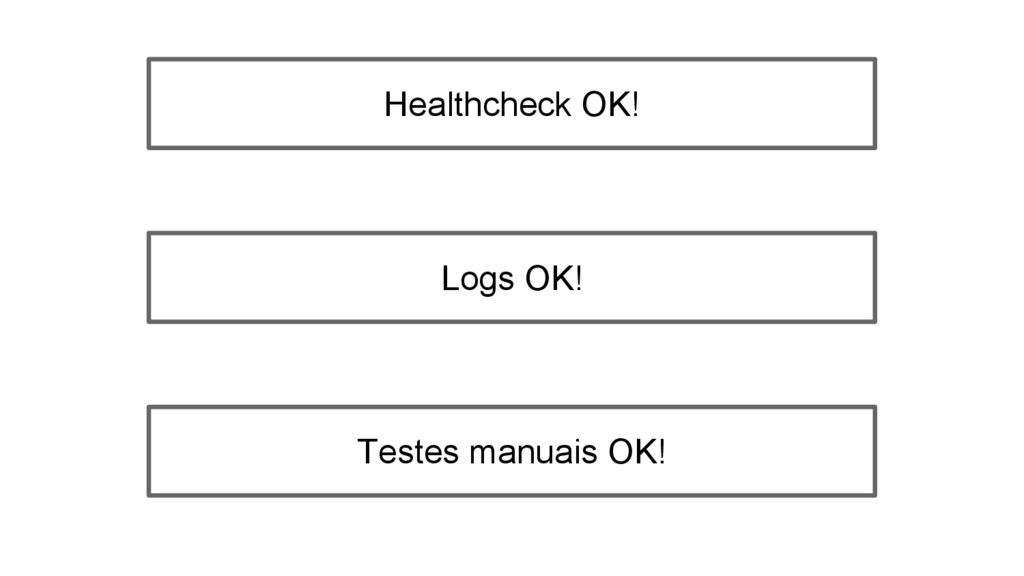
Healthcheck OK! Logs OK! Testes manuais OK!
Corrigimos o problema, mas ainda ficou a falta de visibilidade…
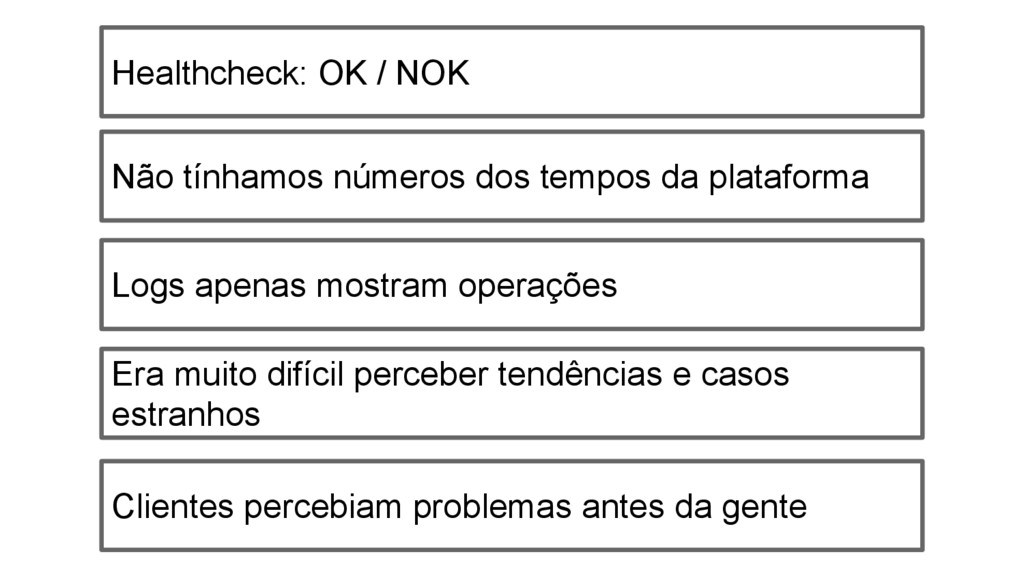
Healthcheck: OK / NOK Não tínhamos números dos tempos da
plataforma Era muito difícil perceber tendências e casos estranhos Logs apenas mostram operações Clientes percebiam problemas antes da gente
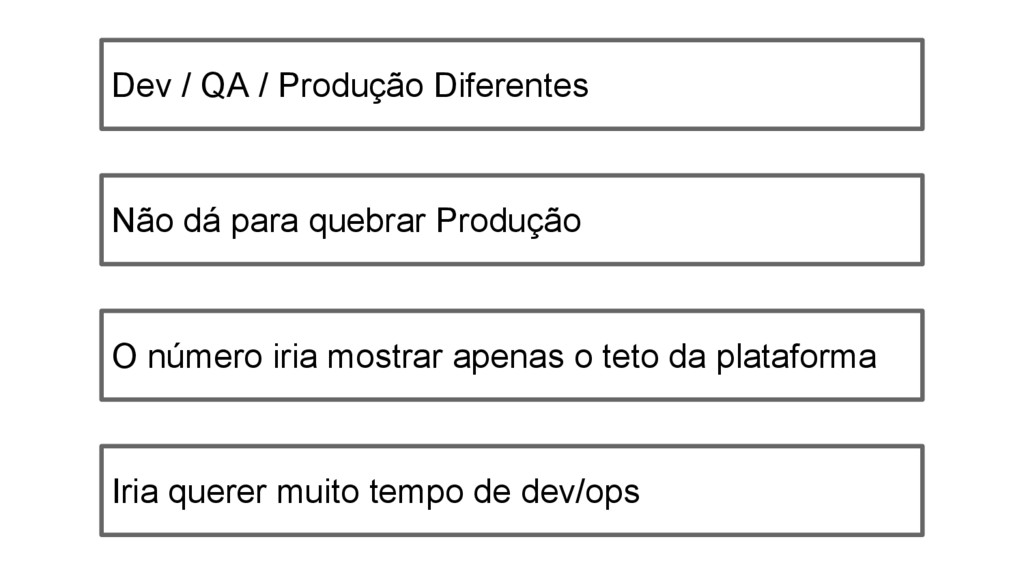
1a IDEIA Fazer um teste de carga
Dev / QA / Produção Diferentes Não dá para quebrar
Produção Iria querer muito tempo de dev/ops O número iria mostrar apenas o teto da plataforma
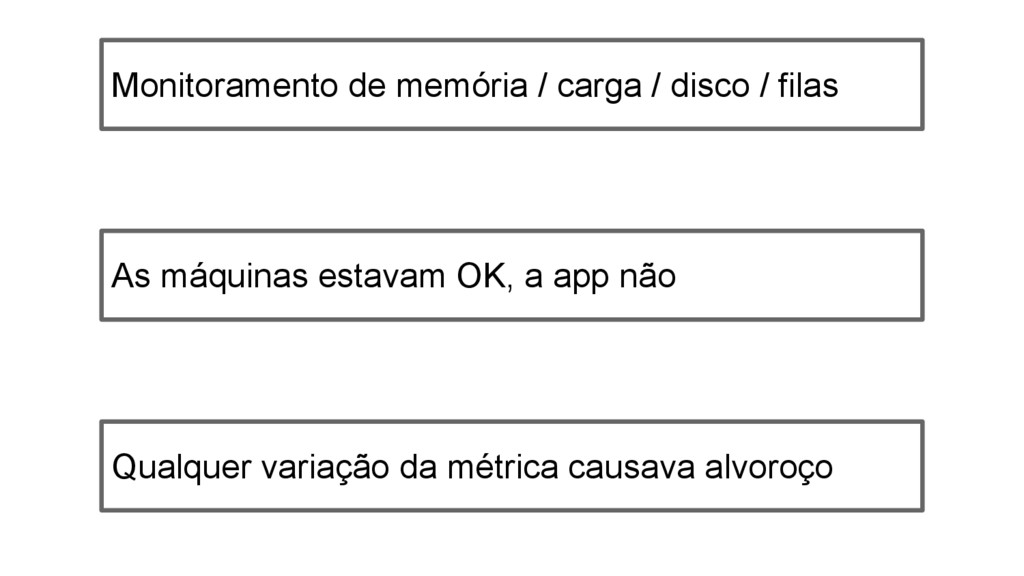
2a IDEIA Monitorações das máquinas
Monitoramento de memória / carga / disco / filas As
máquinas estavam OK, a app não Qualquer variação da métrica causava alvoroço
3a IDEIA Telemetria
Inspirações
None
None
https://www.youtube.com/watch?v=czes-oa0yik
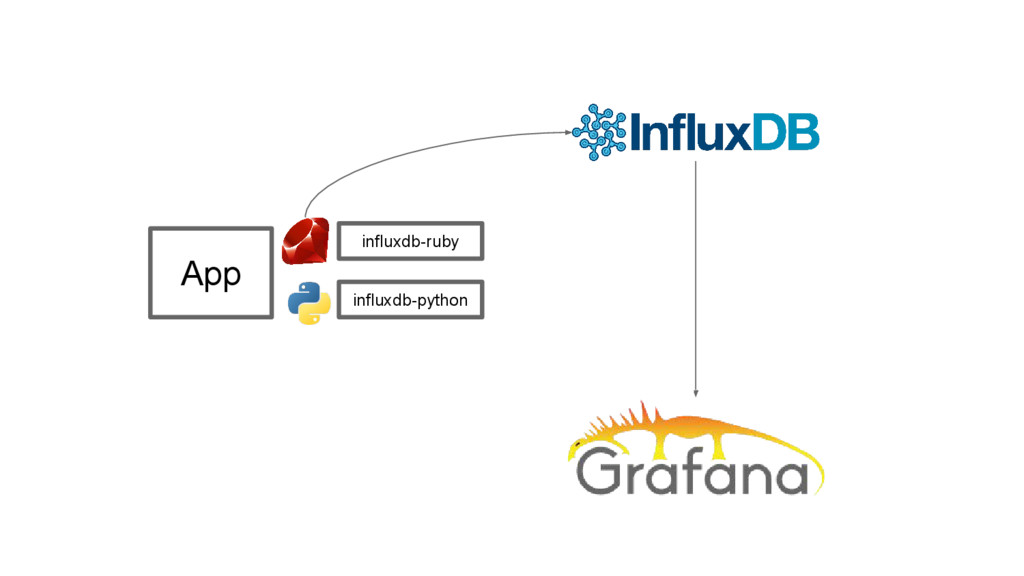
Com o quê?
App influxdb-ruby influxdb-python
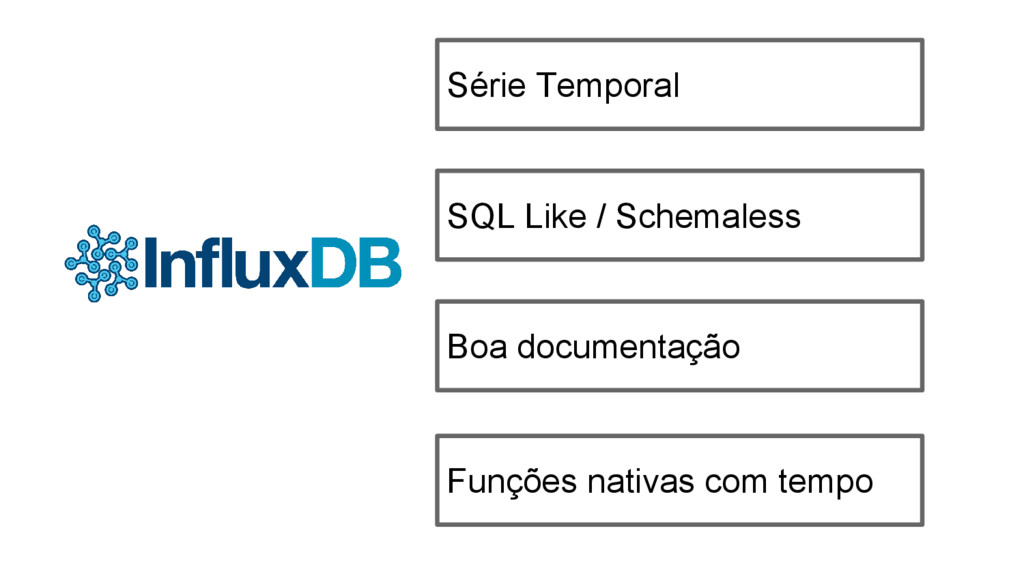
Série Temporal SQL Like / Schemaless Boa documentação Funções nativas
com tempo
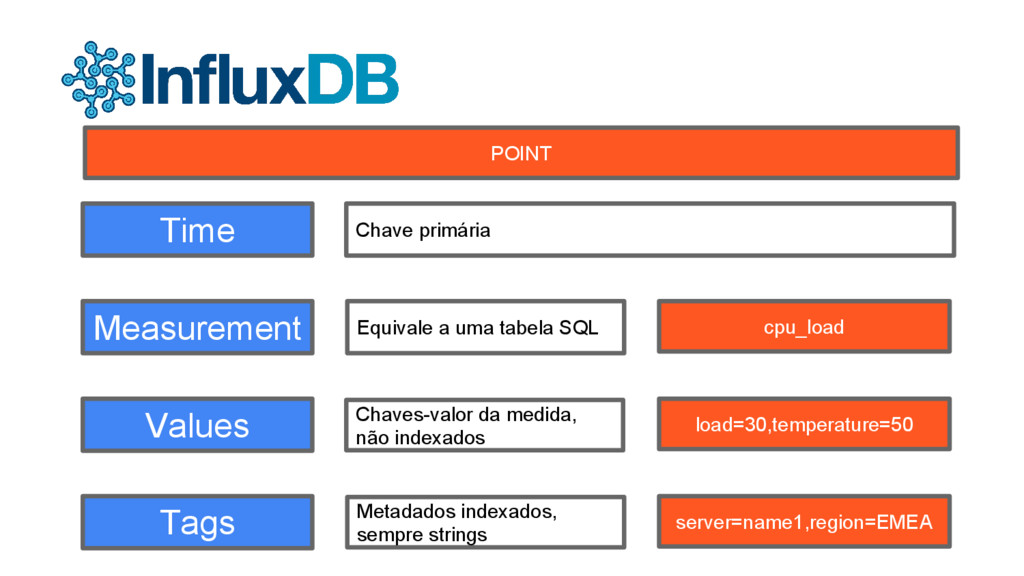
Estrutura do dado
Equivale a uma tabela SQL Chave primária Time Measurement Values
Tags Chaves-valor da medida, não indexados Metadados indexados, sempre strings cpu_load load=30,temperature=50 server=name1,region=EMEA POINT
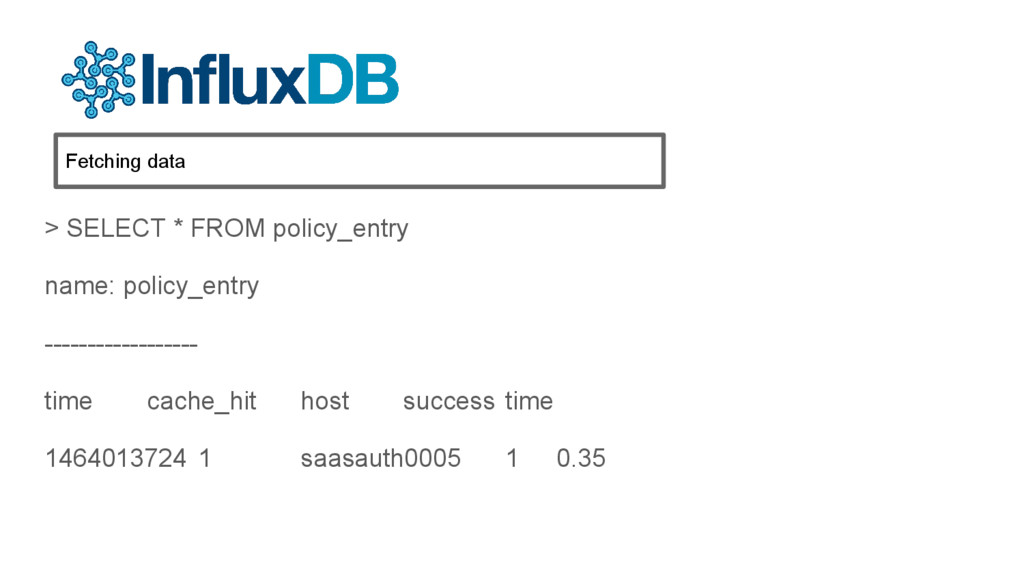
> SELECT * FROM policy_entry name: policy_entry ------------------ time cache_hit
host success time 1464013724 1 saasauth0005 1 0.35 Fetching data
> SELECT * FROM policy_entry name: policy_entry ------------------ time cache_hit
host success time 1464013724 1 saasauth0005 1 0.35 Fetching data
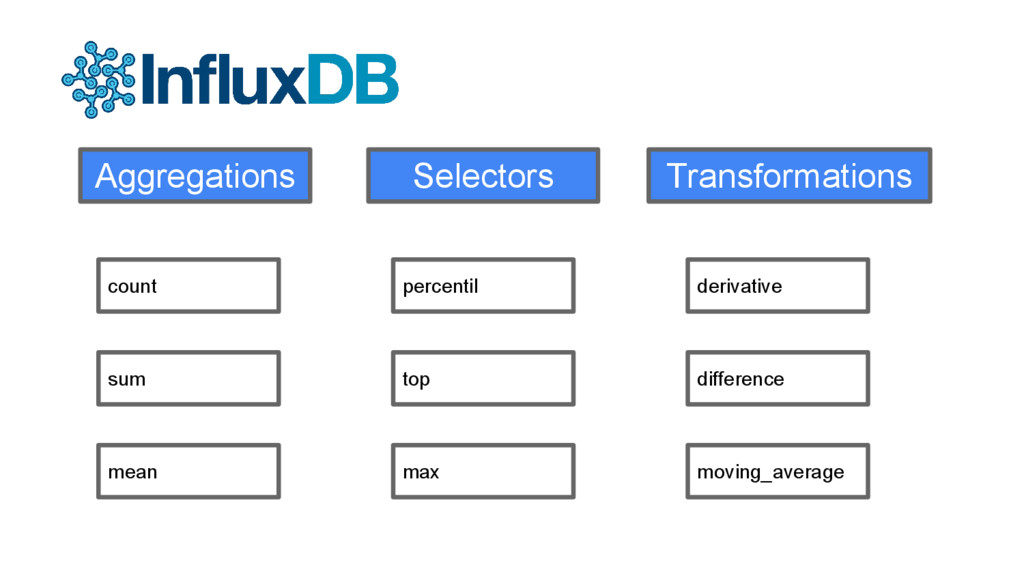
Funções
count percentil sum mean top max derivative difference moving_average Aggregations
Selectors Transformations
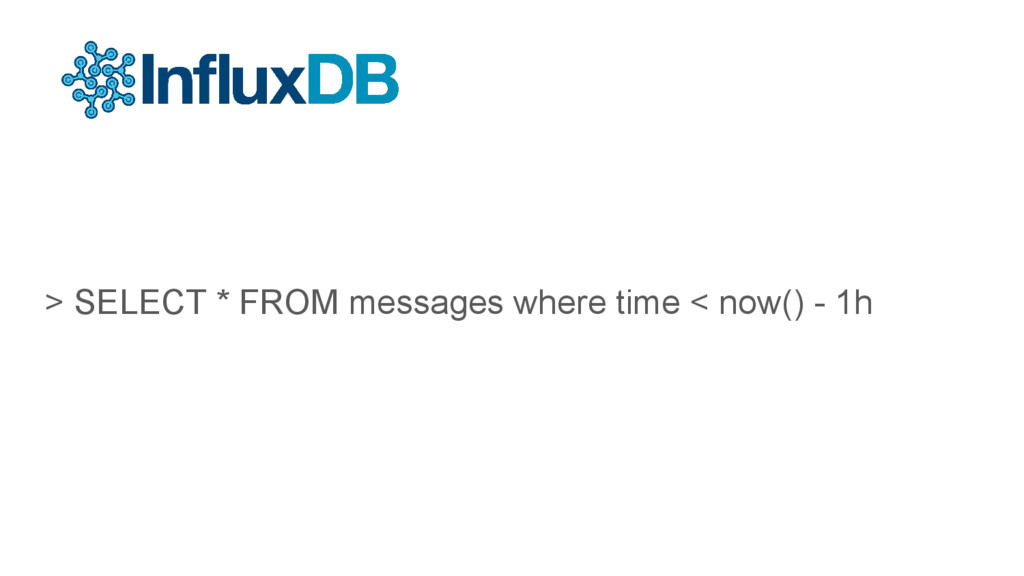
Funções de tempo
> SELECT * FROM messages where time < now() -
1h
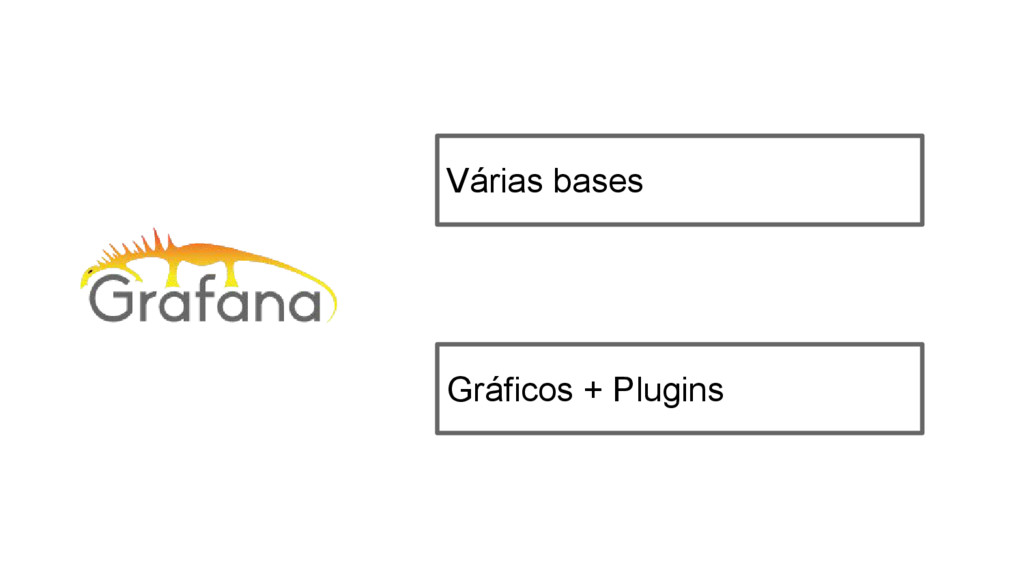
Várias bases Gráficos + Plugins
None
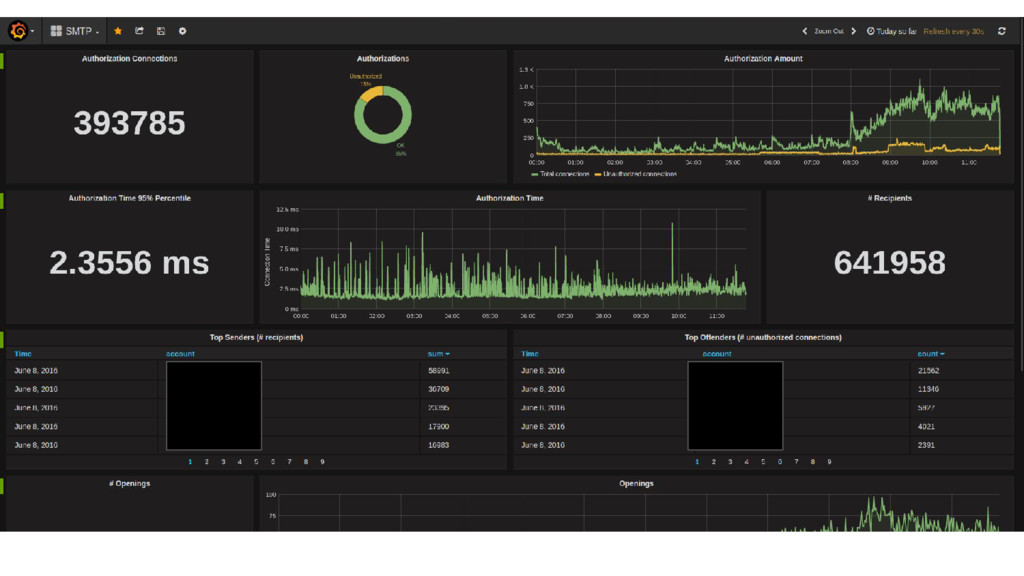
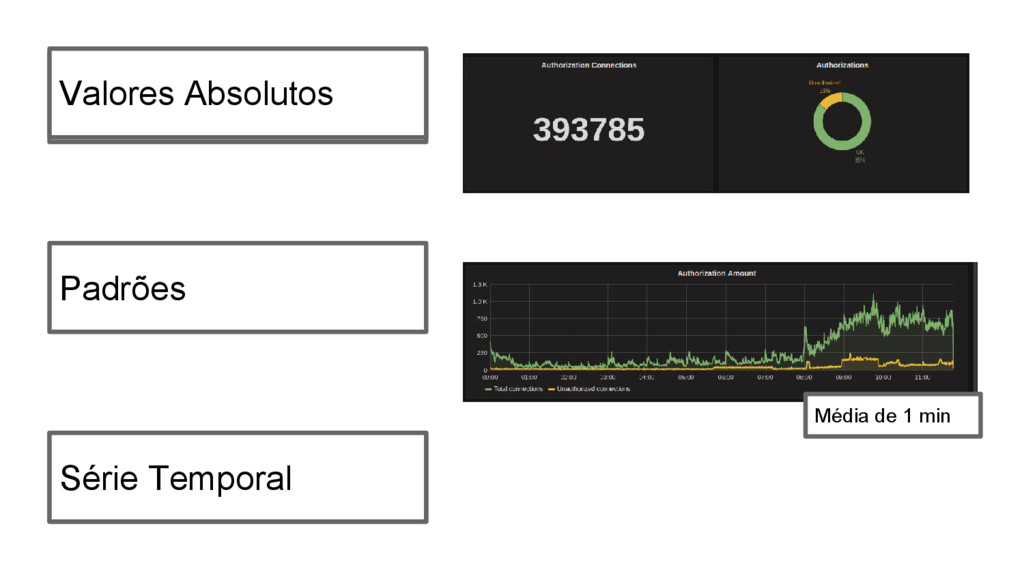
Como representar os dados?
Série Temporal Padrões Média de 1 min Valores Absolutos Valores
Absolutos Série Temporal
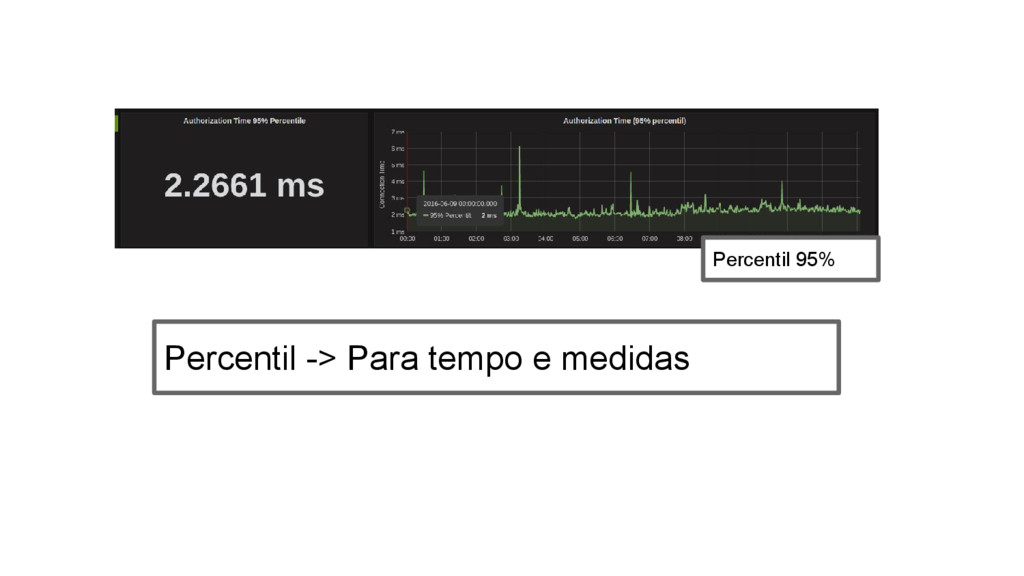
Percentil -> Para tempo e medidas Percentil 95%
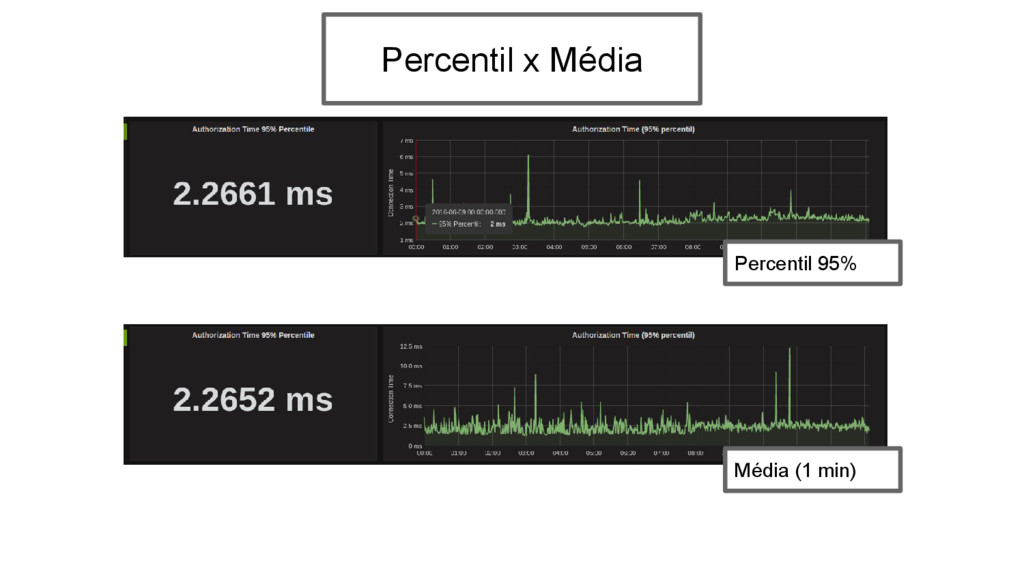
Percentil 95% Média (1 min) Percentil x Média
None
None
Obrigado! @celsocrivelaro http://crivelaro.me