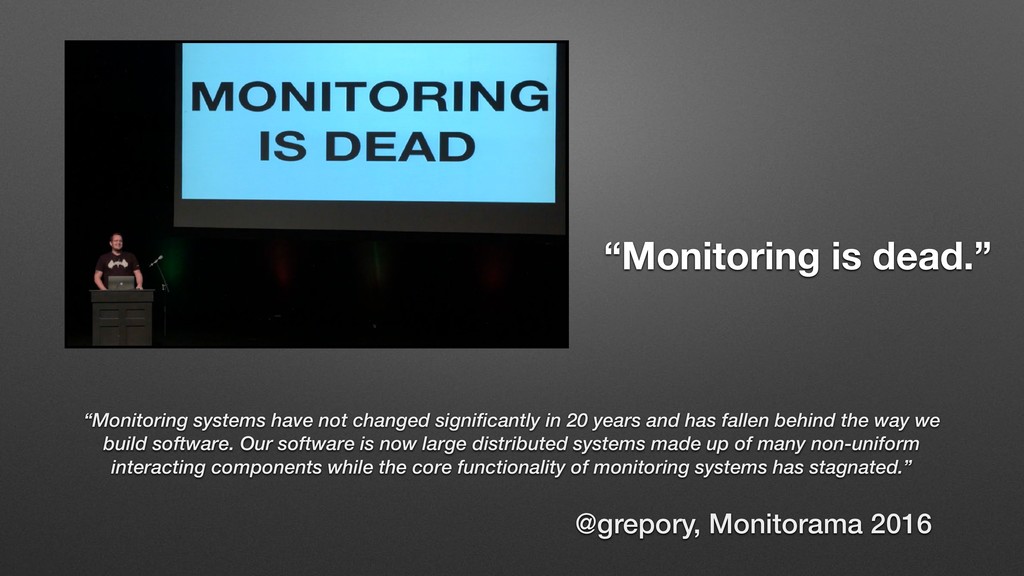
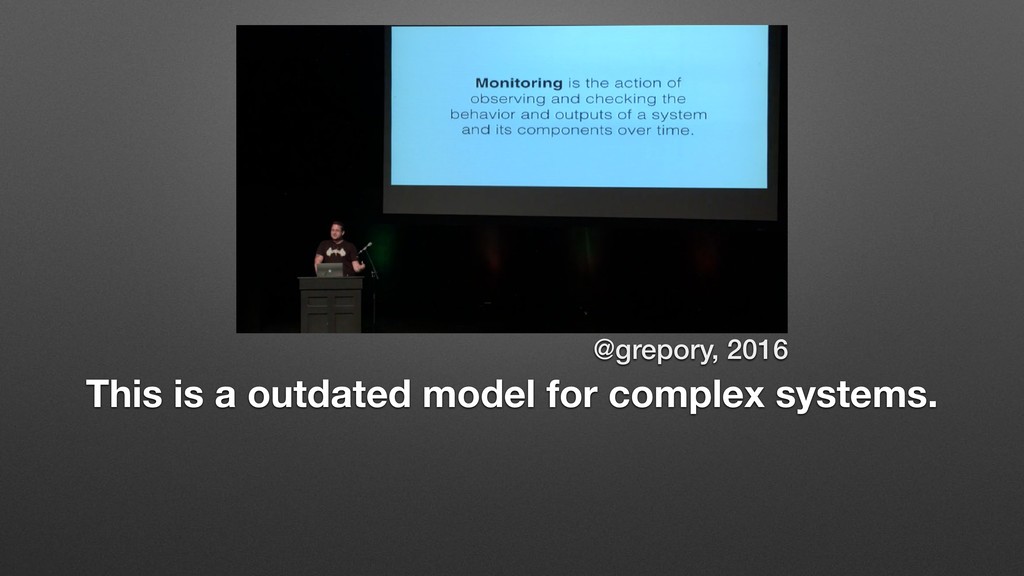
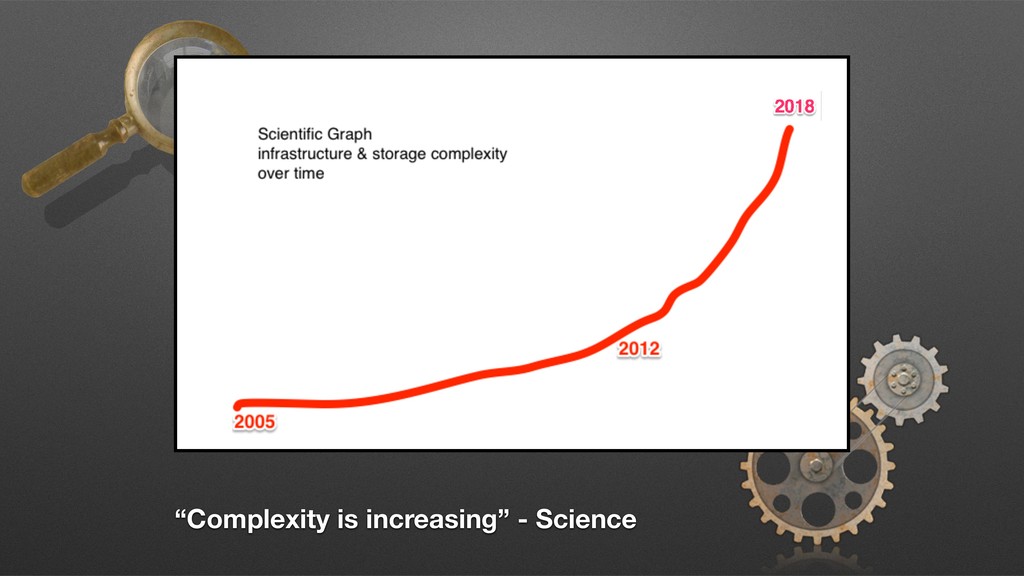
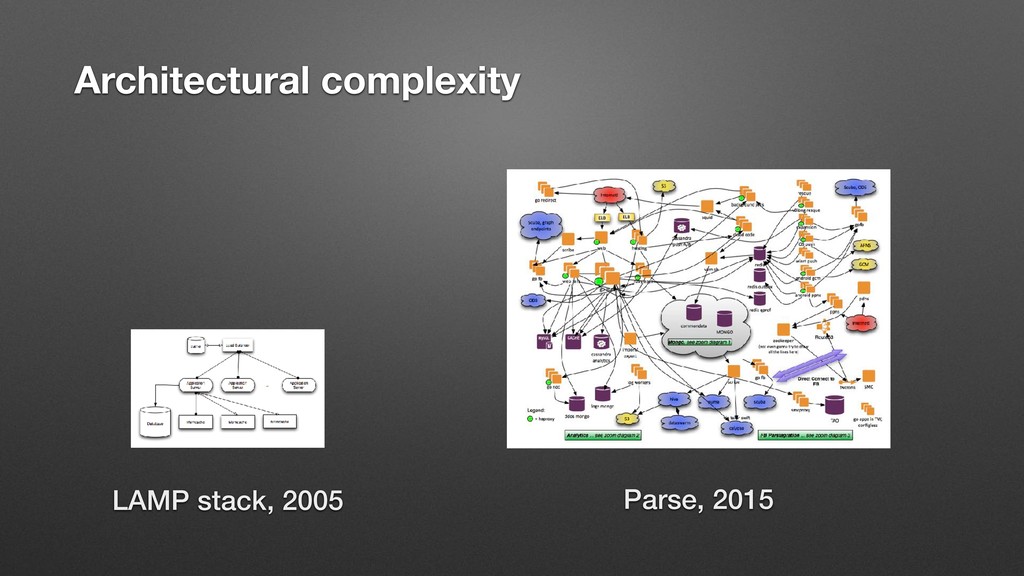
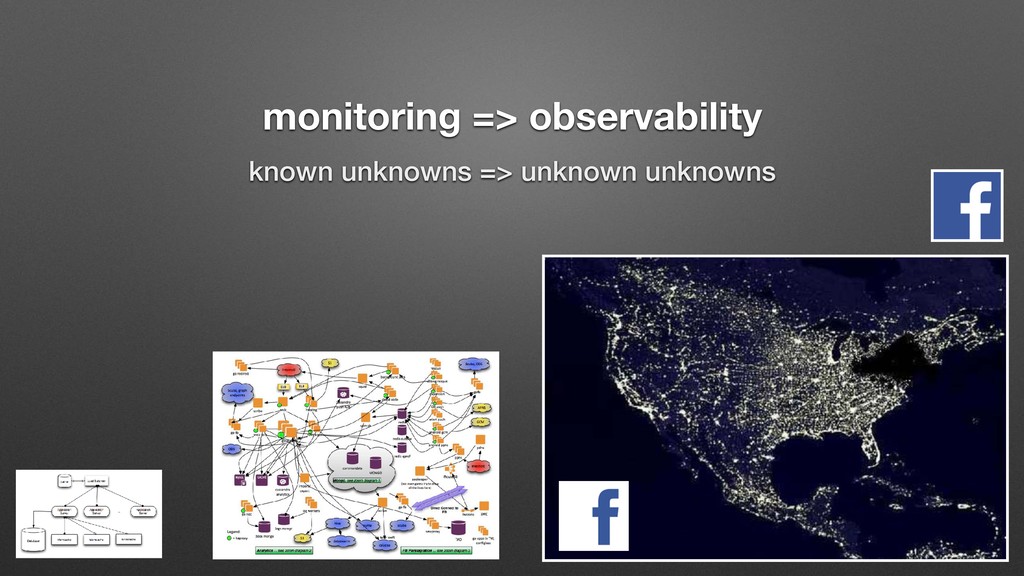
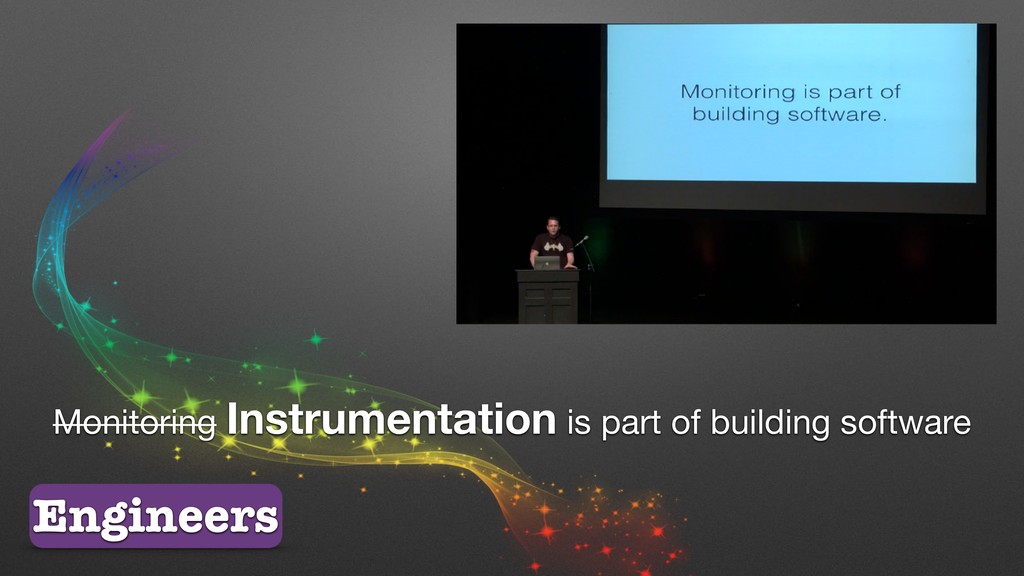
changed significantly in 20 years and has fallen behind the way we build software. Our software is now large distributed systems made up of many non-uniform interacting components while the core functionality of monitoring systems has stagnated.”
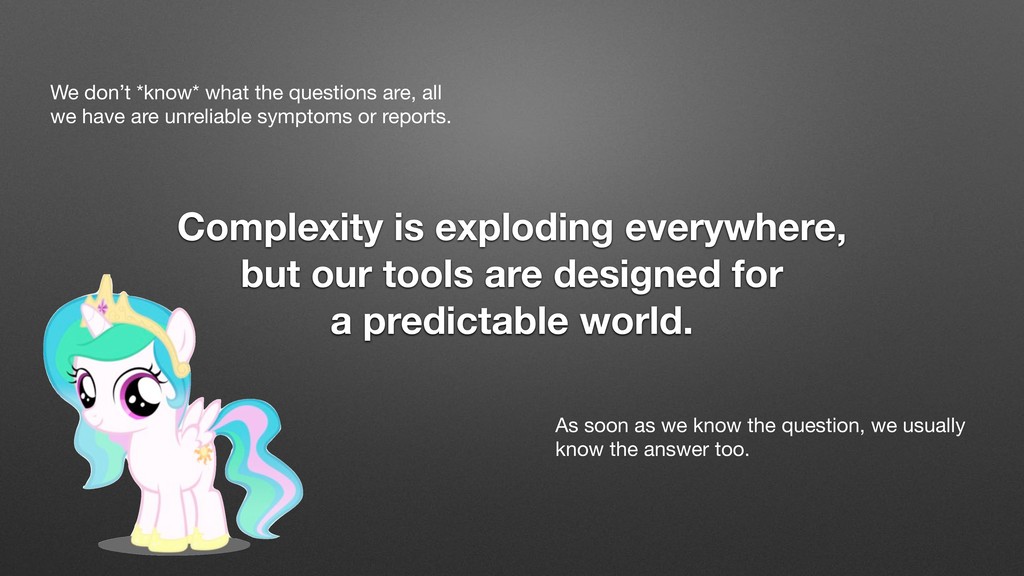
are unreliable symptoms or reports. Complexity is exploding everywhere, but our tools are designed for a predictable world. As soon as we know the question, we usually know the answer too.
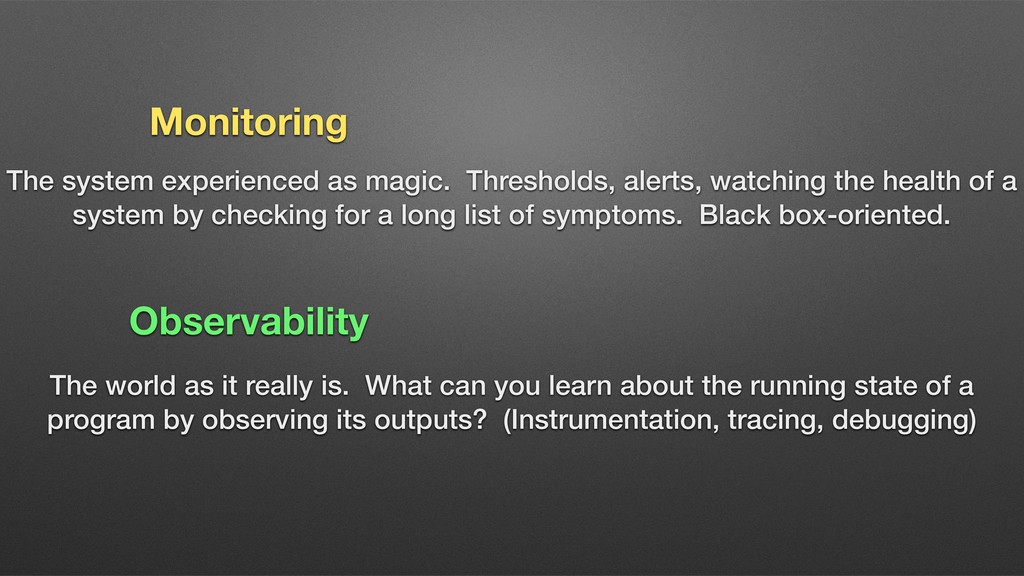
health of a system by checking for a long list of symptoms. Black box-oriented. Observability The world as it really is. What can you learn about the running state of a program by observing its outputs? (Instrumentation, tracing, debugging)
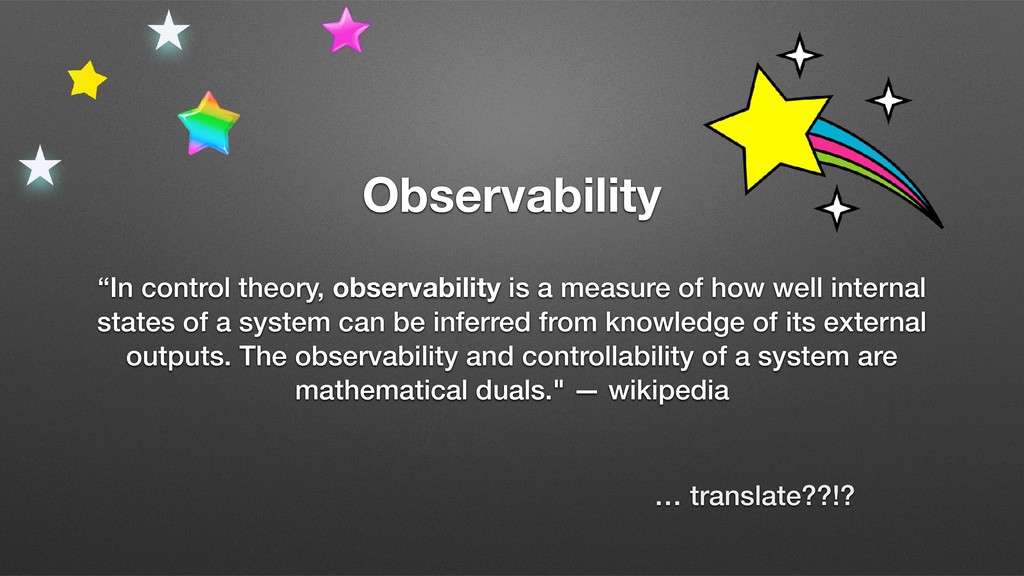
well internal states of a system can be inferred from knowledge of its external outputs. The observability and controllability of a system are mathematical duals." — wikipedia … translate??!?
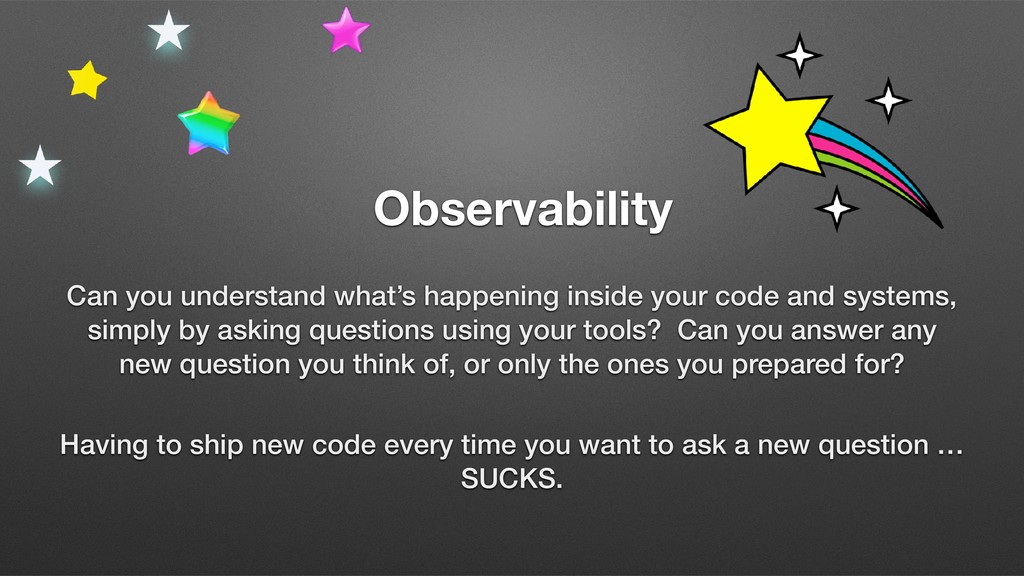
systems, simply by asking questions using your tools? Can you answer any new question you think of, or only the ones you prepared for? Having to ship new code every time you want to ask a new question … SUCKS.
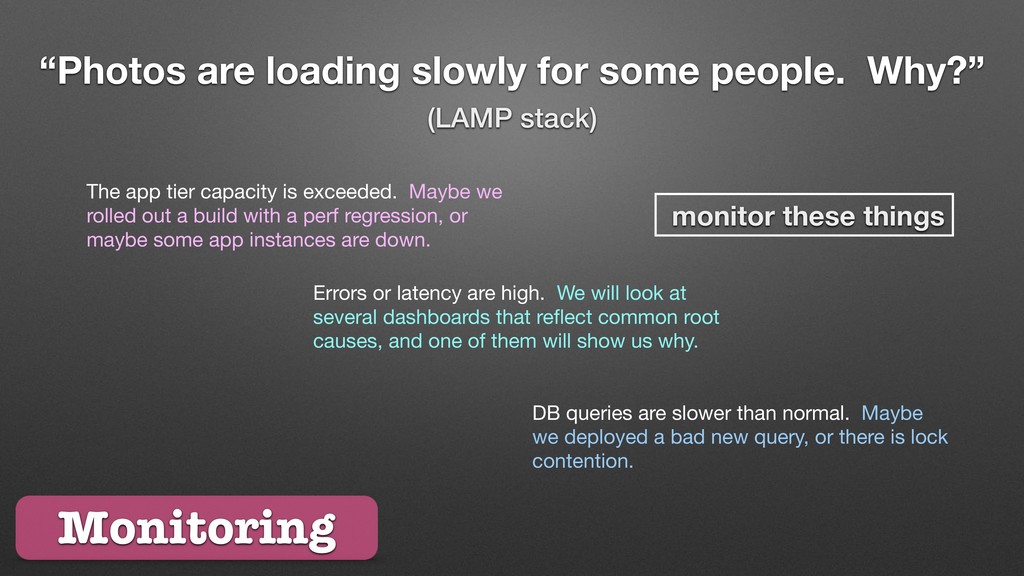
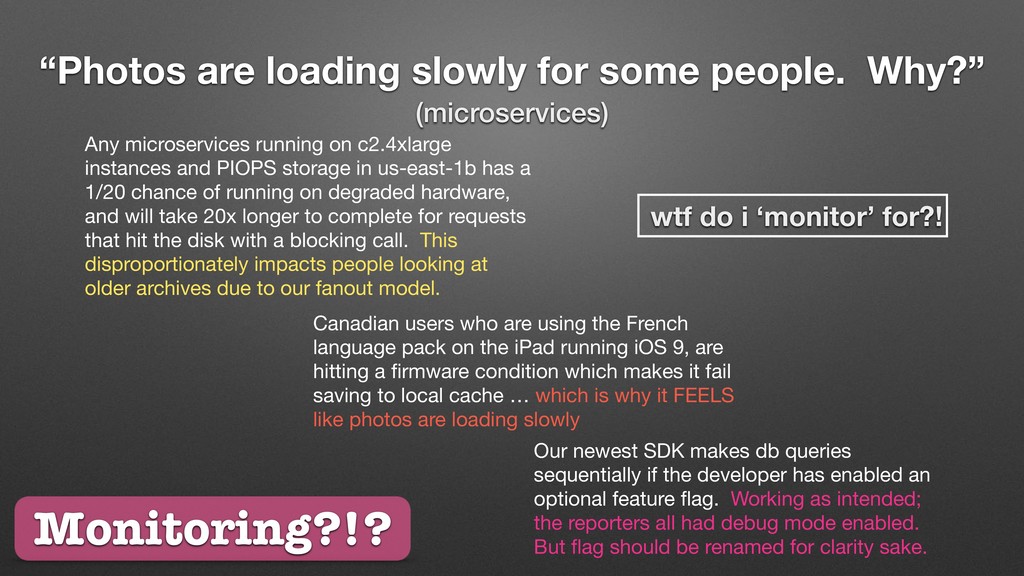
a build with a perf regression, or maybe some app instances are down. DB queries are slower than normal. Maybe we deployed a bad new query, or there is lock contention. Errors or latency are high. We will look at several dashboards that reflect common root causes, and one of them will show us why. “Photos are loading slowly for some people. Why?” Monitoring (LAMP stack) monitor these things
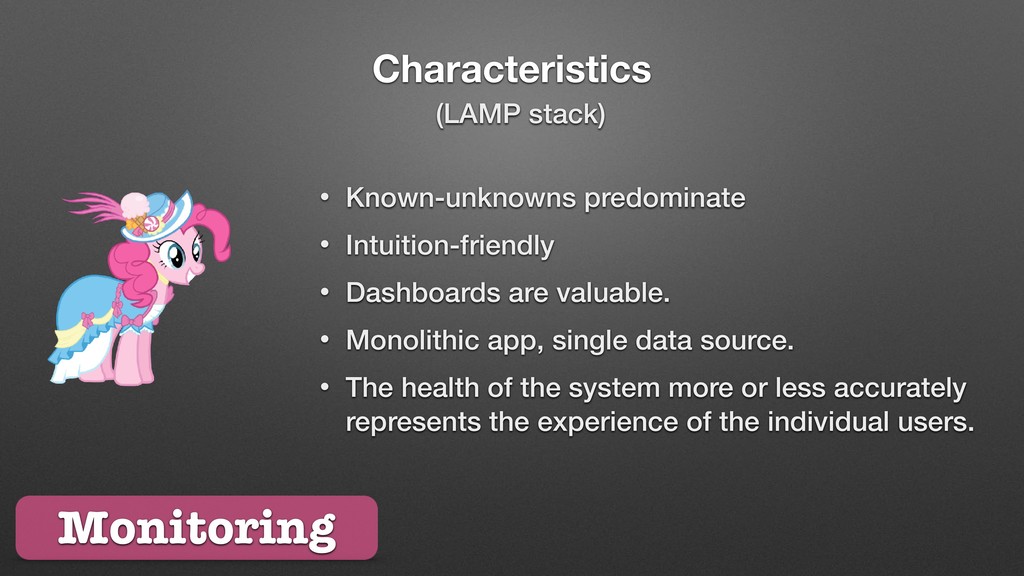
valuable. • Monolithic app, single data source. • The health of the system more or less accurately represents the experience of the individual users. (LAMP stack)
alerts • Proactively notify engineers of failures and warnings • Maintain a runbook for stable production systems • Rely on clusters and clumps of tightly coupled systems all breaking at once
microservices running on c2.4xlarge instances and PIOPS storage in us-east-1b has a 1/20 chance of running on degraded hardware, and will take 20x longer to complete for requests that hit the disk with a blocking call. This disproportionately impacts people looking at older archives due to our fanout model. Canadian users who are using the French language pack on the iPad running iOS 9, are hitting a firmware condition which makes it fail saving to local cache … which is why it FEELS like photos are loading slowly Our newest SDK makes db queries sequentially if the developer has enabled an optional feature flag. Working as intended; the reporters all had debug mode enabled. But flag should be renamed for clarity sake. wtf do i ‘monitor’ for?! Monitoring?!?
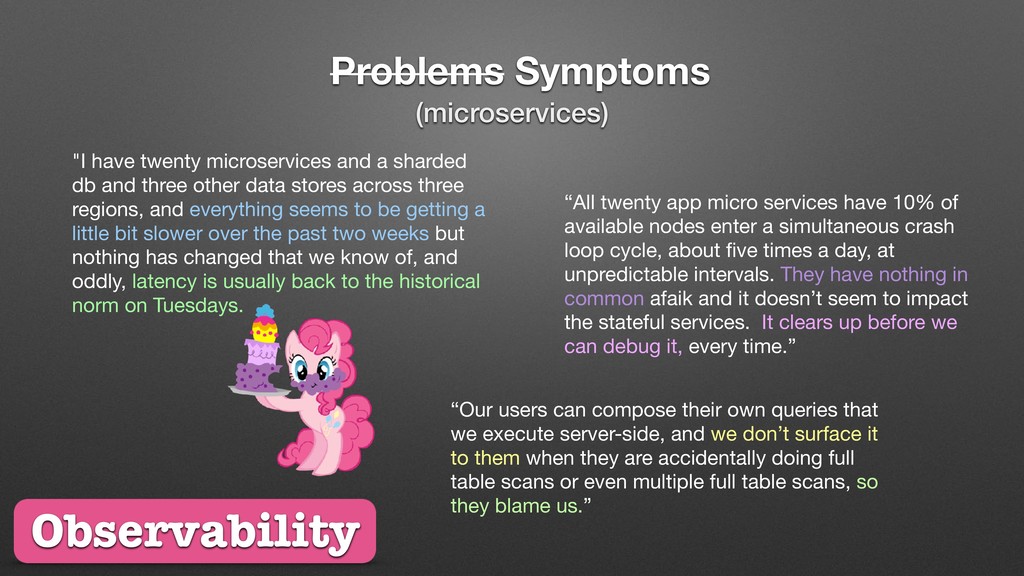
and three other data stores across three regions, and everything seems to be getting a little bit slower over the past two weeks but nothing has changed that we know of, and oddly, latency is usually back to the historical norm on Tuesdays. “All twenty app micro services have 10% of available nodes enter a simultaneous crash loop cycle, about five times a day, at unpredictable intervals. They have nothing in common afaik and it doesn’t seem to impact the stateful services. It clears up before we can debug it, every time.” “Our users can compose their own queries that we execute server-side, and we don’t surface it to them when they are accidentally doing full table scans or even multiple full table scans, so they blame us.” Observability (microservices)
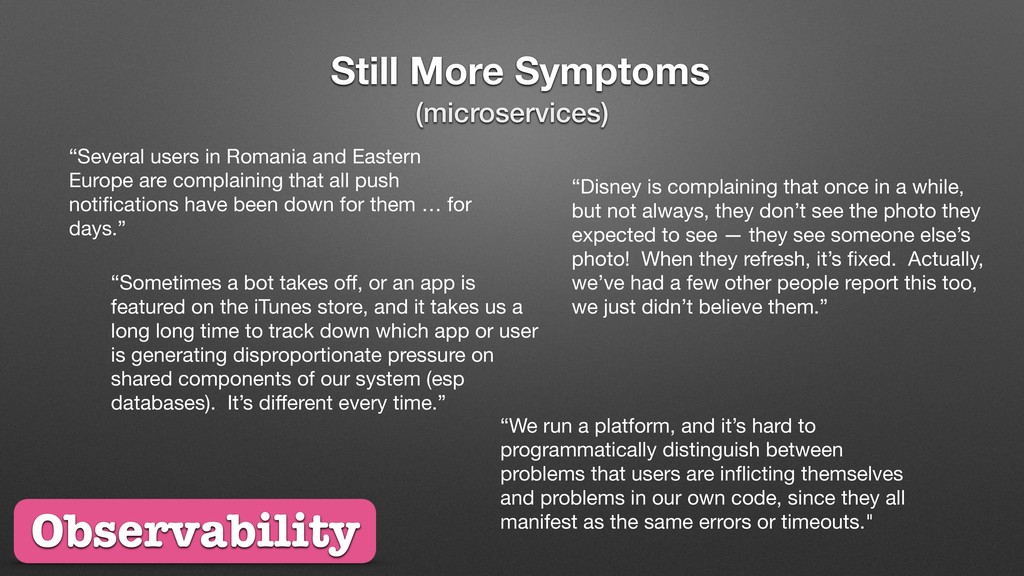
are complaining that all push notifications have been down for them … for days.” “Disney is complaining that once in a while, but not always, they don’t see the photo they expected to see — they see someone else’s photo! When they refresh, it’s fixed. Actually, we’ve had a few other people report this too, we just didn’t believe them.” “Sometimes a bot takes off, or an app is featured on the iTunes store, and it takes us a long long time to track down which app or user is generating disproportionate pressure on shared components of our system (esp databases). It’s different every time.” Observability “We run a platform, and it’s hard to programmatically distinguish between problems that users are inflicting themselves and problems in our own code, since they all manifest as the same errors or timeouts." (microservices)
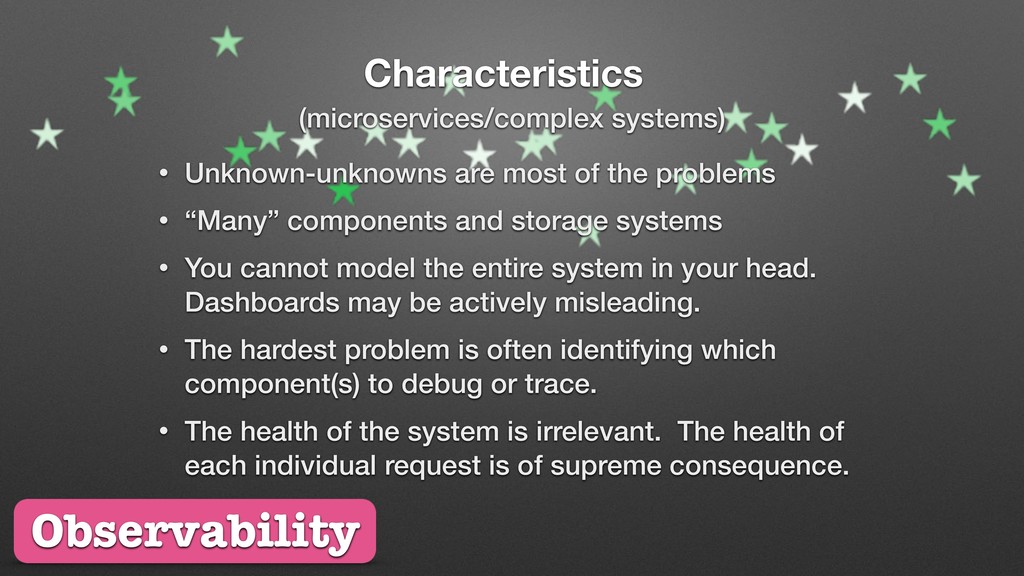
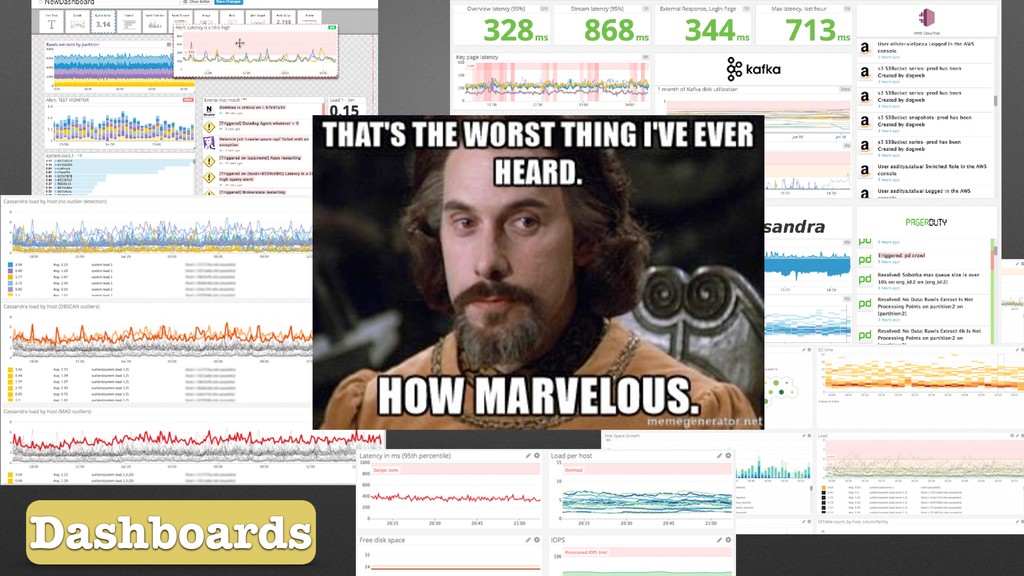
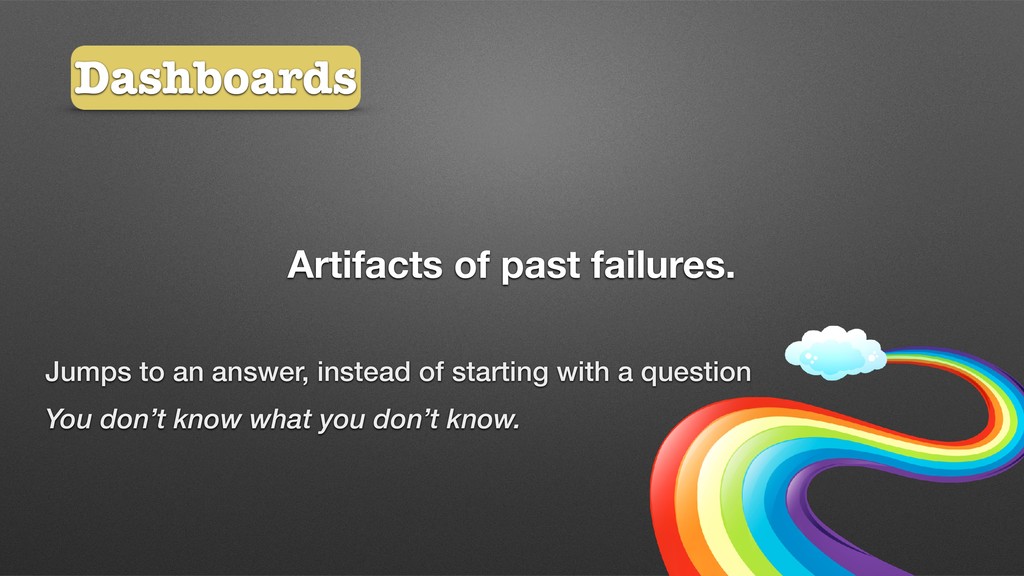
components and storage systems • You cannot model the entire system in your head. Dashboards may be actively misleading. • The hardest problem is often identifying which component(s) to debug or trace. • The health of the system is irrelevant. The health of each individual request is of supreme consequence. (microservices/complex systems) Observability
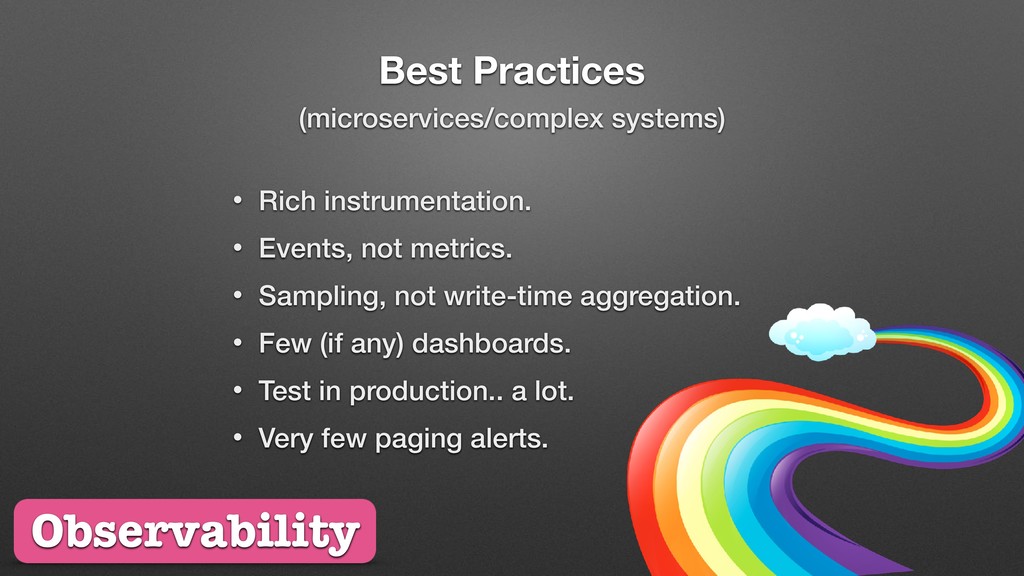
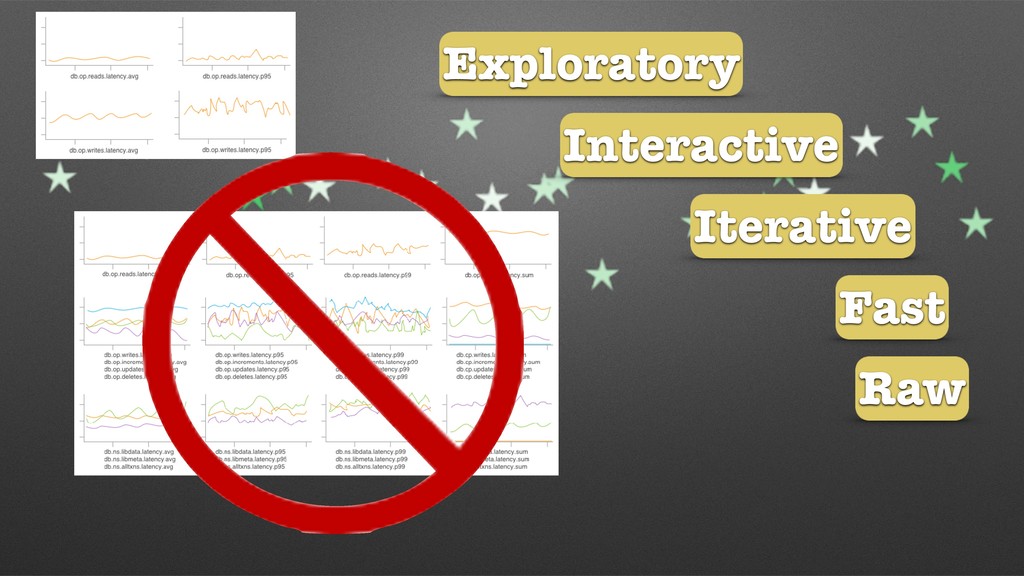
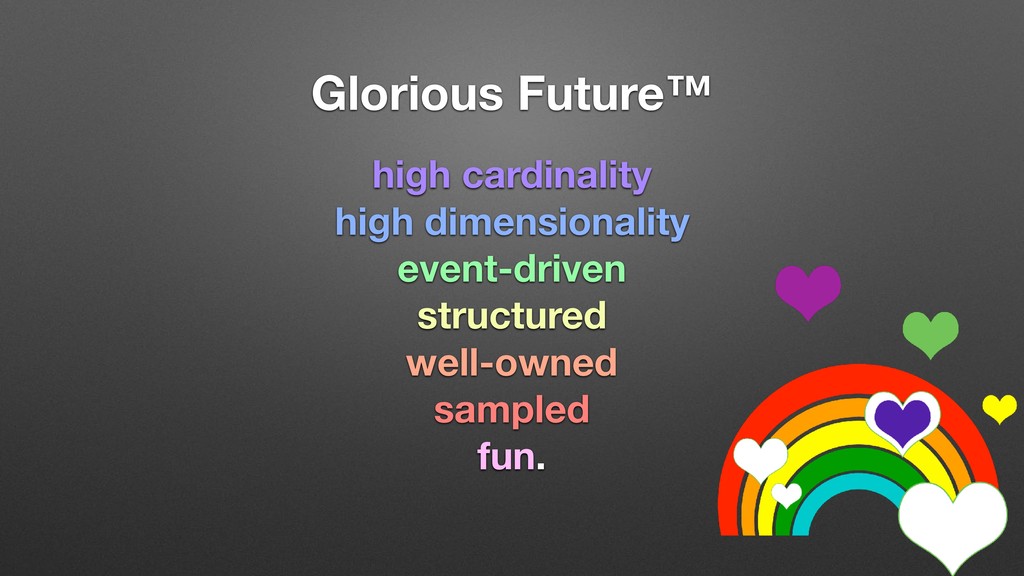
Sampling, not write-time aggregation. • Few (if any) dashboards. • Test in production.. a lot. • Very few paging alerts. Observability (microservices/complex systems)
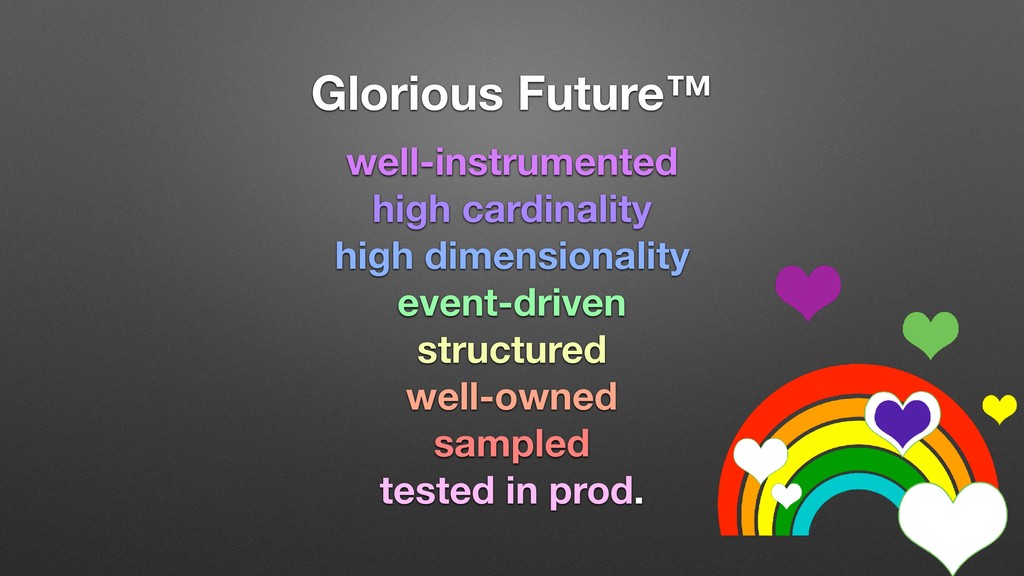
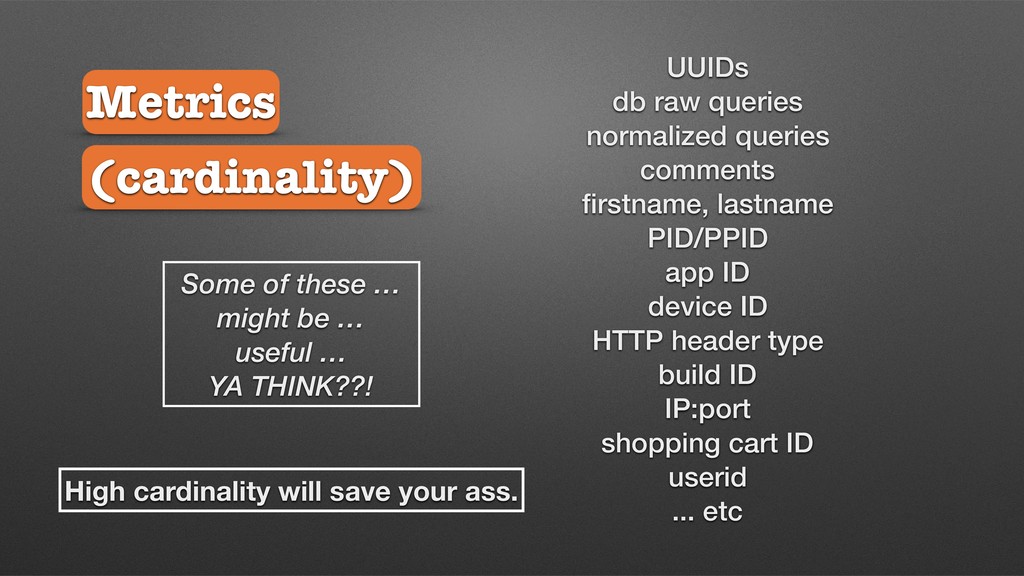
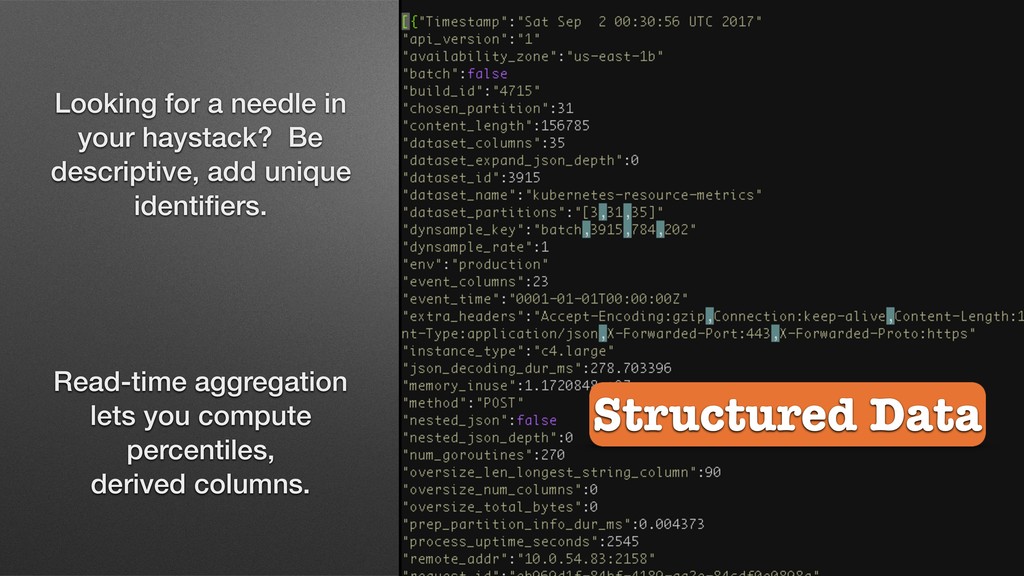
app ID device ID HTTP header type build ID IP:port shopping cart ID userid ... etc Some of these … might be … useful … YA THINK??! High cardinality will save your ass. Metrics (cardinality)
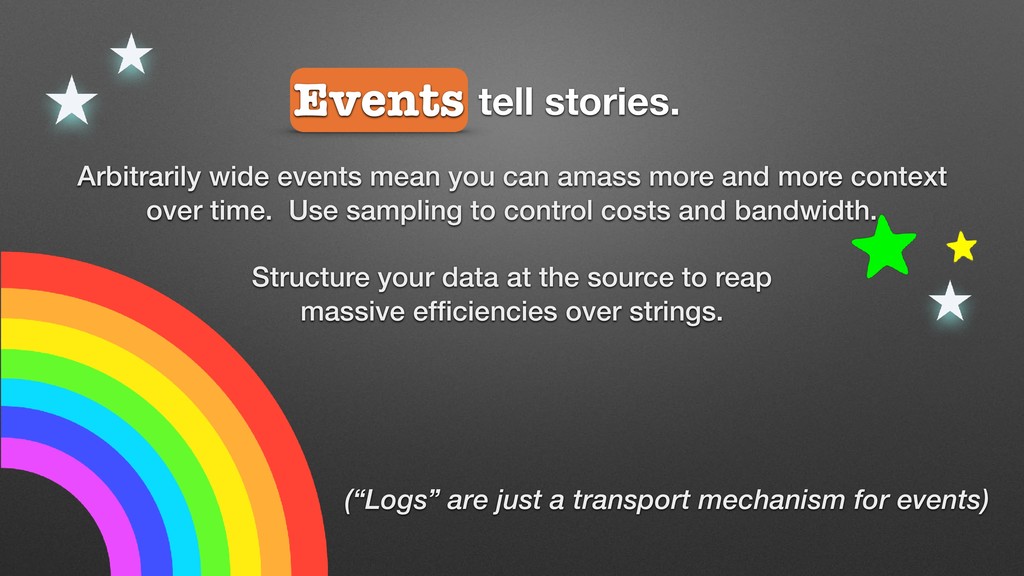
more and more context over time. Use sampling to control costs and bandwidth. Structure your data at the source to reap massive efficiencies over strings. Events (“Logs” are just a transport mechanism for events)
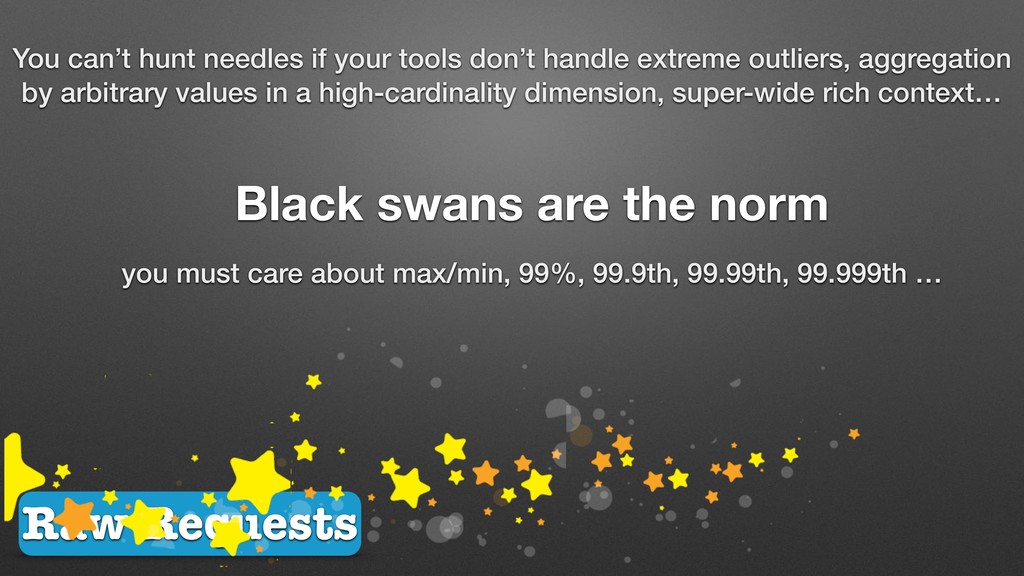
handle extreme outliers, aggregation by arbitrary values in a high-cardinality dimension, super-wide rich context… Black swans are the norm you must care about max/min, 99%, 99.9th, 99.99th, 99.999th …
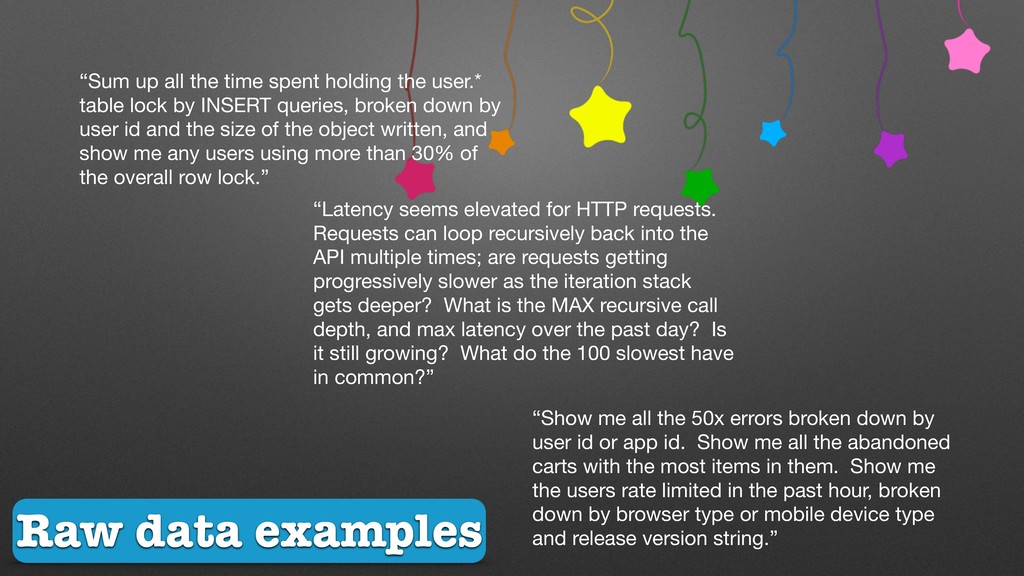
the user.* table lock by INSERT queries, broken down by user id and the size of the object written, and show me any users using more than 30% of the overall row lock.” “Latency seems elevated for HTTP requests. Requests can loop recursively back into the API multiple times; are requests getting progressively slower as the iteration stack gets deeper? What is the MAX recursive call depth, and max latency over the past day? Is it still growing? What do the 100 slowest have in common?” “Show me all the 50x errors broken down by user id or app id. Show me all the abandoned carts with the most items in them. Show me the users rate limited in the past hour, broken down by browser type or mobile device type and release version string.”
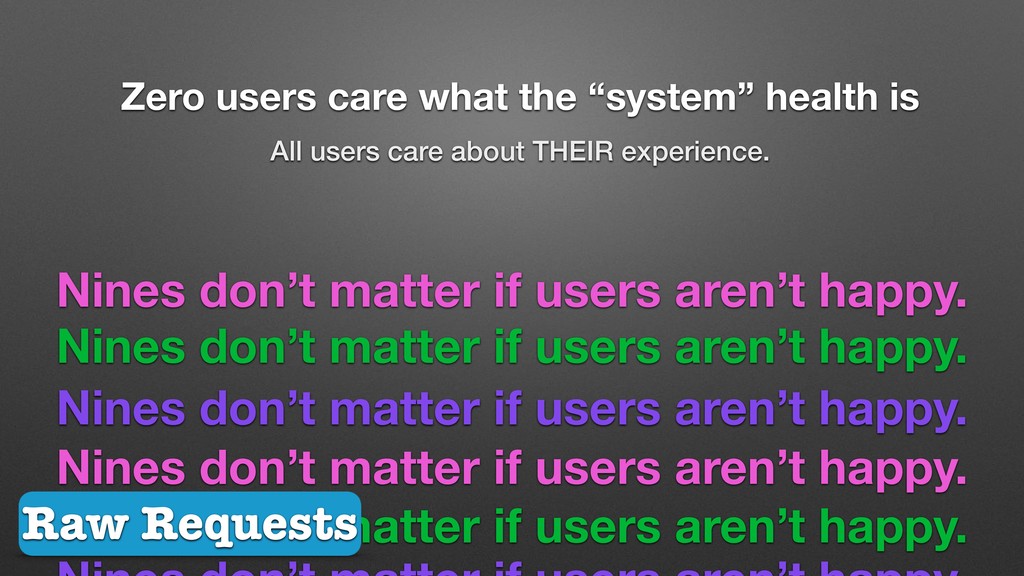
care about THEIR experience. Nines don’t matter if users aren’t happy. Nines don’t matter if users aren’t happy. Nines don’t matter if users aren’t happy. Nines don’t matter if users aren’t happy. Nines don’t matter if users aren’t happy. Raw Requests
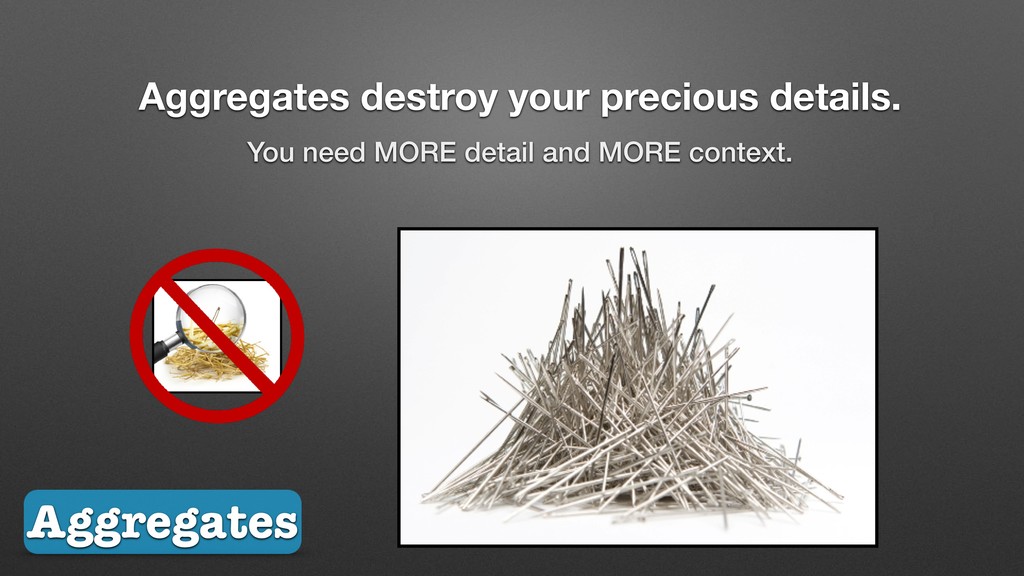
outliers, aggregation by arbitrary values in a high-cardinality dimension, super-wide rich context… you must be able to explore any individual event. find and describe any needle in the haystack Metrics:System::Events:Request
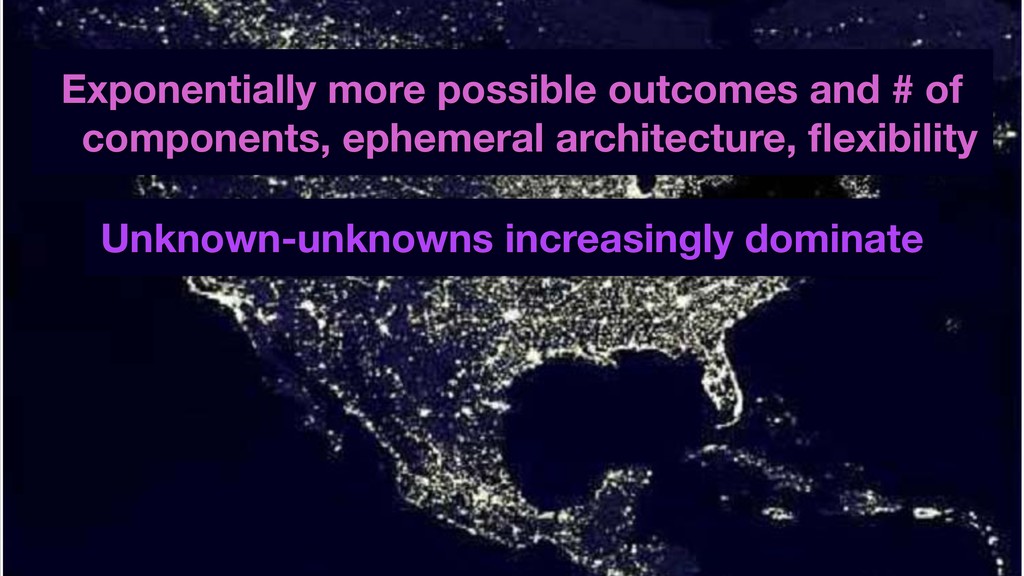
developers single tenant => multi tenancy app could reason about => def cannot reason about distributed systems: it is often harder to find out where the problem is, than what the problem is. converging trends:


 charity
 inariku
 amixedcolor
 taiki45
 tomoaki25
 wadayusuke
 tnir
 wa6sn
 kazzpapa3
 z63d
 bcantrill
 sachag
 aleyda
 jonoalderson
 tmiket
 sabderemane
 reverentgeek
 dougneiner
 bluesmoon
 frankvandijk
 garrettdimon
 katarinadahlin