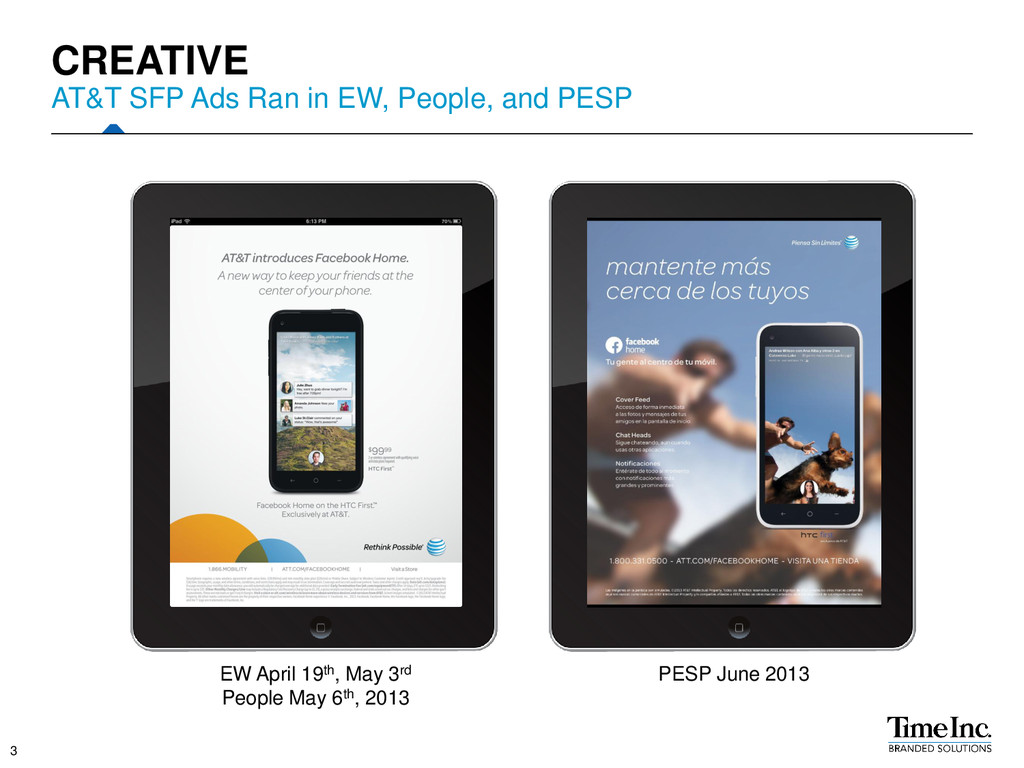
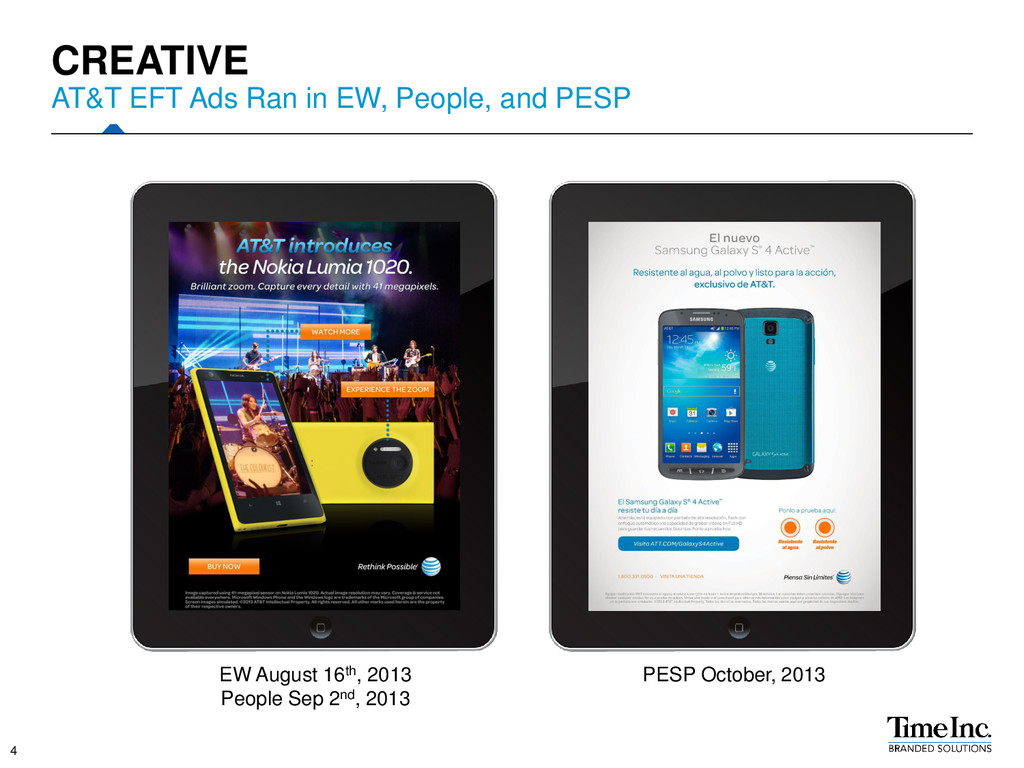
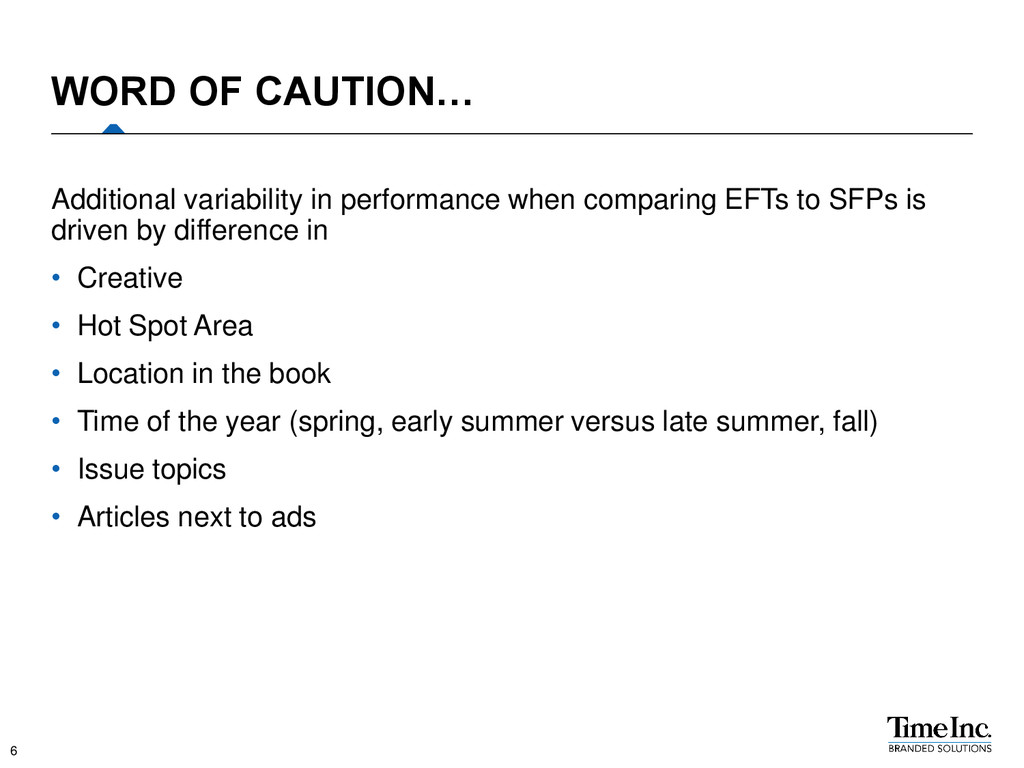
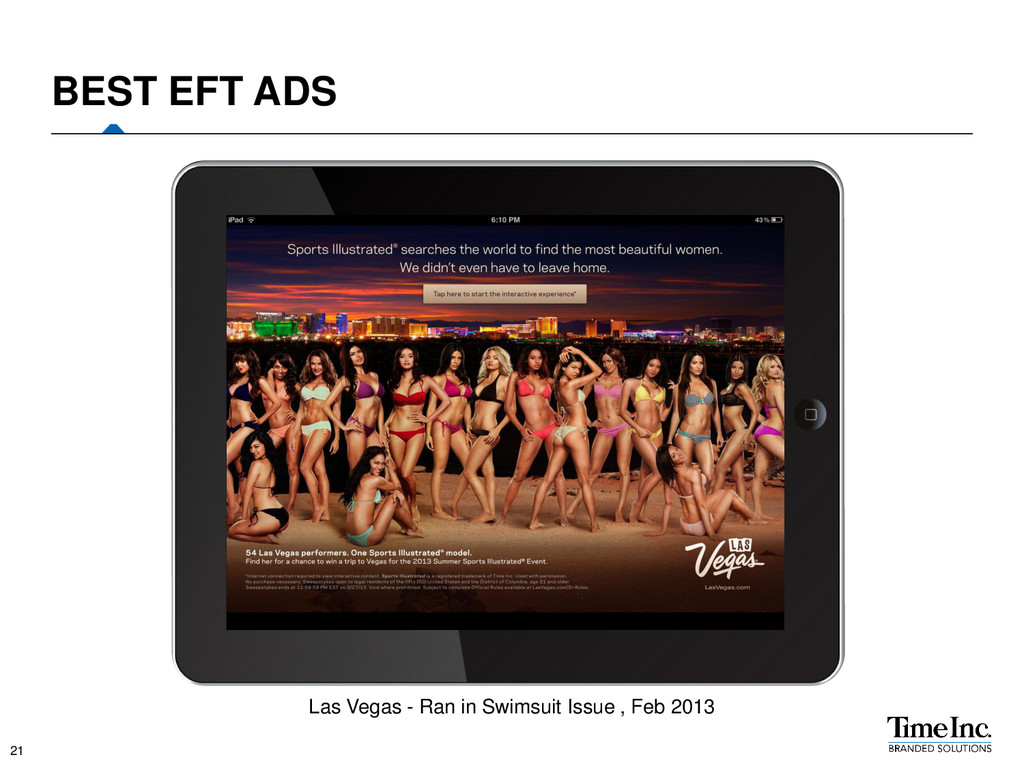
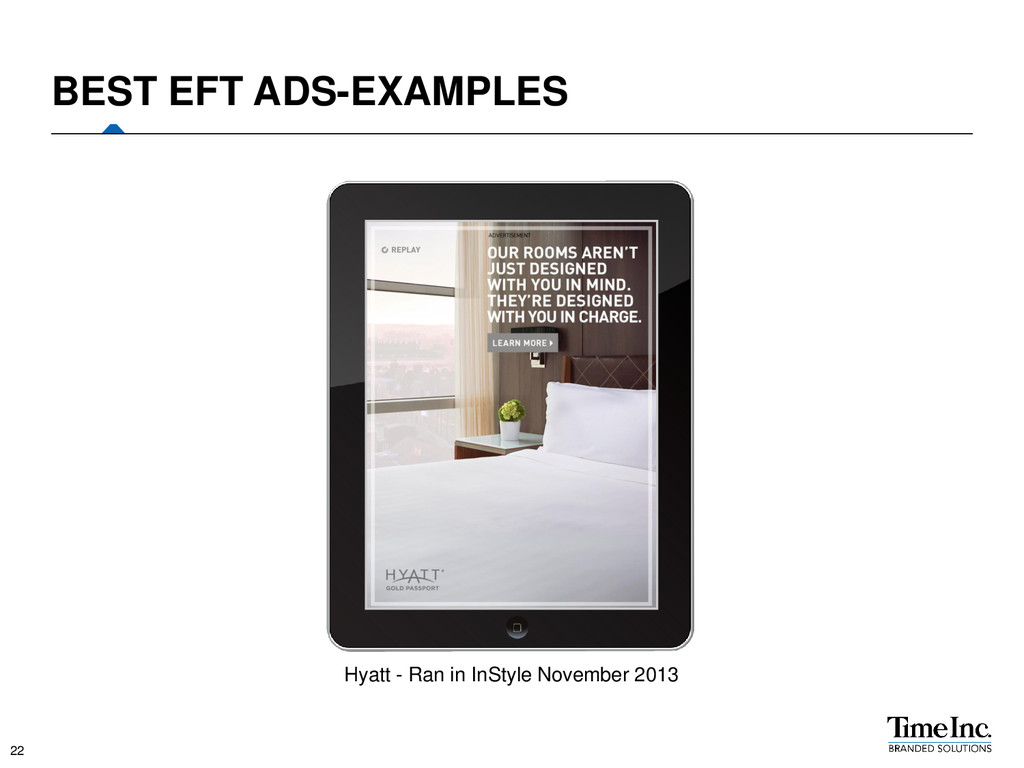
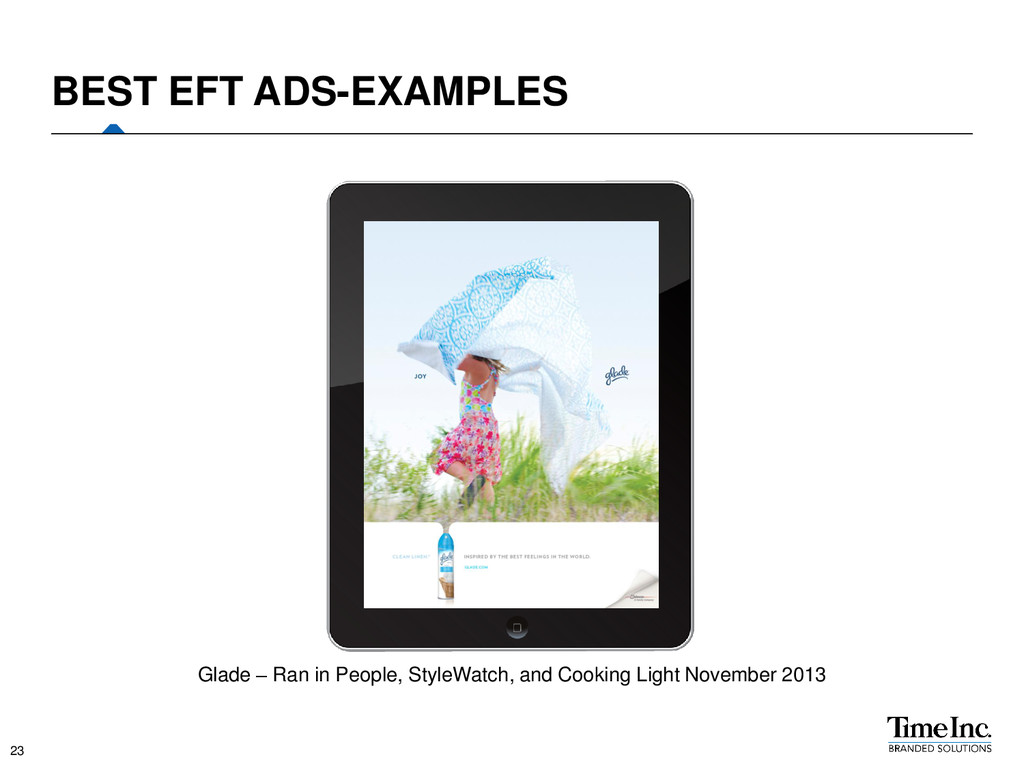
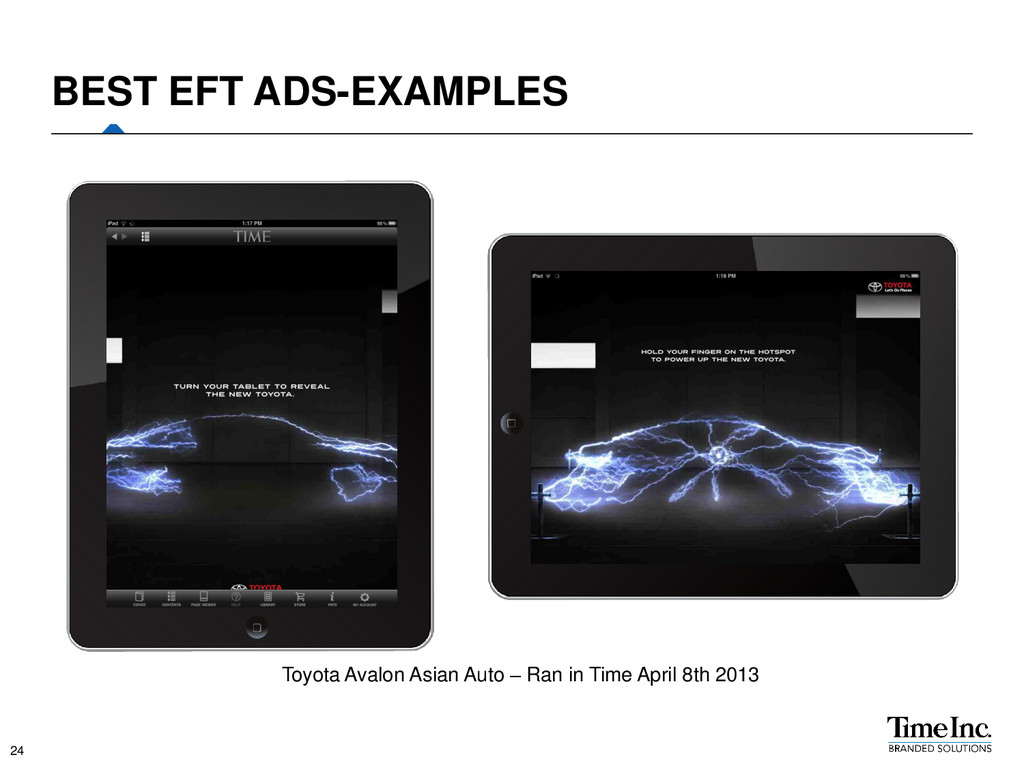
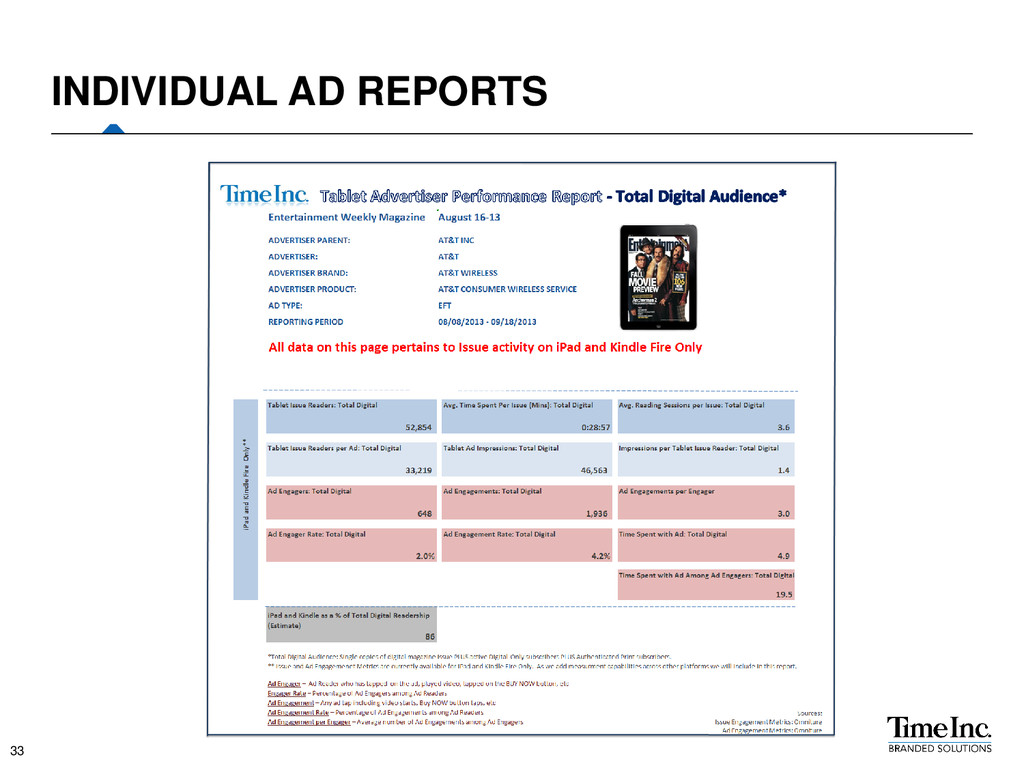
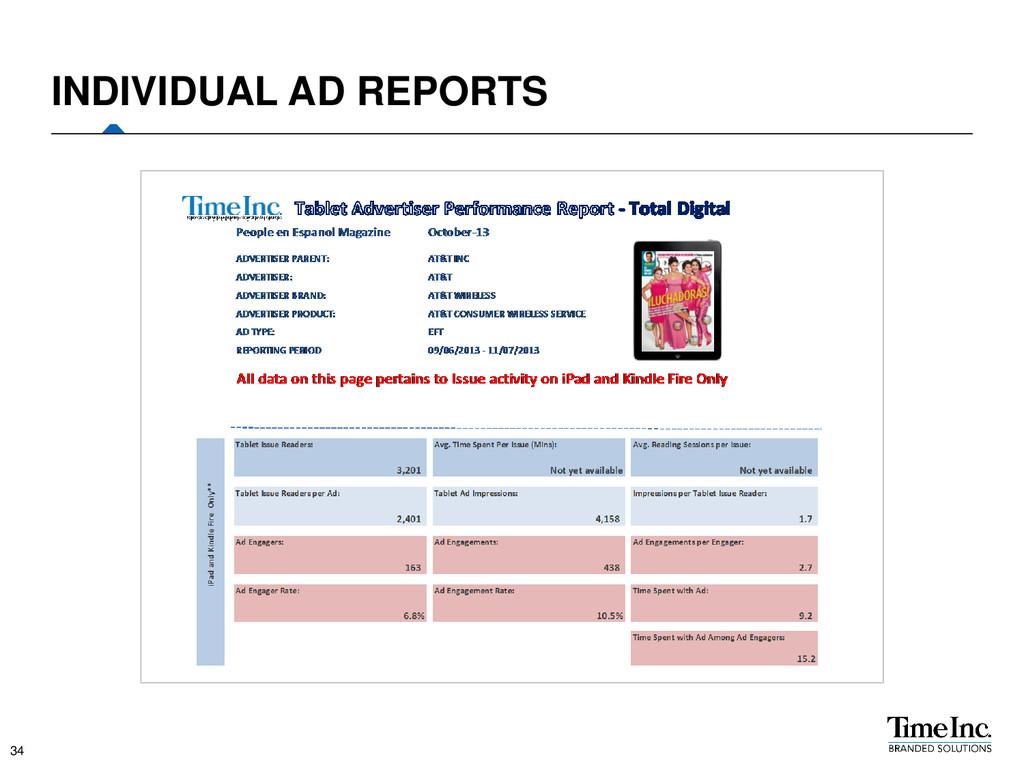
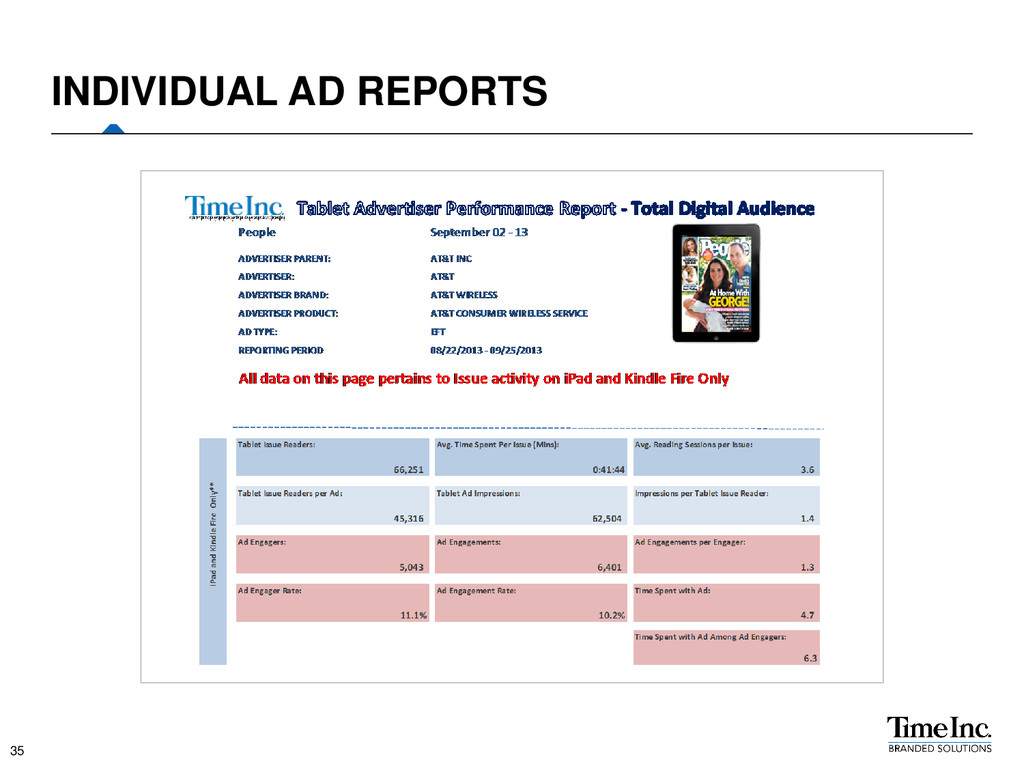
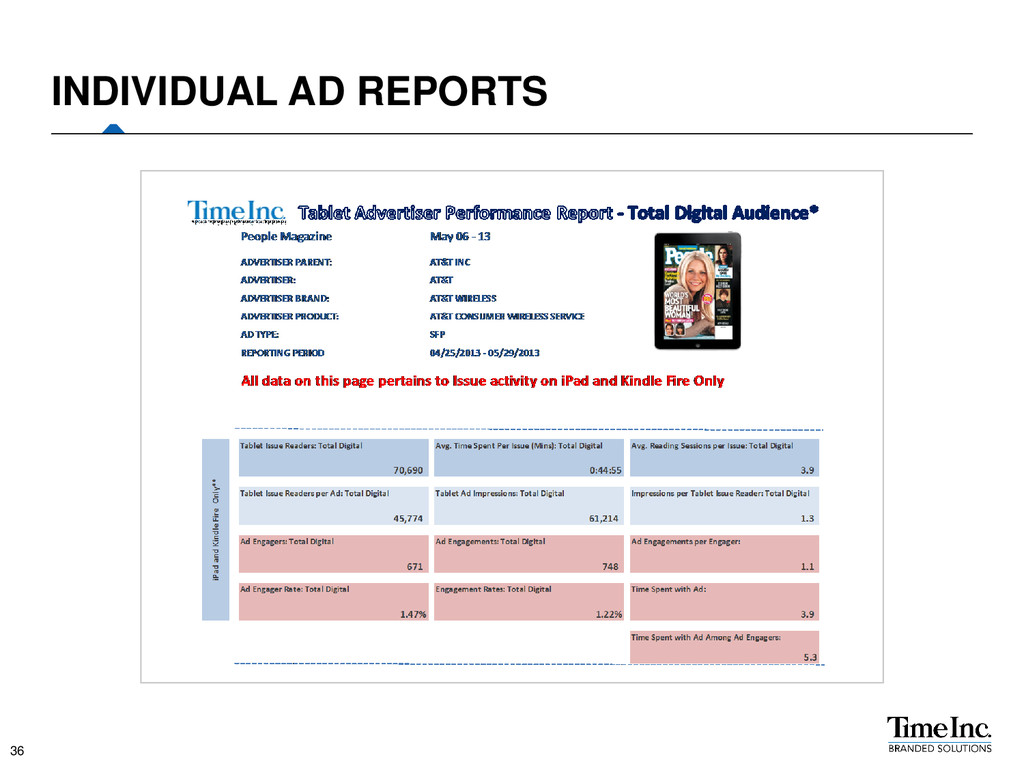
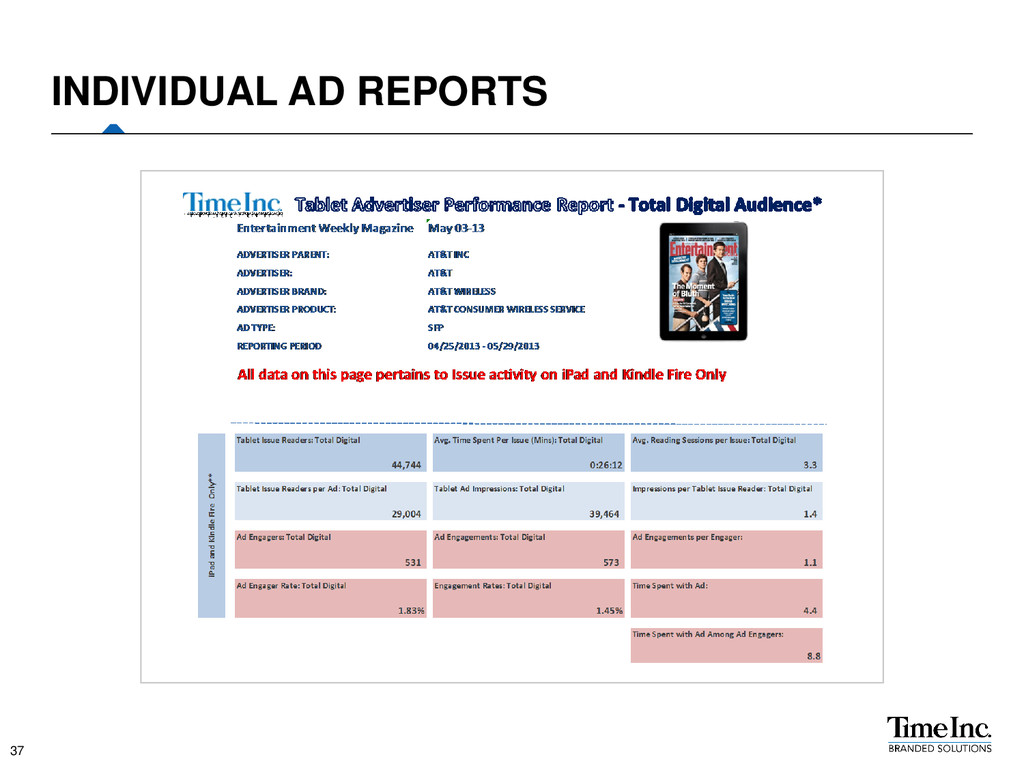
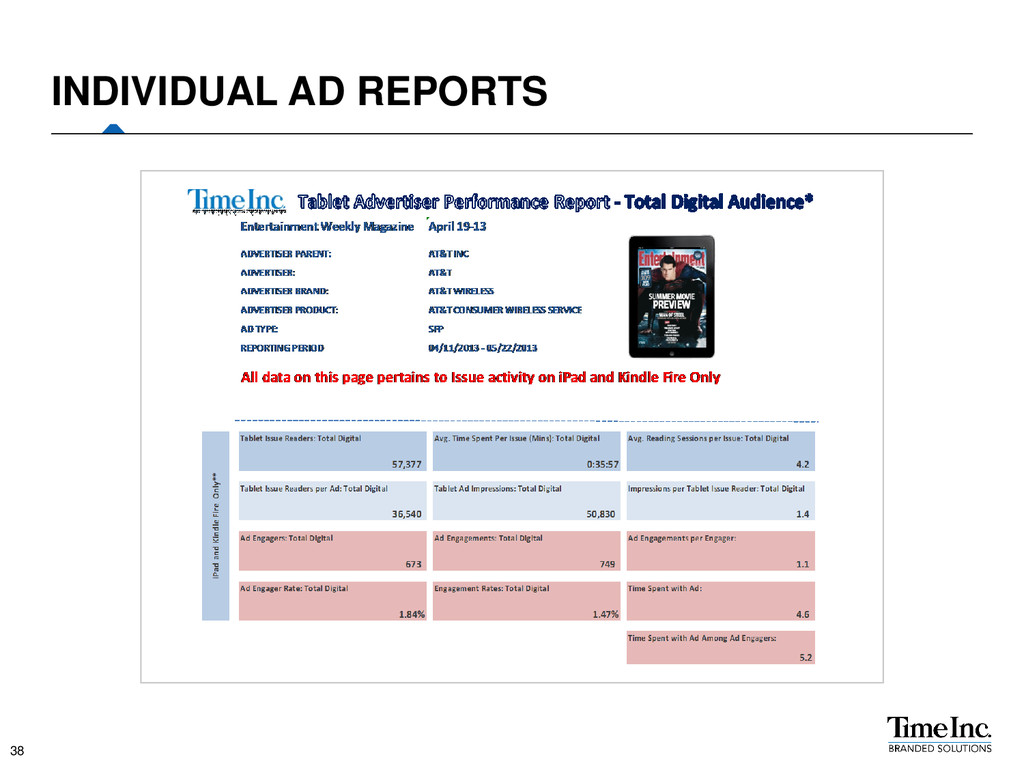
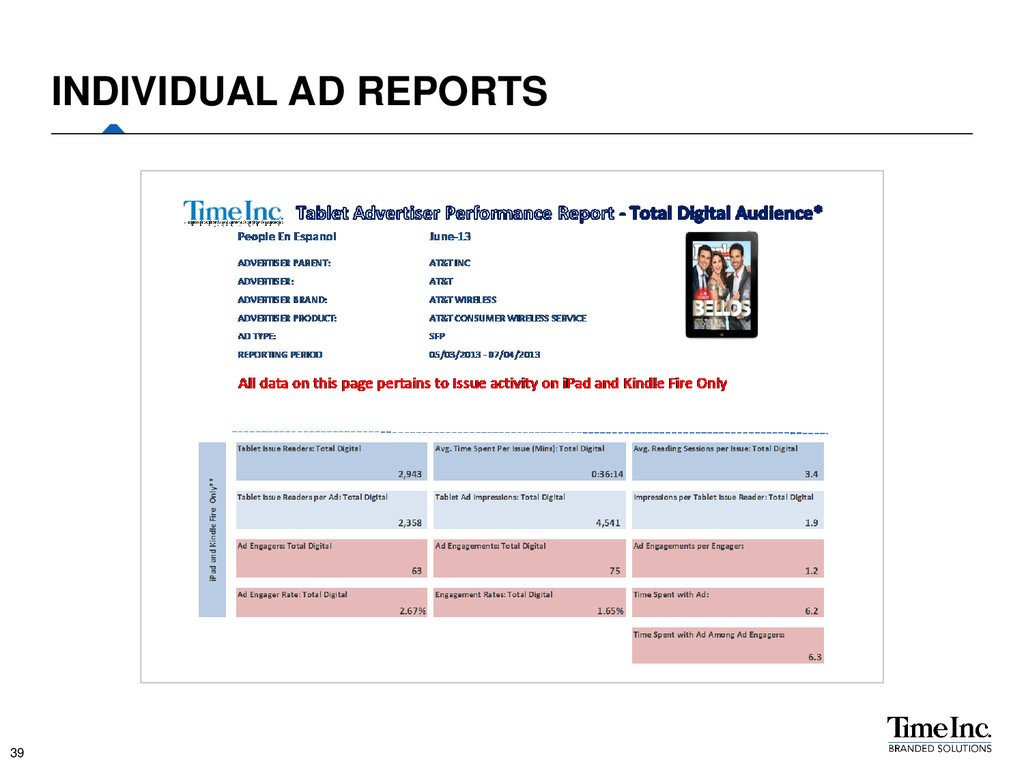
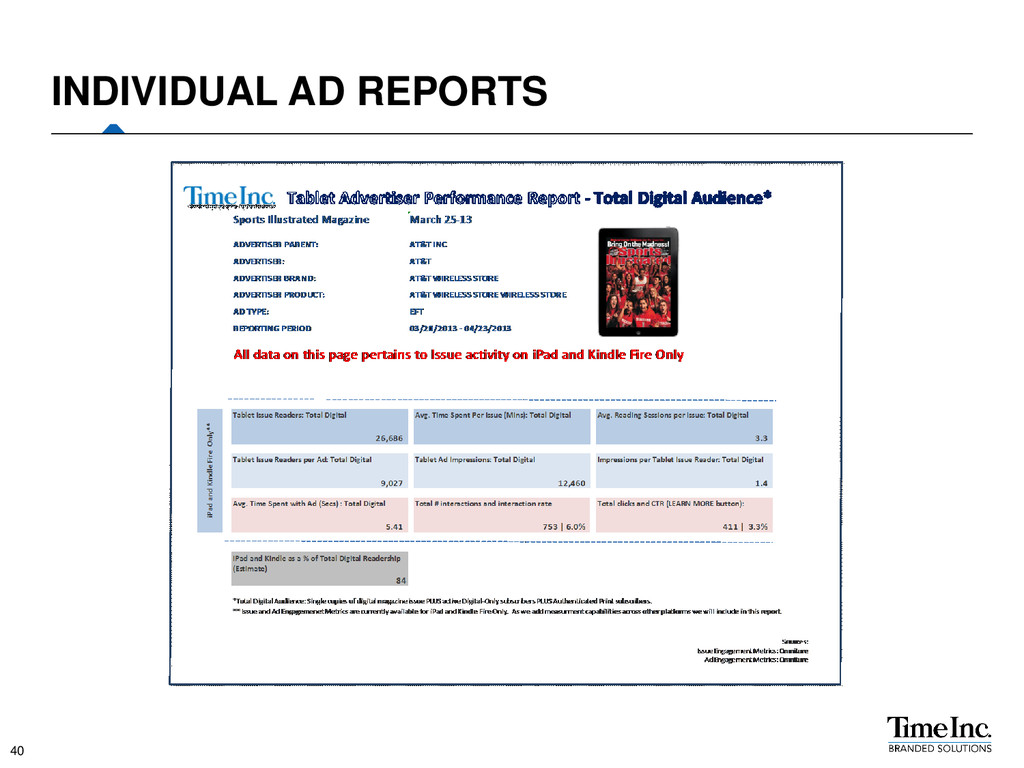
driven by difference in • Creative • Hot Spot Area • Location in the book • Time of the year (spring, early summer versus late summer, fall) • Issue topics • Articles next to ads WORD OF CAUTION… 6
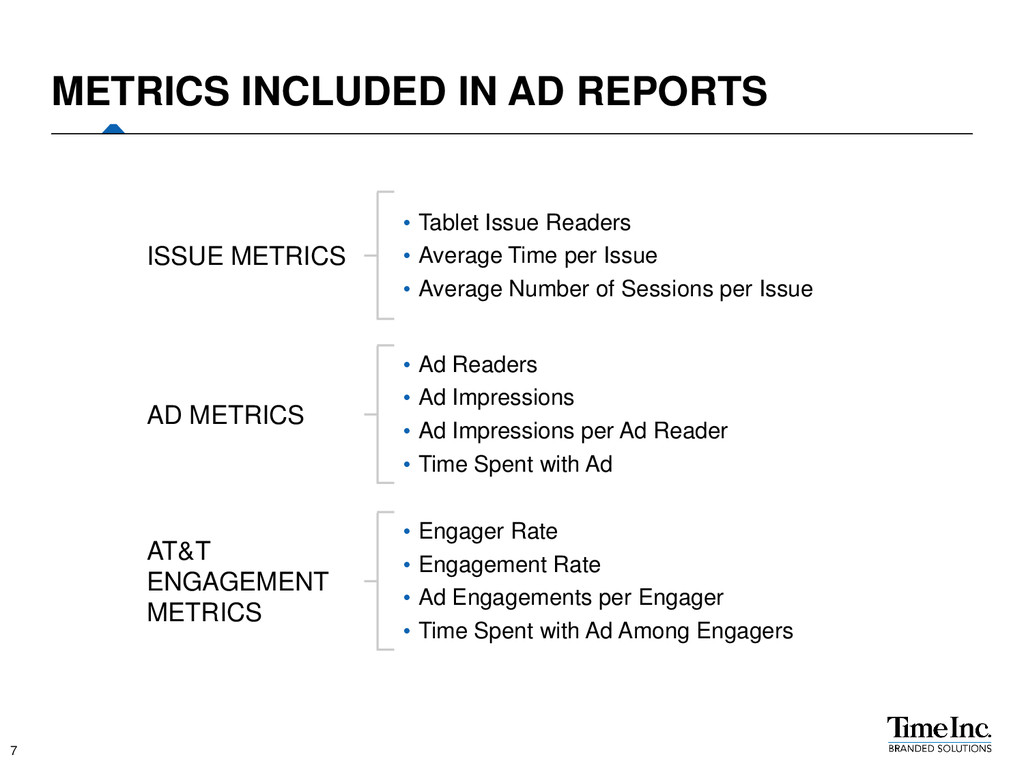
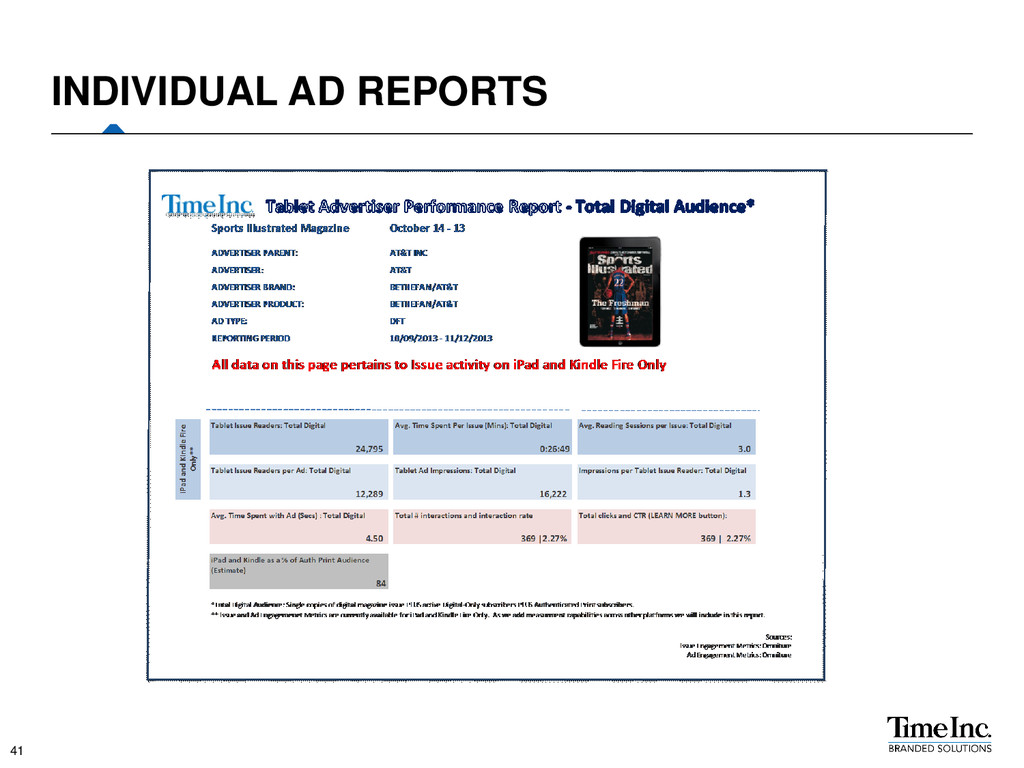
Engager • Time Spent with Ad Among Engagers ISSUE METRICS AD METRICS AT&T ENGAGEMENT METRICS METRICS INCLUDED IN AD REPORTS • Tablet Issue Readers • Average Time per Issue • Average Number of Sessions per Issue • Ad Readers • Ad Impressions • Ad Impressions per Ad Reader • Time Spent with Ad 7
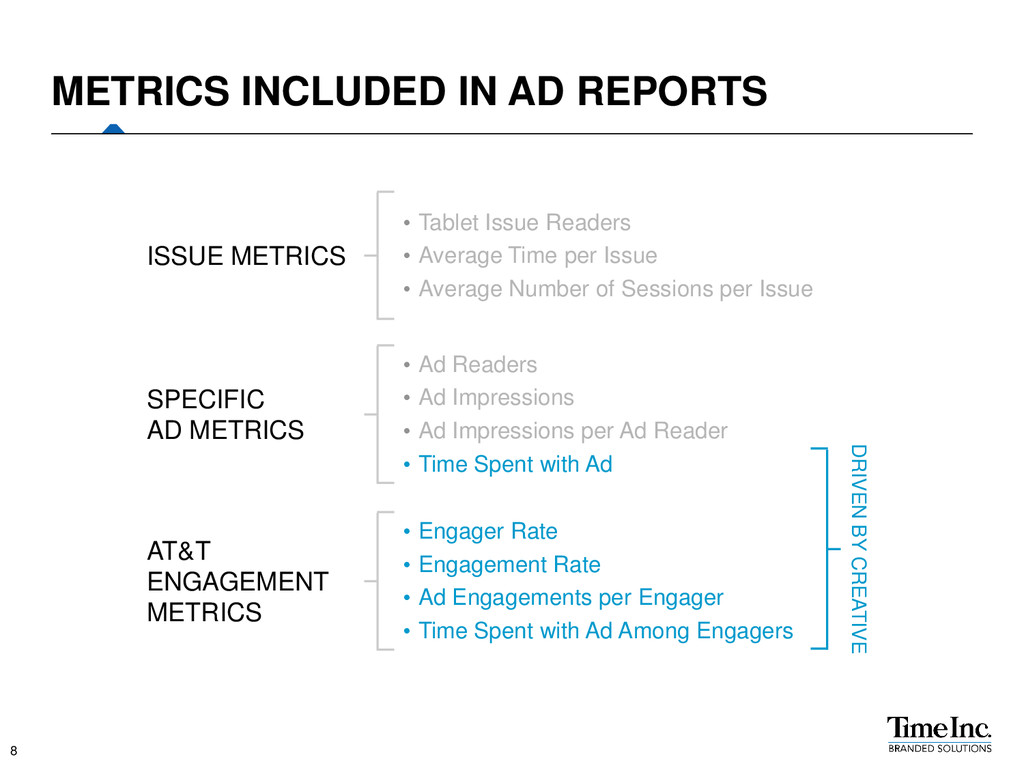
Engager • Time Spent with Ad Among Engagers ISSUE METRICS SPECIFIC AD METRICS AT&T ENGAGEMENT METRICS METRICS INCLUDED IN AD REPORTS • Tablet Issue Readers • Average Time per Issue • Average Number of Sessions per Issue • Ad Readers • Ad Impressions • Ad Impressions per Ad Reader • Time Spent with Ad DRIVEN BY CREATIVE 8
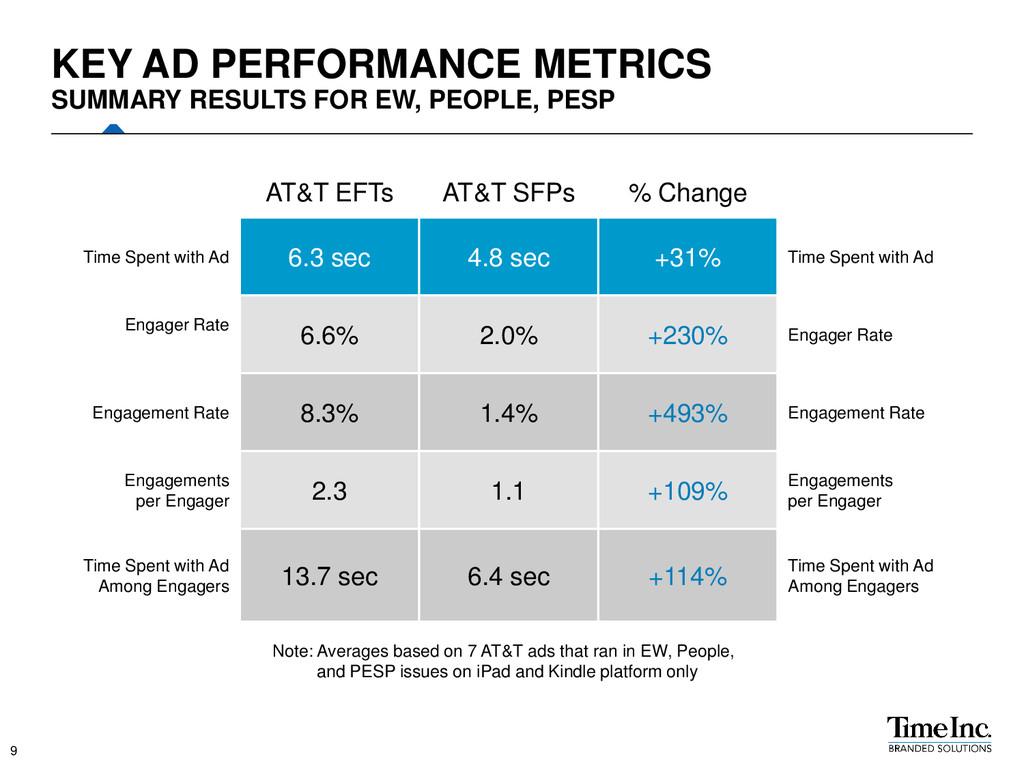
6.3 sec 4.8 sec +31% Time Spent with Ad Engager Rate 6.6% 2.0% +230% Engager Rate Engagement Rate 8.3% 1.4% +493% Engagement Rate Engagements per Engager 2.3 1.1 +109% Engagements per Engager Time Spent with Ad Among Engagers 13.7 sec 6.4 sec +114% Time Spent with Ad Among Engagers Note: Averages based on 7 AT&T ads that ran in EW, People, and PESP issues on iPad and Kindle platform only KEY AD PERFORMANCE METRICS SUMMARY RESULTS FOR EW, PEOPLE, PESP 9
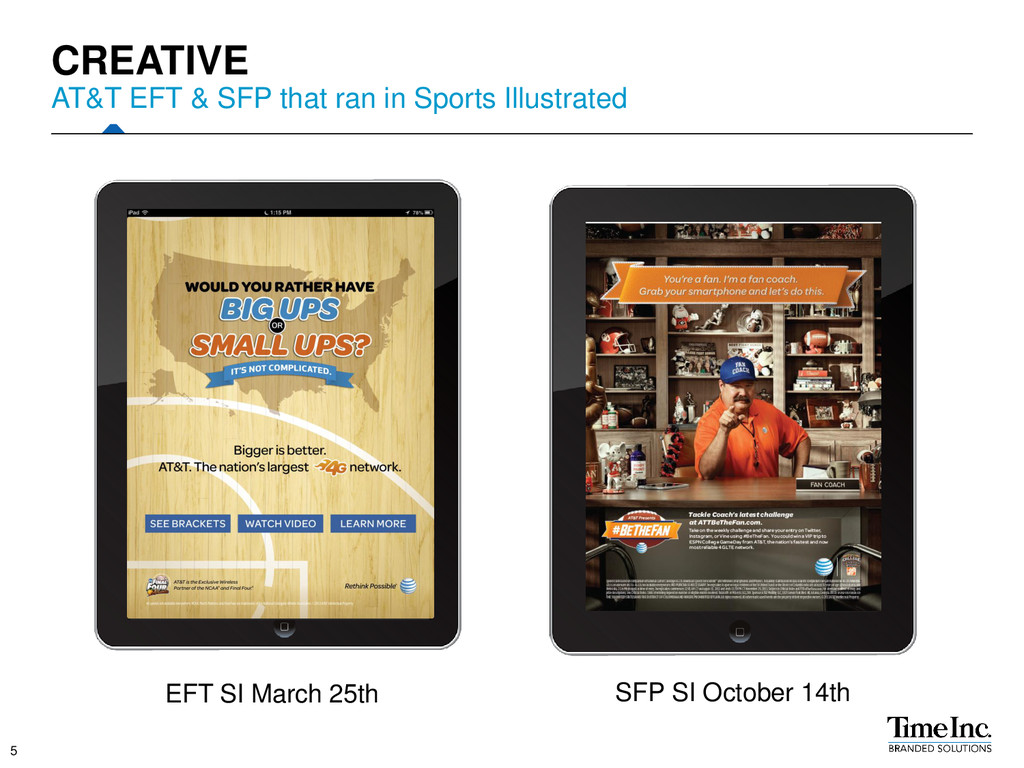
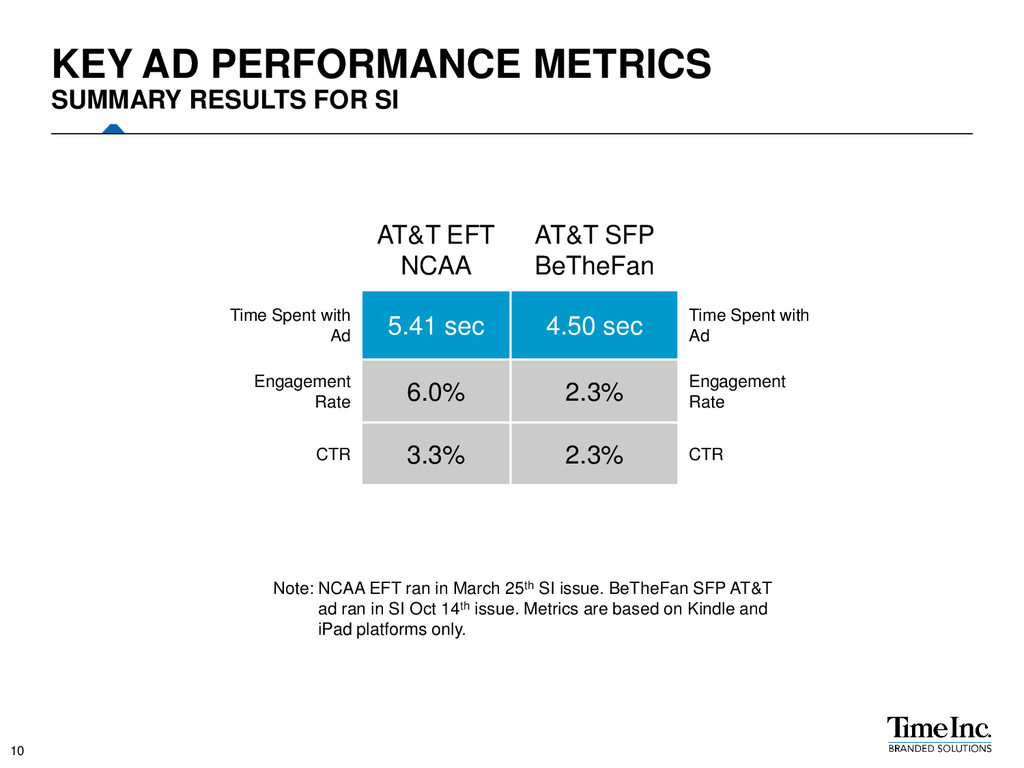
5.41 sec 4.50 sec Time Spent with Ad Engagement Rate 6.0% 2.3% Engagement Rate CTR 3.3% 2.3% CTR Note: NCAA EFT ran in March 25th SI issue. BeTheFan SFP AT&T ad ran in SI Oct 14th issue. Metrics are based on Kindle and iPad platforms only. KEY AD PERFORMANCE METRICS SUMMARY RESULTS FOR SI 10
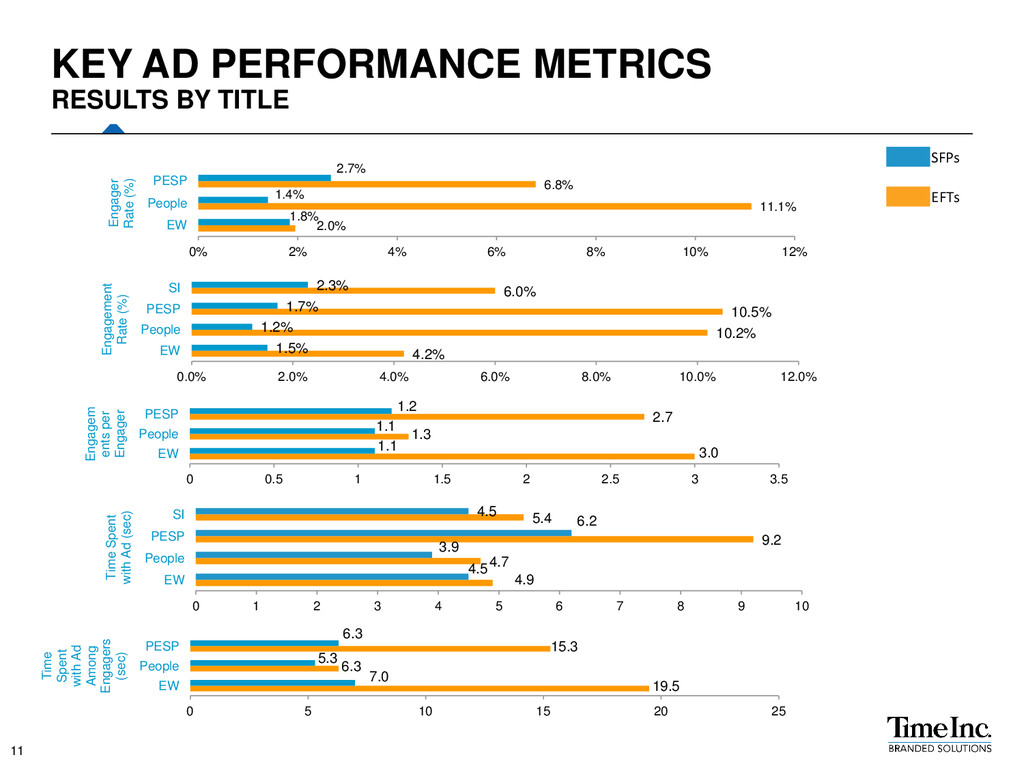
2 2.5 3 3.5 EW People PESP Engagem ents per Engager 19.5 6.3 15.3 7.0 5.3 6.3 0 5 10 15 20 25 EW People PESP Time Spent with Ad Among Engagers (sec) KEY AD PERFORMANCE METRICS RESULTS BY TITLE 2.0% 11.1% 6.8% 1.8% 1.4% 2.7% 0% 2% 4% 6% 8% 10% 12% EW People PESP Engager Rate (%) SFPs EFTs 11 4.2% 10.2% 10.5% 6.0% 1.5% 1.2% 1.7% 2.3% 0.0% 2.0% 4.0% 6.0% 8.0% 10.0% 12.0% EW People PESP SI Engagement Rate (%) 4.9 4.7 9.2 5.4 4.5 3.9 6.2 4.5 0 1 2 3 4 5 6 7 8 9 10 EW People PESP SI Time Spent with Ad (sec)
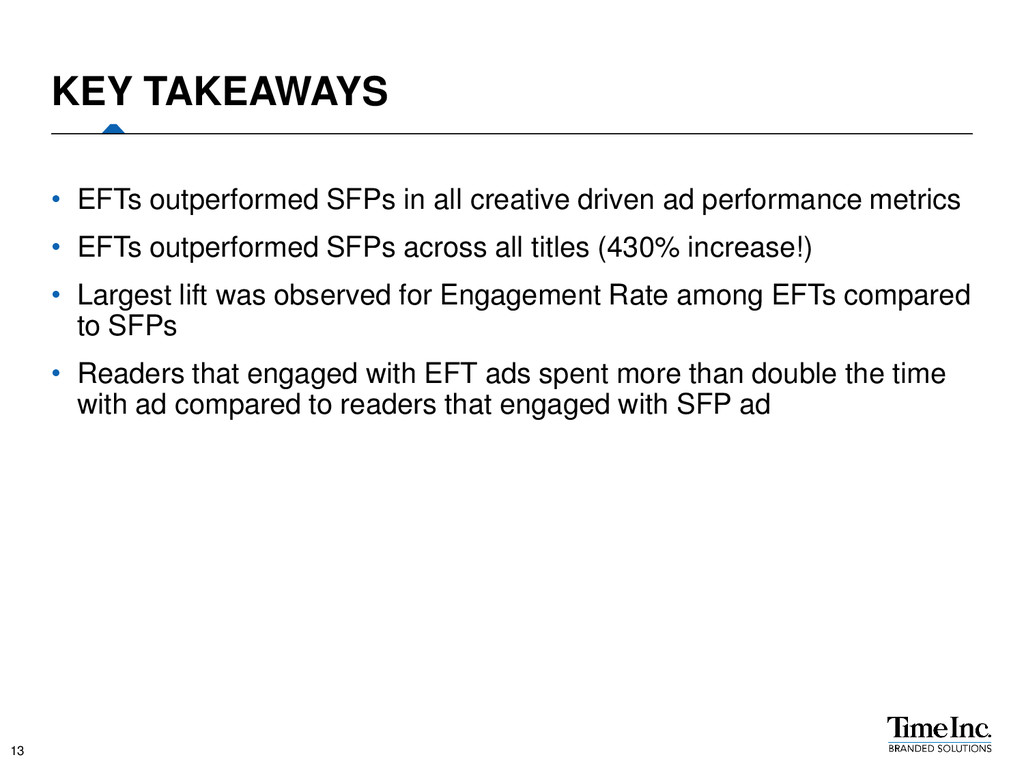
metrics • EFTs outperformed SFPs across all titles (430% increase!) • Largest lift was observed for Engagement Rate among EFTs compared to SFPs • Readers that engaged with EFT ads spent more than double the time with ad compared to readers that engaged with SFP ad KEY TAKEAWAYS 13
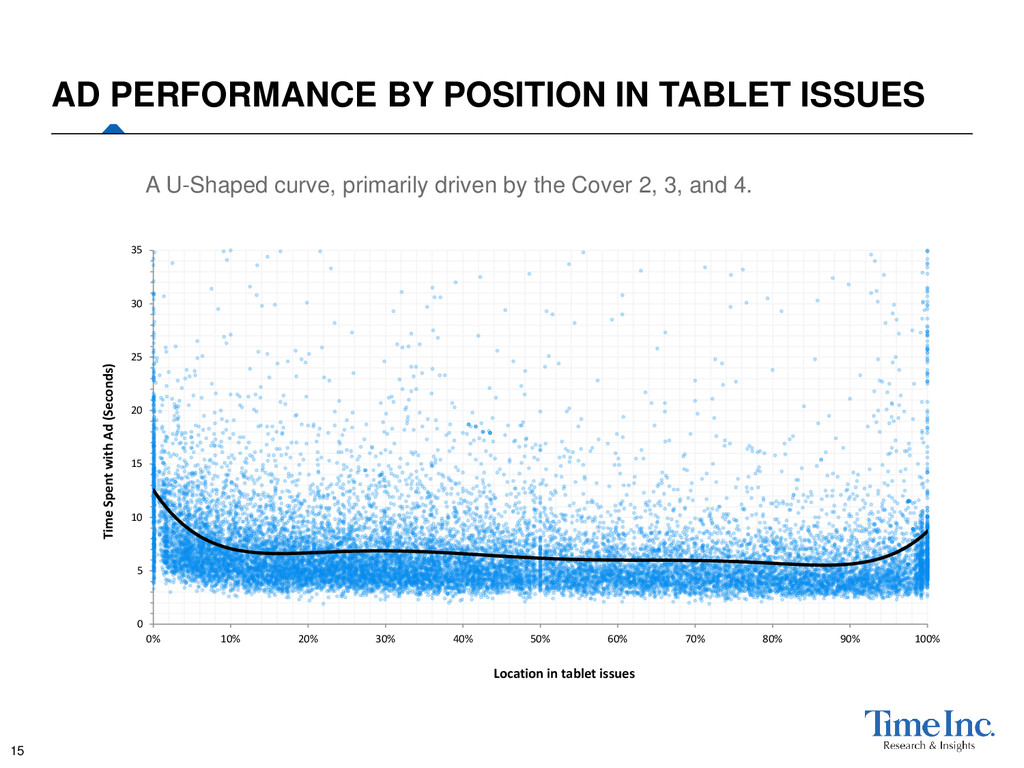
20% 30% 40% 50% 60% 70% 80% 90% 100% Time Spent with Ad (Seconds) Location in tablet issues AD PERFORMANCE BY POSITION IN TABLET ISSUES A U-Shaped curve, primarily driven by the Cover 2, 3, and 4. 15
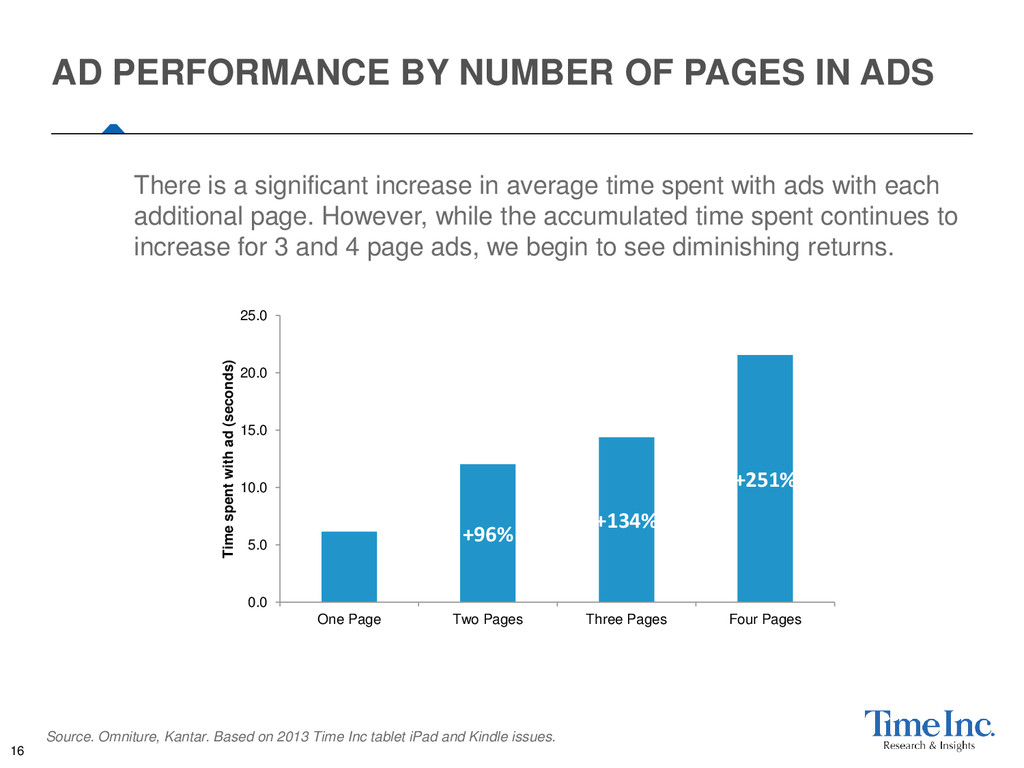
+251% 0.0 5.0 10.0 15.0 20.0 25.0 One Page Two Pages Three Pages Four Pages Time spent with ad (seconds) There is a significant increase in average time spent with ads with each additional page. However, while the accumulated time spent continues to increase for 3 and 4 page ads, we begin to see diminishing returns. Source. Omniture, Kantar. Based on 2013 Time Inc tablet iPad and Kindle issues. 16
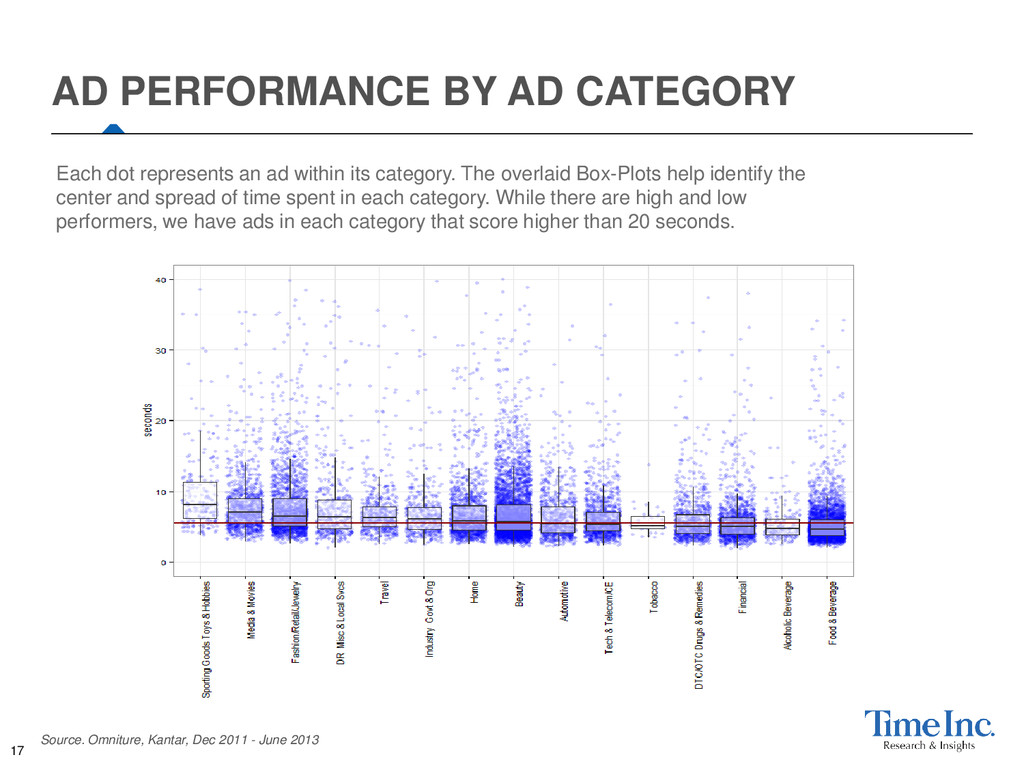
within its category. The overlaid Box-Plots help identify the center and spread of time spent in each category. While there are high and low performers, we have ads in each category that score higher than 20 seconds. Source. Omniture, Kantar, Dec 2011 - June 2013 17
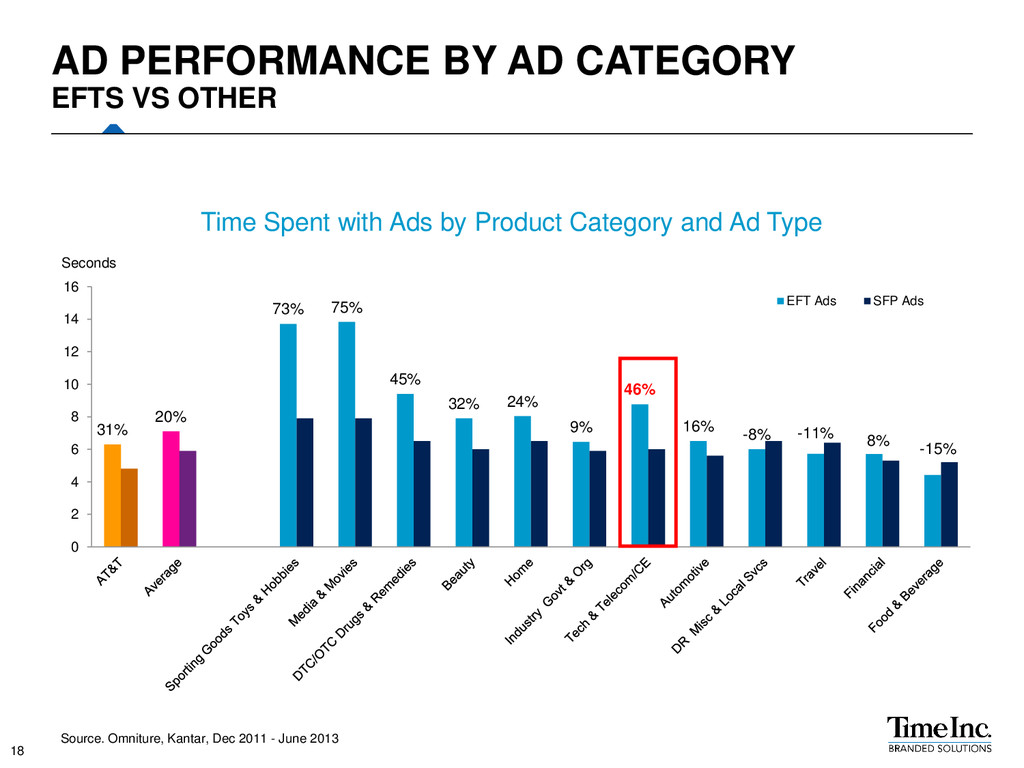
20% 73% 75% 45% 32% 24% 9% 46% 16% -8% -11% 8% -15% 0 2 4 6 8 10 12 14 16 Time Spent with Ads by Product Category and Ad Type EFT Ads SFP Ads AD PERFORMANCE BY AD CATEGORY EFTS VS OTHER 18
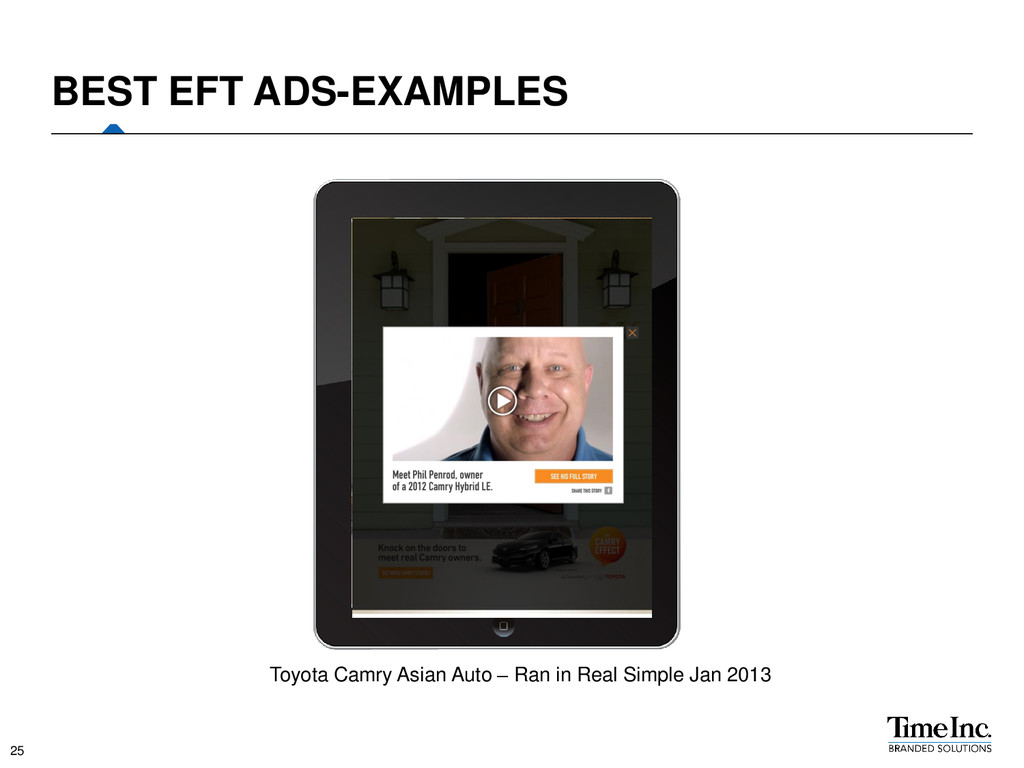
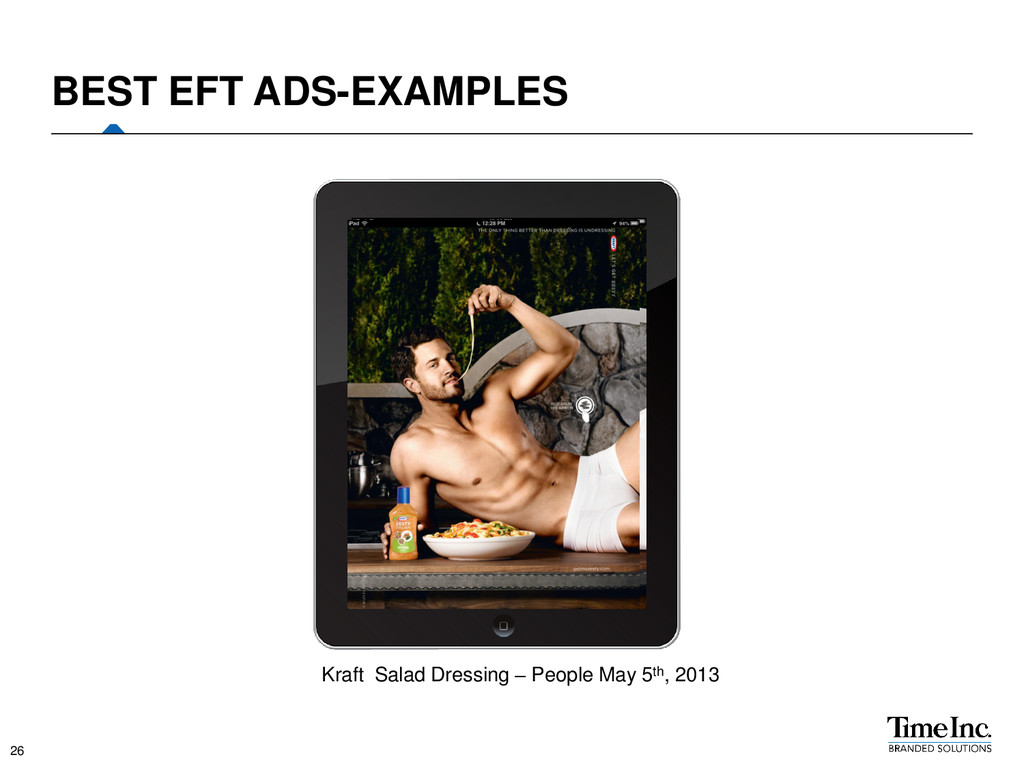
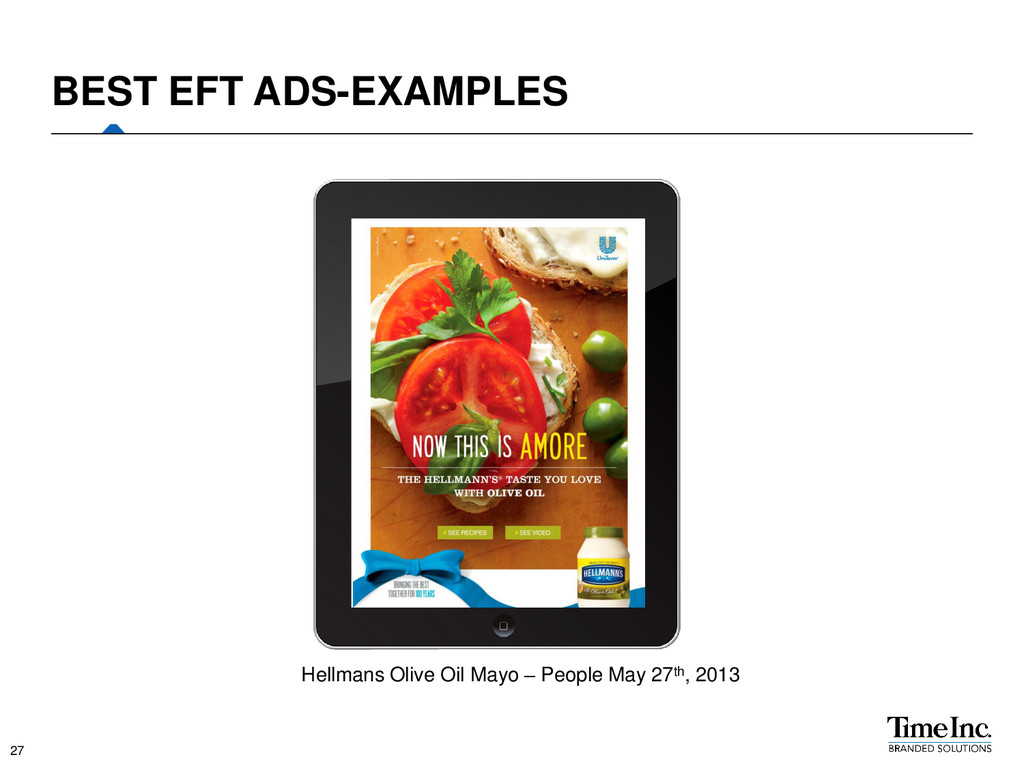
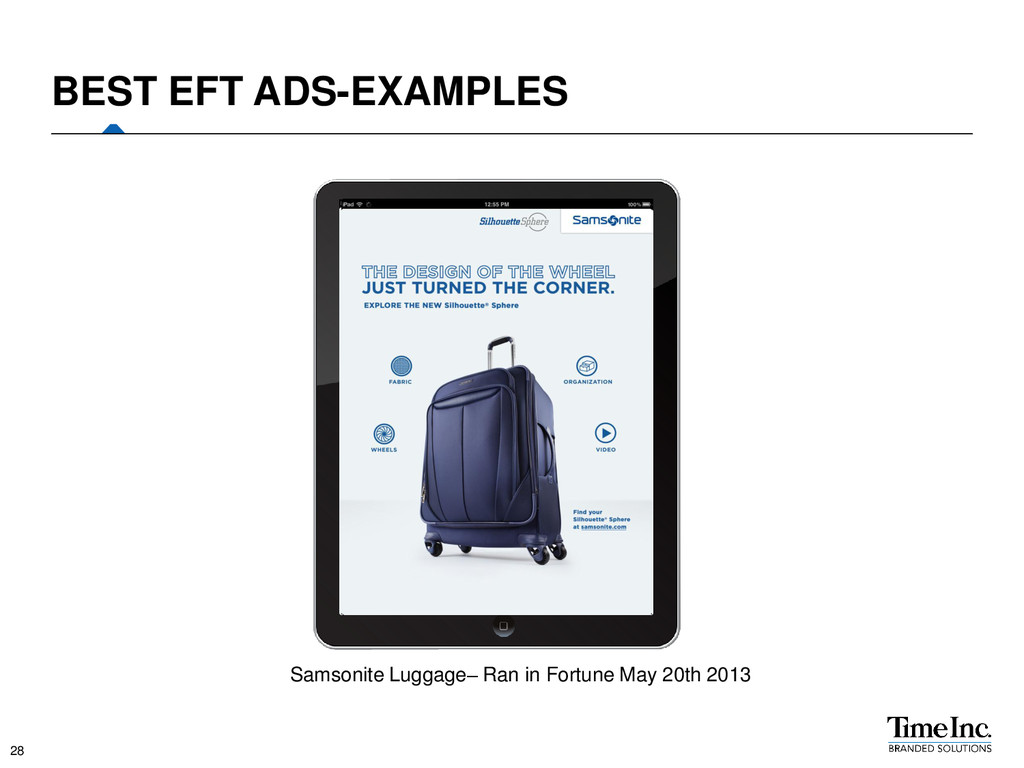
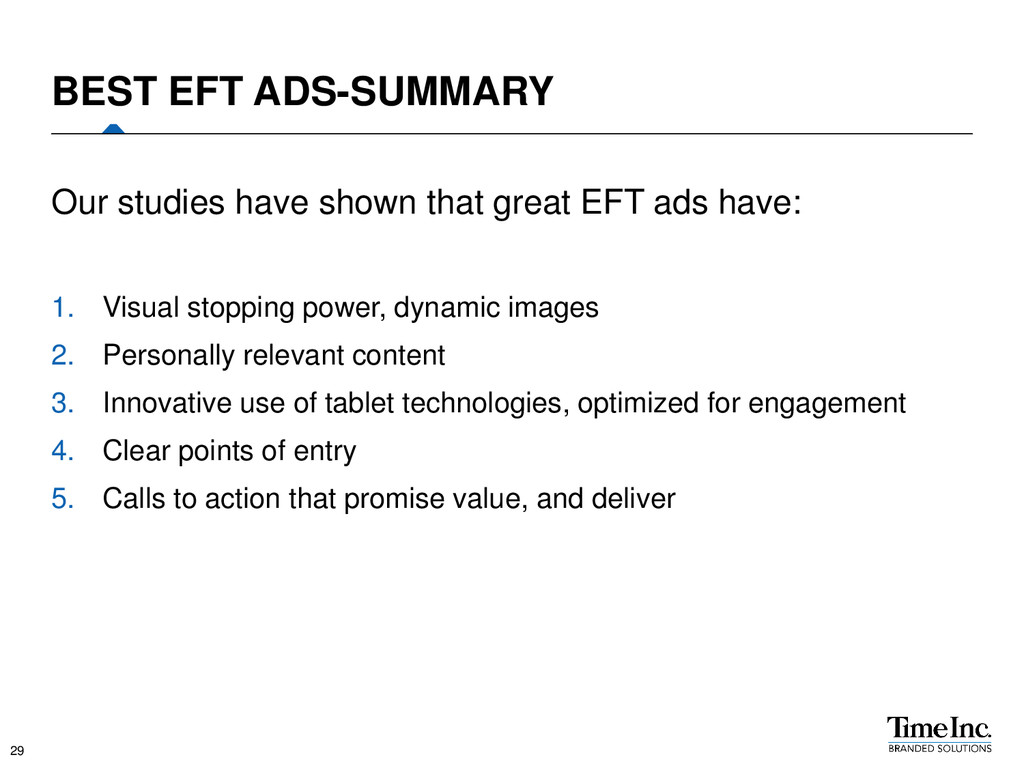
Visual stopping power, dynamic images 2. Personally relevant content 3. Innovative use of tablet technologies, optimized for engagement 4. Clear points of entry 5. Calls to action that promise value, and deliver BEST EFT ADS-SUMMARY 29
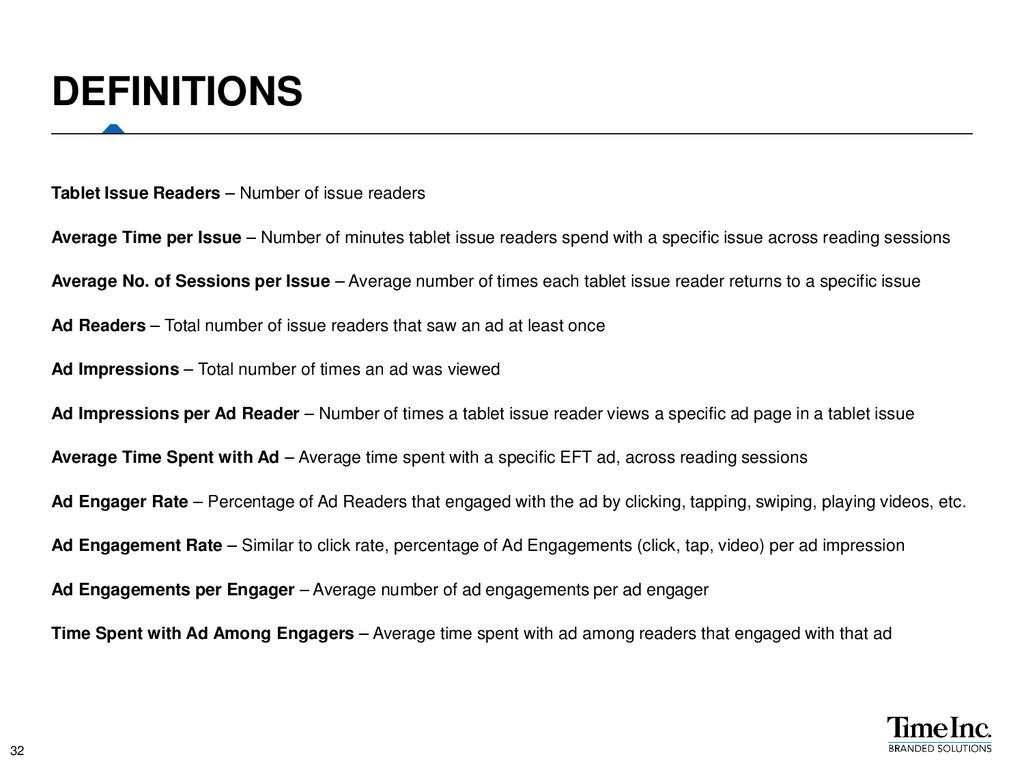
per Issue – Number of minutes tablet issue readers spend with a specific issue across reading sessions Average No. of Sessions per Issue – Average number of times each tablet issue reader returns to a specific issue Ad Readers – Total number of issue readers that saw an ad at least once Ad Impressions – Total number of times an ad was viewed Ad Impressions per Ad Reader – Number of times a tablet issue reader views a specific ad page in a tablet issue Average Time Spent with Ad – Average time spent with a specific EFT ad, across reading sessions Ad Engager Rate – Percentage of Ad Readers that engaged with the ad by clicking, tapping, swiping, playing videos, etc. Ad Engagement Rate – Similar to click rate, percentage of Ad Engagements (click, tap, video) per ad impression Ad Engagements per Engager – Average number of ad engagements per ad engager Time Spent with Ad Among Engagers – Average time spent with ad among readers that engaged with that ad DEFINITIONS 32
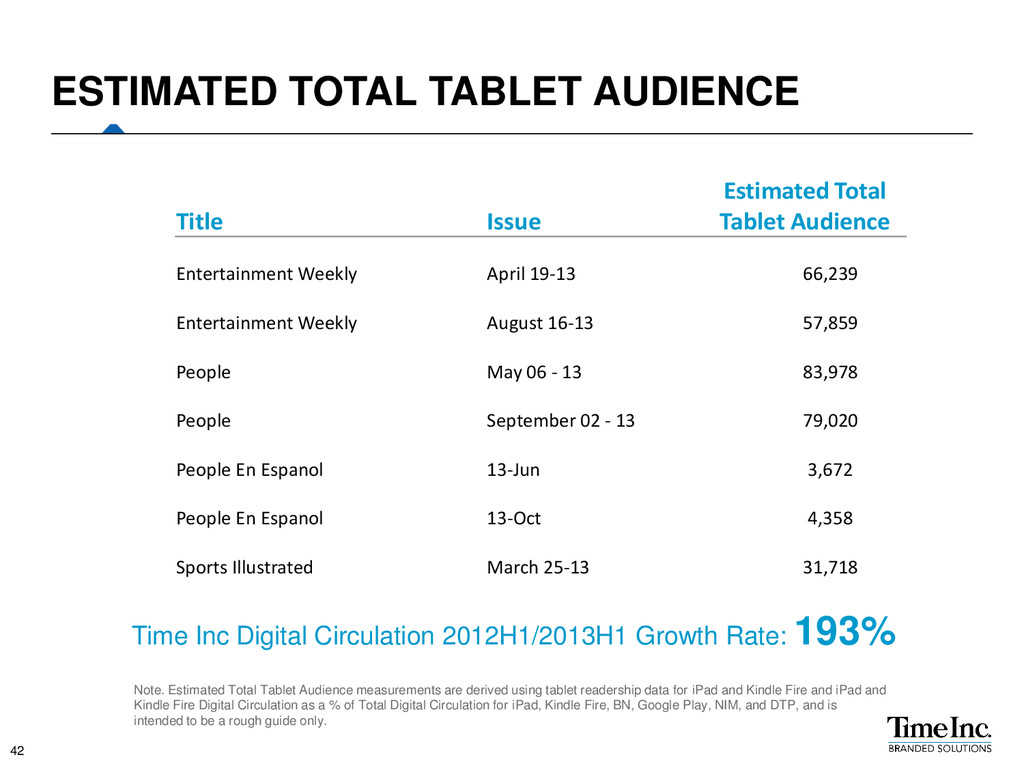
Audience Entertainment Weekly April 19-13 66,239 Entertainment Weekly August 16-13 57,859 People May 06 - 13 83,978 People September 02 - 13 79,020 People En Espanol 13-Jun 3,672 People En Espanol 13-Oct 4,358 Sports Illustrated March 25-13 31,718 Note. Estimated Total Tablet Audience measurements are derived using tablet readership data for iPad and Kindle Fire and iPad and Kindle Fire Digital Circulation as a % of Total Digital Circulation for iPad, Kindle Fire, BN, Google Play, NIM, and DTP, and is intended to be a rough guide only. Time Inc Digital Circulation 2012H1/2013H1 Growth Rate: 193%


 rkendrick25
 davetheseo
 nwiizo
 gr2m
 maggiecrowley
 smashingmag
 pwiseman
 axbom
 honzajavorek
 panda_program
 chrislema
 aleyda