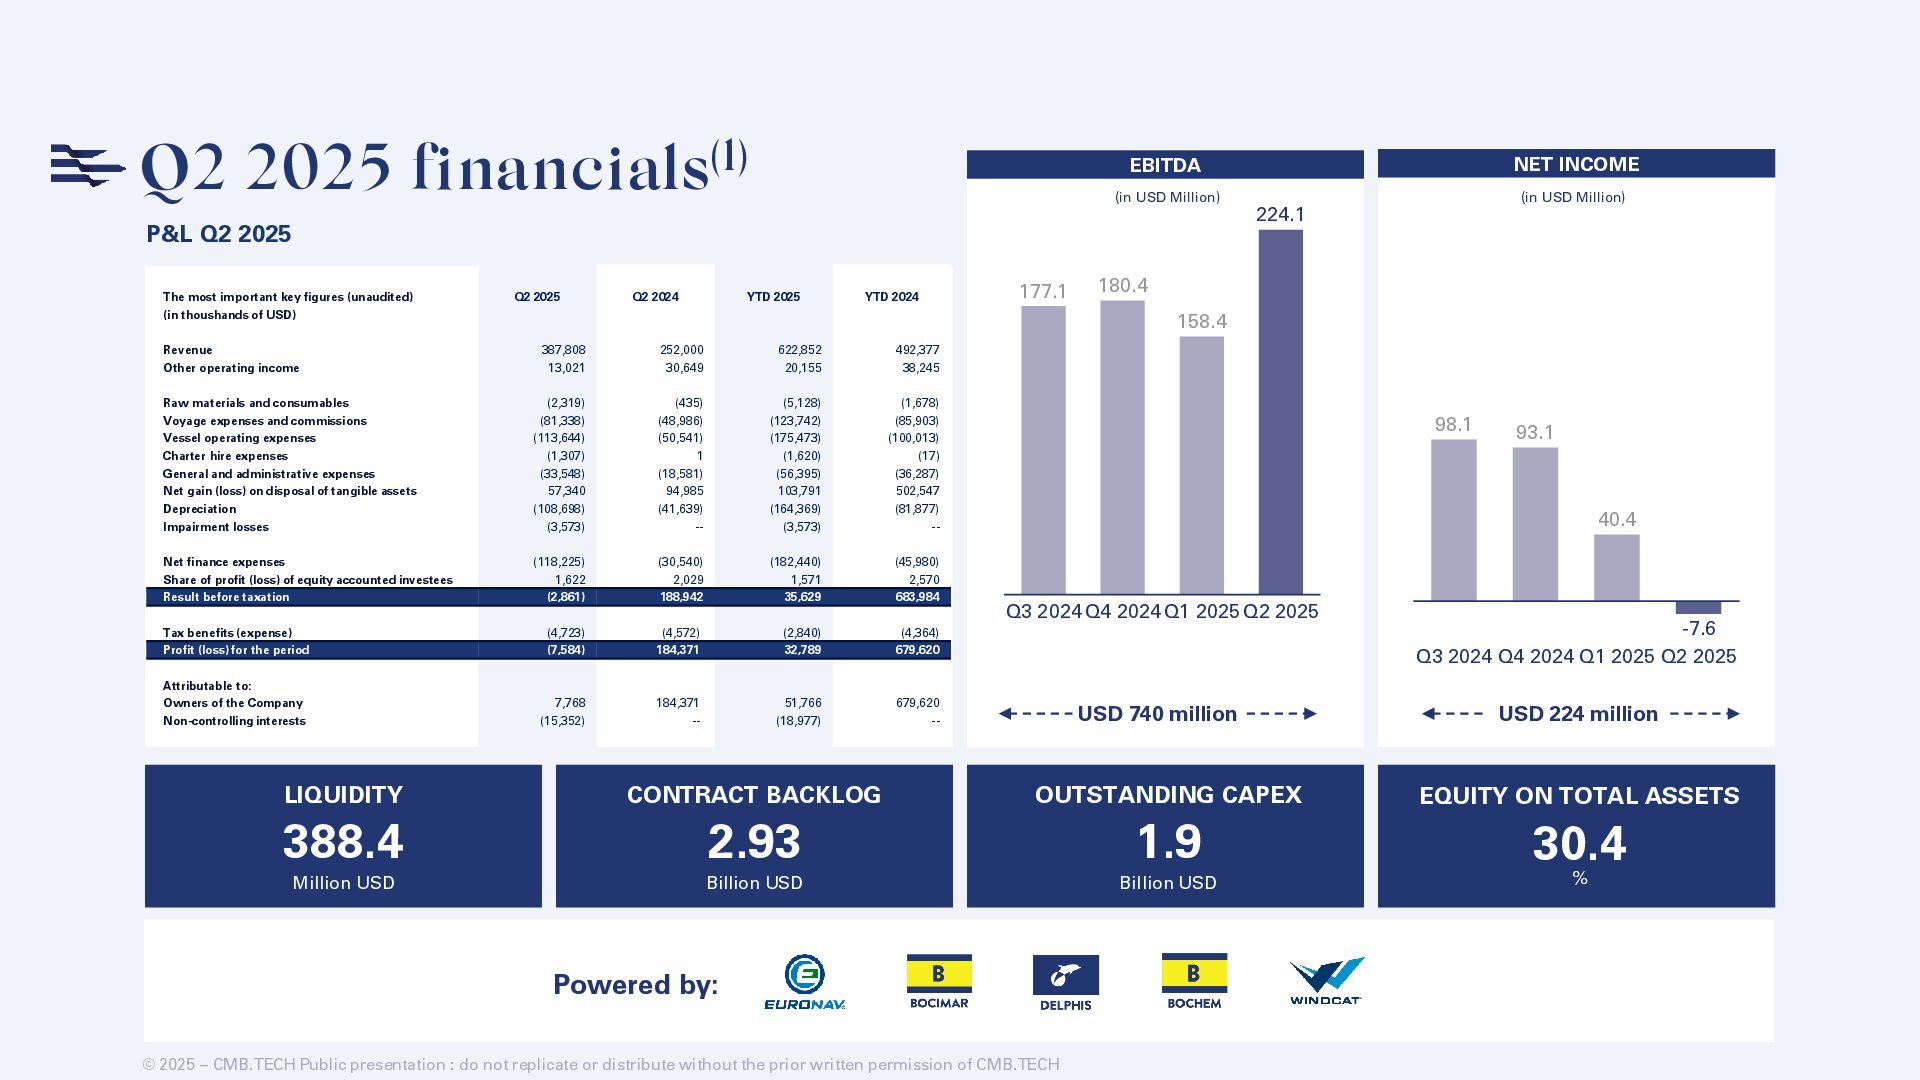
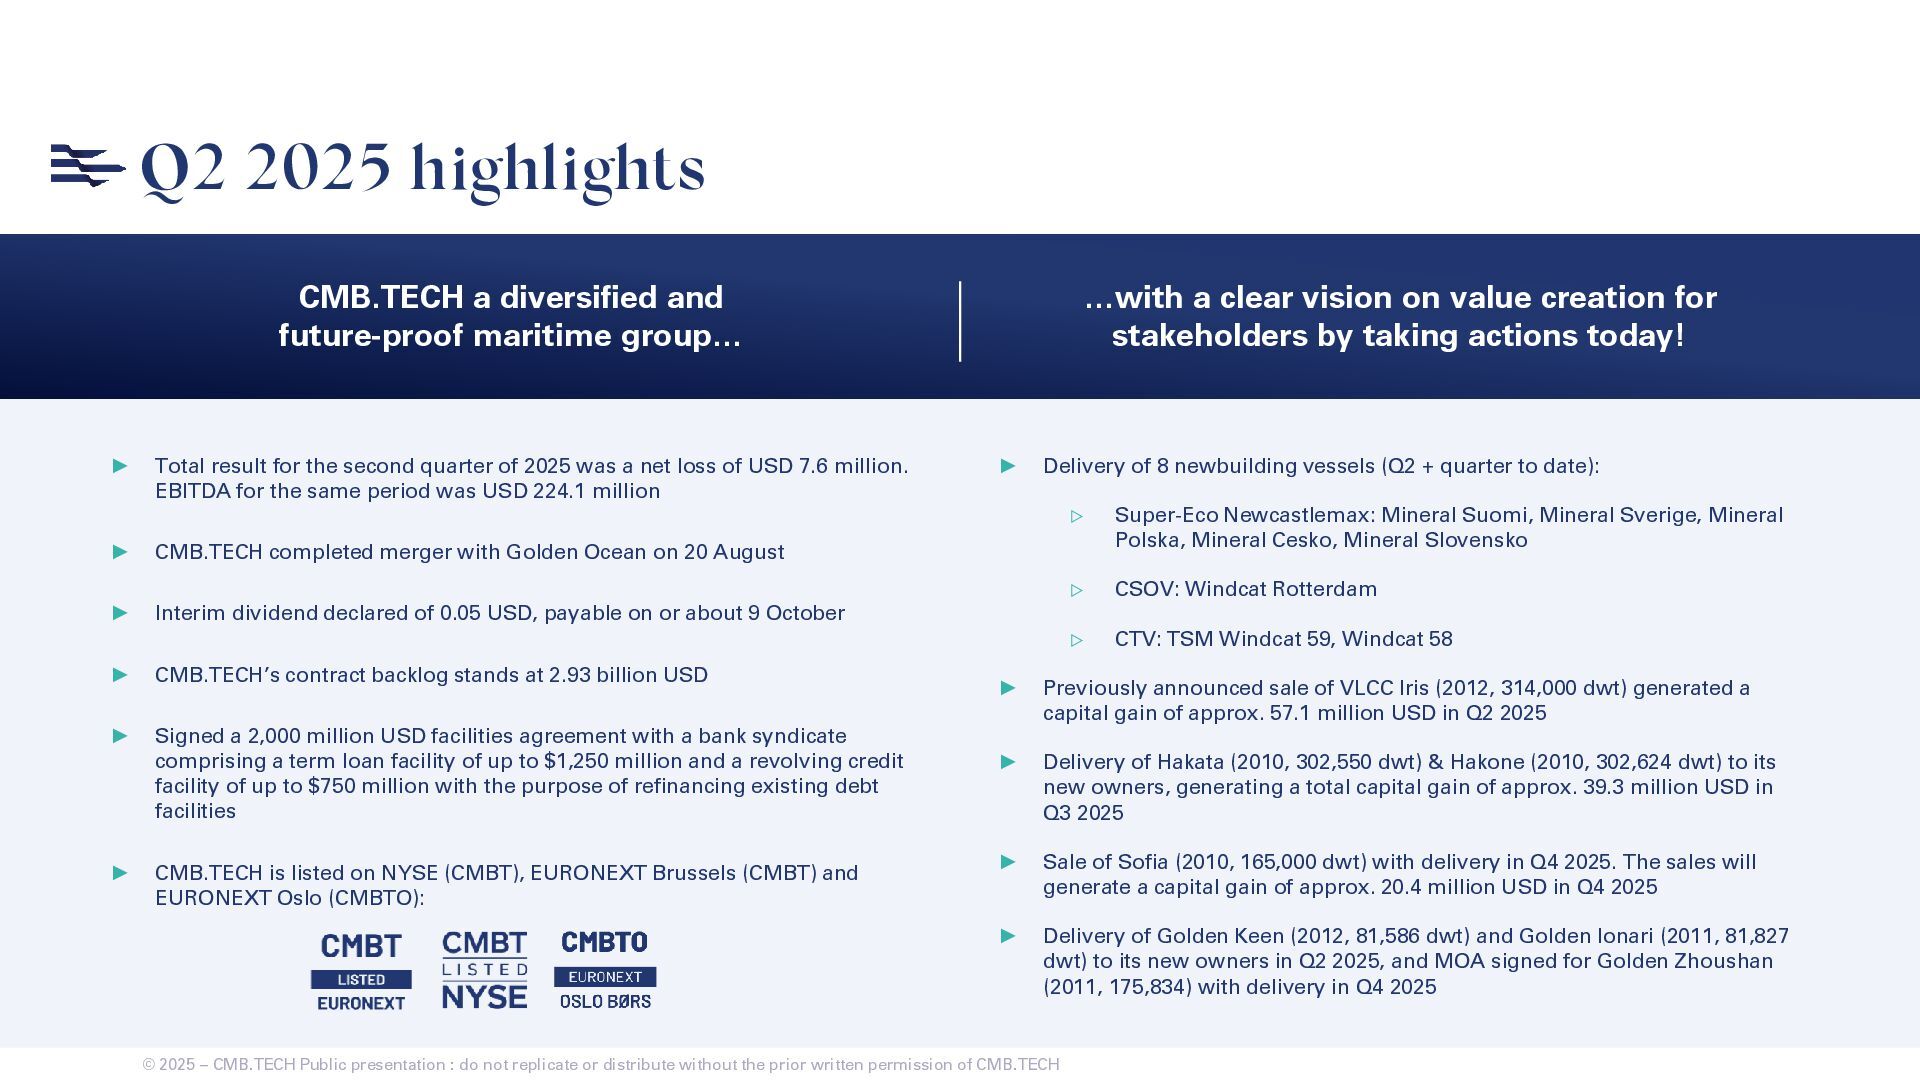
2025 Q2 2025 177.1 180.4 158.4 224.1 Q3 2024 Q4 2024 Q1 2025 Q2 2025 98.1 93.1 40.4 -7.6 USD 740 million USD 224 million (in USD Million) (in USD Million) LIQUIDITY 388.4 Million USD CONTRACT BACKLOG 2.93 Billion USD OUTSTANDING CAPEX 1.9 Billion USD EQUITY ON TOTAL ASSETS 30.4 % Powered by: © 2025 – CMB.TECH Public presentation : do not replicate or distribute without the prior written permission of CMB.TECH The most important key figures (unaudited) Q2 2025 Q2 2024 YTD 2025 YTD 2024 (in thoushands of USD) Revenue 387,808 252,000 622,852 492,377 Other operating income 13,021 30,649 20,155 38,245 Raw materials and consumables (2,319) (435) (5,128) (1,678) Voyage expenses and commissions (81,338) (48,986) (123,742) (85,903) Vessel operating expenses (113,644) (50,541) (175,473) (100,013) Charter hire expenses (1,307) 1 (1,620) (17) General and administrative expenses (33,548) (18,581) (56,395) (36,287) Net gain (loss) on disposal of tangible assets 57,340 94,985 103,791 502,547 Depreciation (108,698) (41,639) (164,369) (81,877) Impairment losses (3,573) -- (3,573) -- Net finance expenses (118,225) (30,540) (182,440) (45,980) Share of profit (loss) of equity accounted investees 1,622 2,029 1,571 2,570 Result before taxation (2,861) 188,942 35,629 683,984 Tax benefits (expense) (4,723) (4,572) (2,840) (4,364) Profit (loss) for the period (7,584) 184,371 32,789 679,620 Attributable to: Owners of the Company 7,768 184,371 51,766 679,620 Non-controlling interests (15,352) -- (18,977) -- P&L Q2 2025
![[email protected] +32 498 61 71 11 JORIS DAMAN HEAD OF](https://files.speakerdeck.com/presentations/40c09e9ff506435289c50dc493c11ff8/slide_38.jpg)