Talk I gave at NSDI 2015.
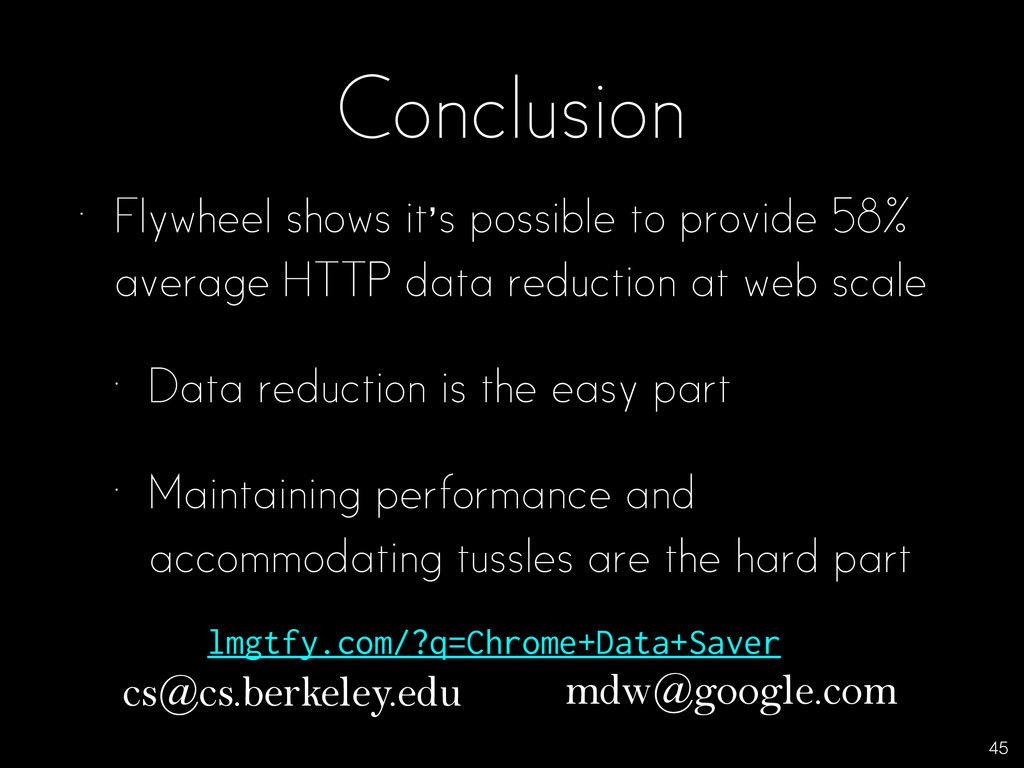
Paper: http://www.eecs.berkeley.edu/~rcs/research/nsdi15.pdf
Video [hopefully soon]: https://www.usenix.org/conference/nsdi15/technical-sessions/presentation/agababov
Keynote slides: http://www.eecs.berkeley.edu/~rcs/research/flywheel.key