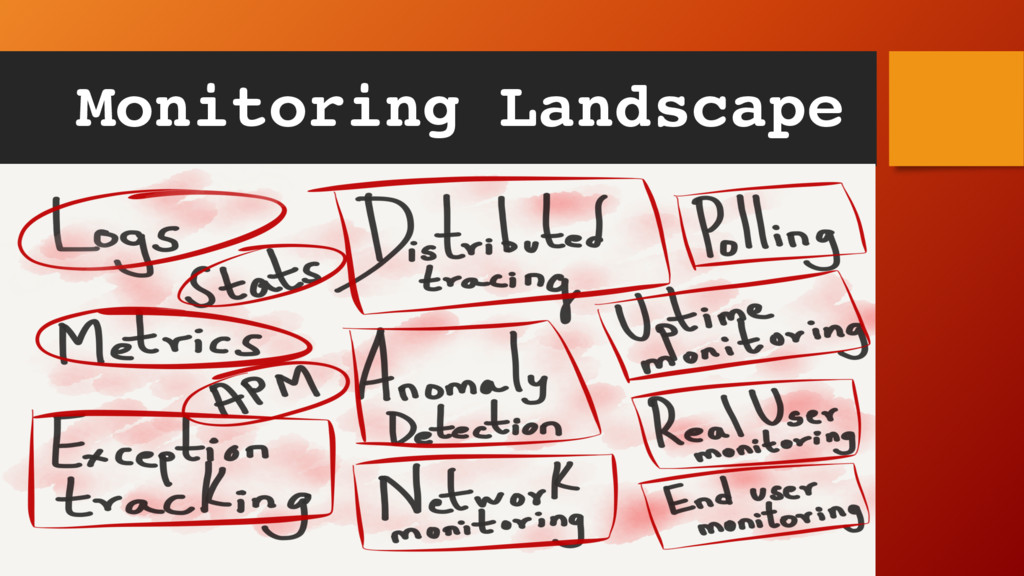
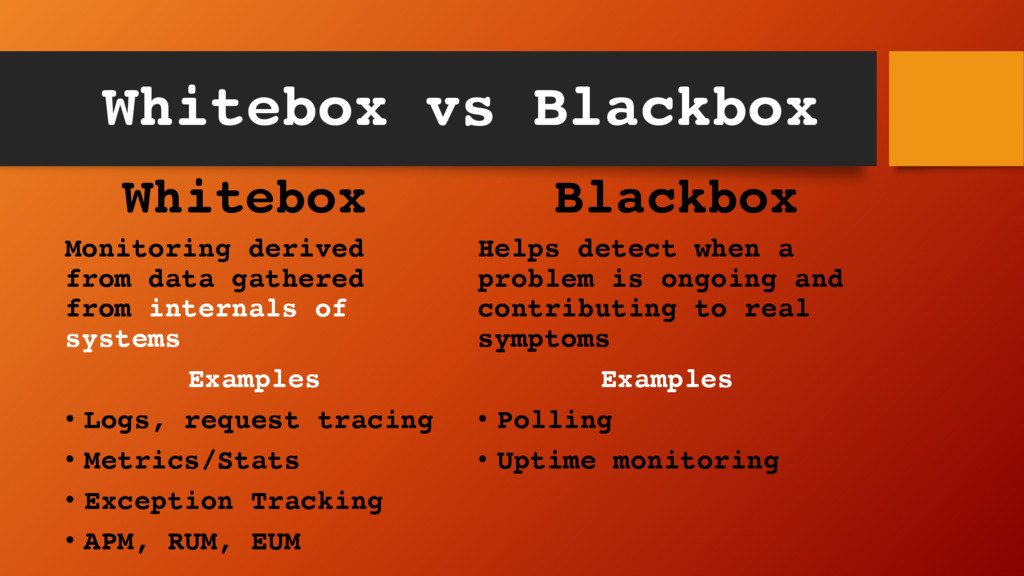
internals of systems Examples • Logs, request tracing • Metrics/Stats • Exception Tracking • APM, RUM, EUM Blackbox Helps detect when a problem is ongoing and contributing to real symptoms Examples • Polling • Uptime monitoring
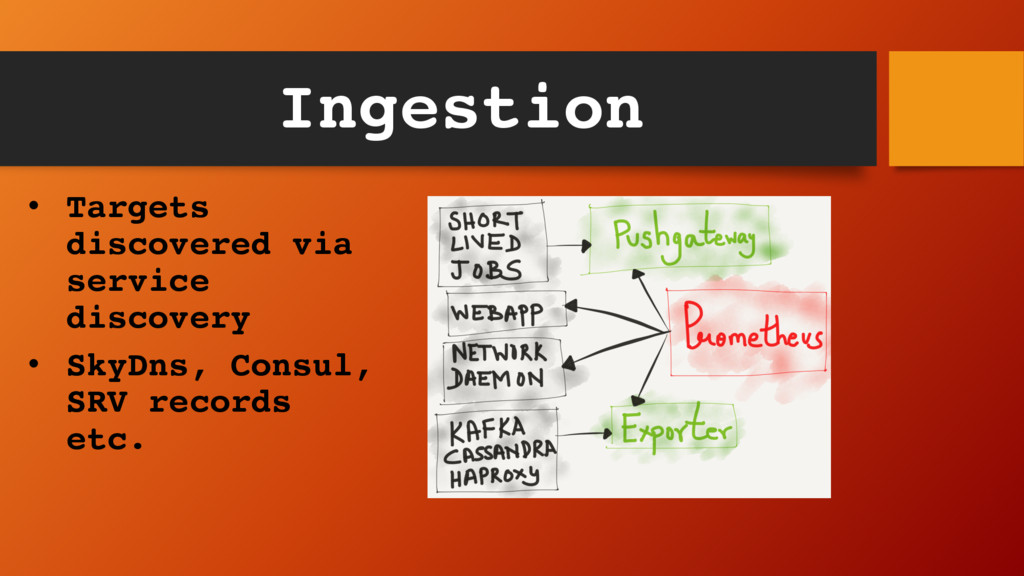
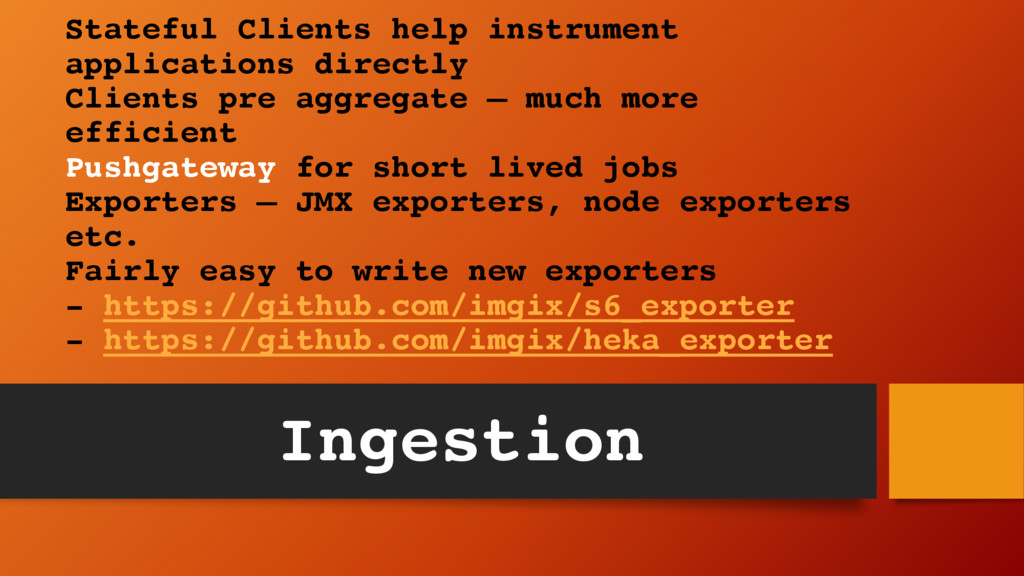
much more efficient Pushgateway for short lived jobs Exporters – JMX exporters, node exporters etc. Fairly easy to write new exporters - https://github.com/imgix/s6_exporter - https://github.com/imgix/heka_exporter Ingestion
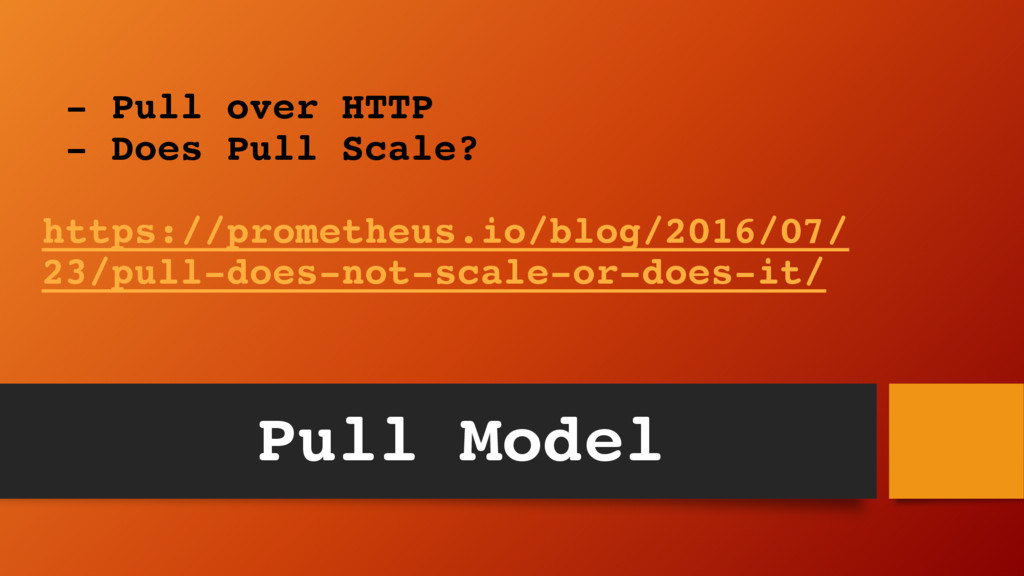
of gathering metrics - No need for app to register with a CP K/V store like ZooKeeper, Consul etc. - With polling know something is down with a failed scrape - Easier to configure/operate/scale Advantages of Pull
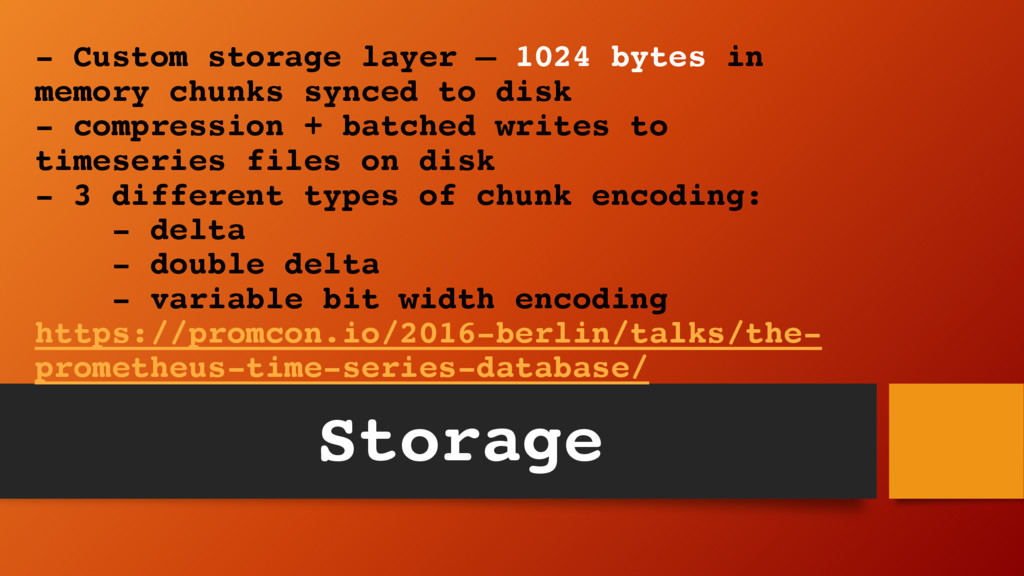
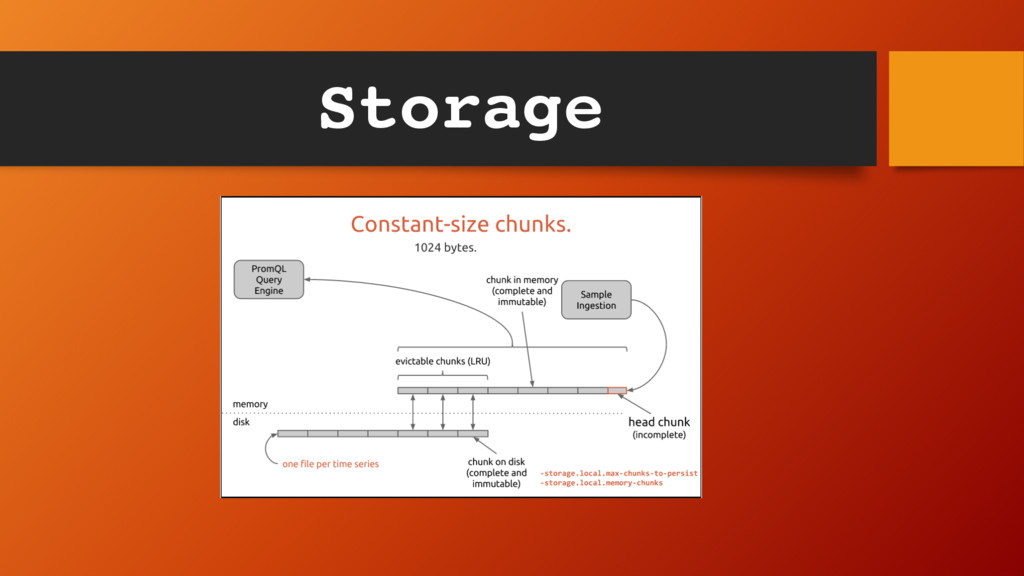
synced to disk - compression + batched writes to timeseries files on disk - 3 different types of chunk encoding: - delta - double delta - variable bit width encoding https://promcon.io/2016-berlin/talks/the- prometheus-time-series-database/ Storage
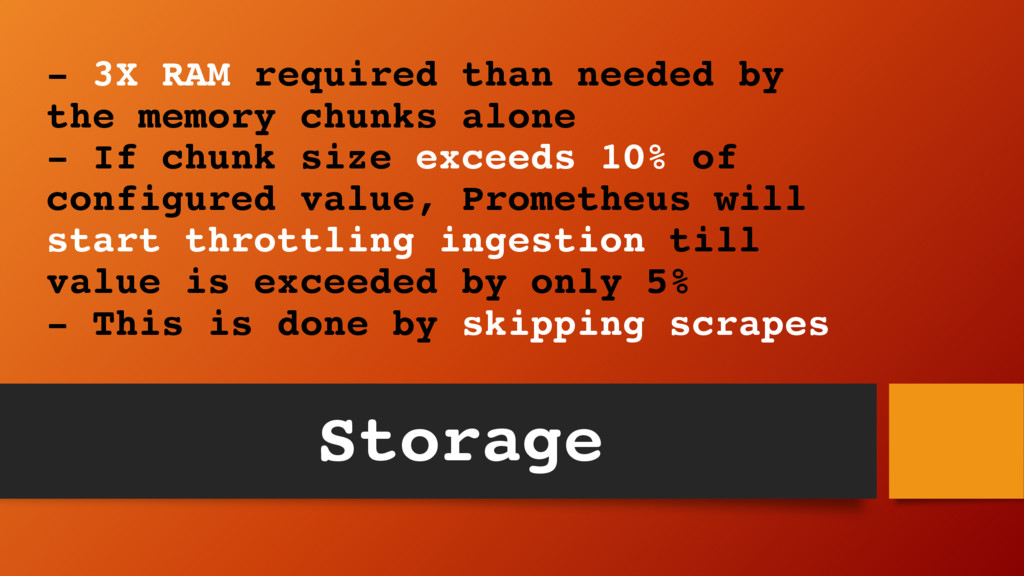
alone - If chunk size exceeds 10% of configured value, Prometheus will start throttling ingestion till value is exceeded by only 5% - This is done by skipping scrapes Storage
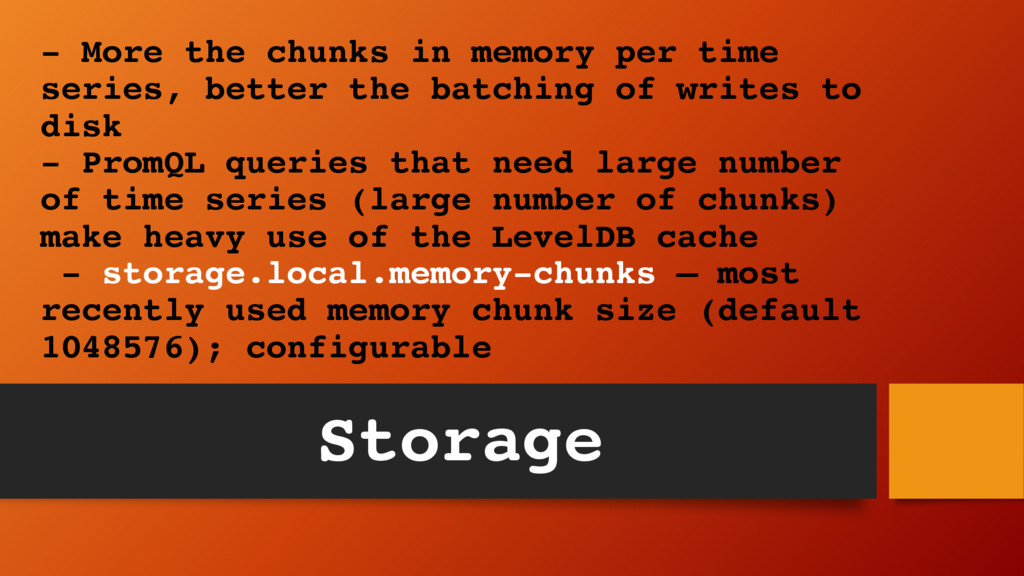
the batching of writes to disk - PromQL queries that need large number of time series (large number of chunks) make heavy use of the LevelDB cache - storage.local.memory-chunks – most recently used memory chunk size (default 1048576); configurable Storage
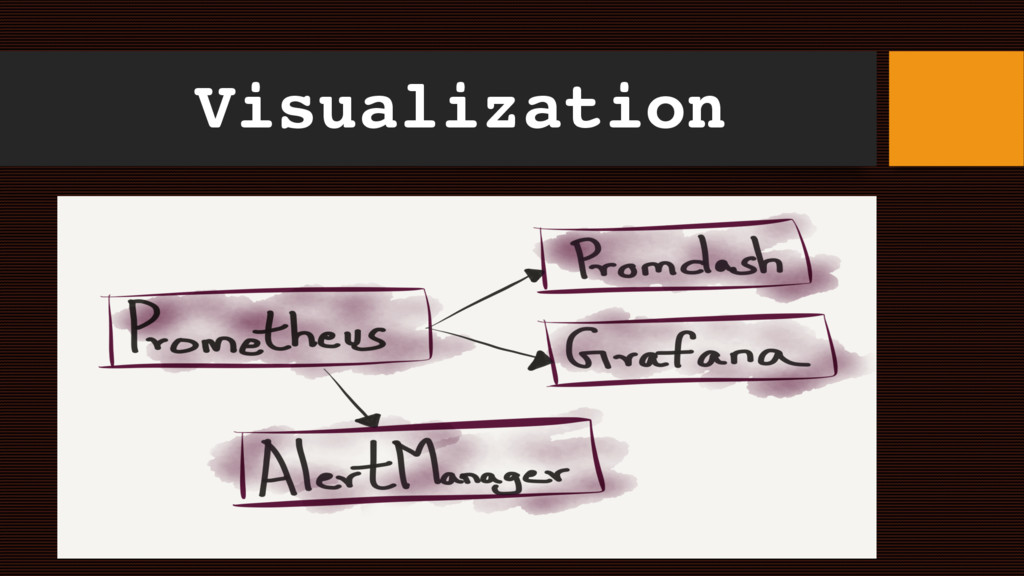
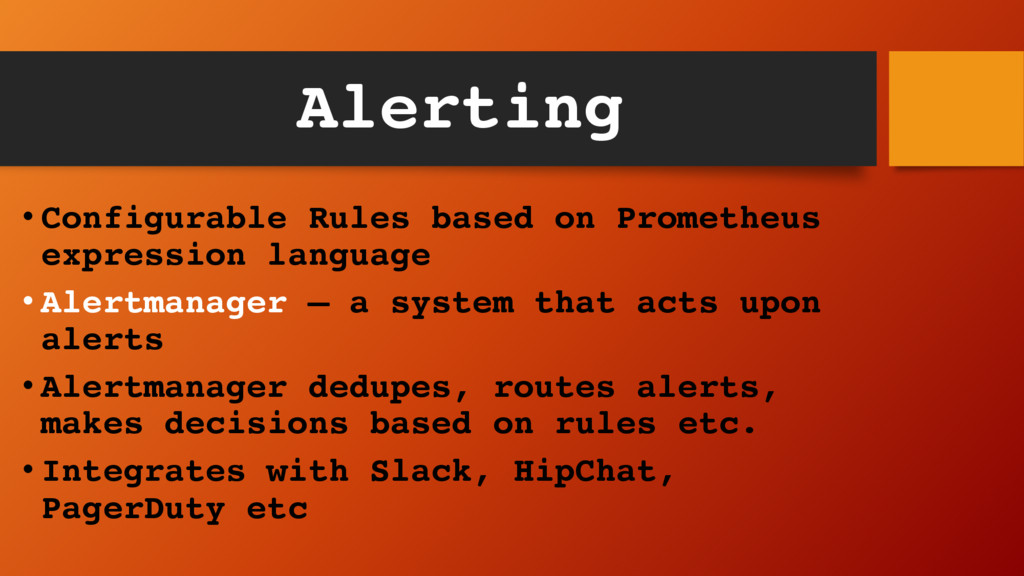
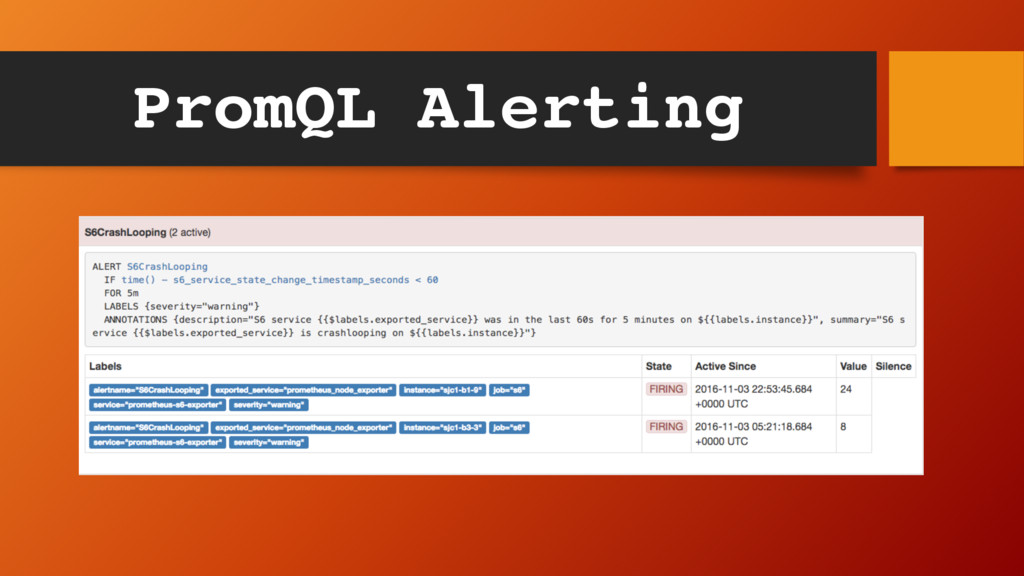
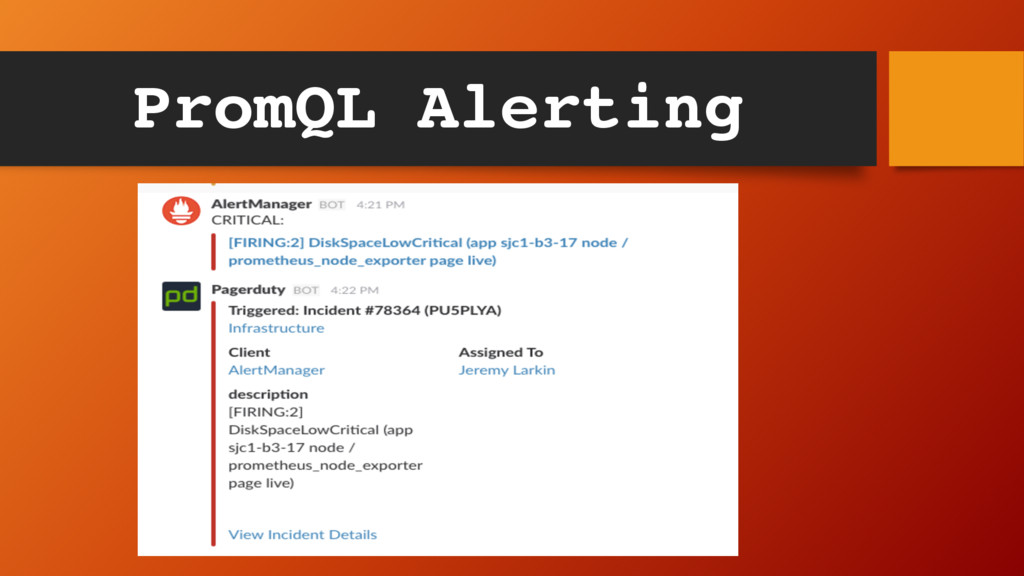
Alertmanager – a system that acts upon alerts • Alertmanager dedupes, routes alerts, makes decisions based on rules etc. • Integrates with Slack, HipChat, PagerDuty etc
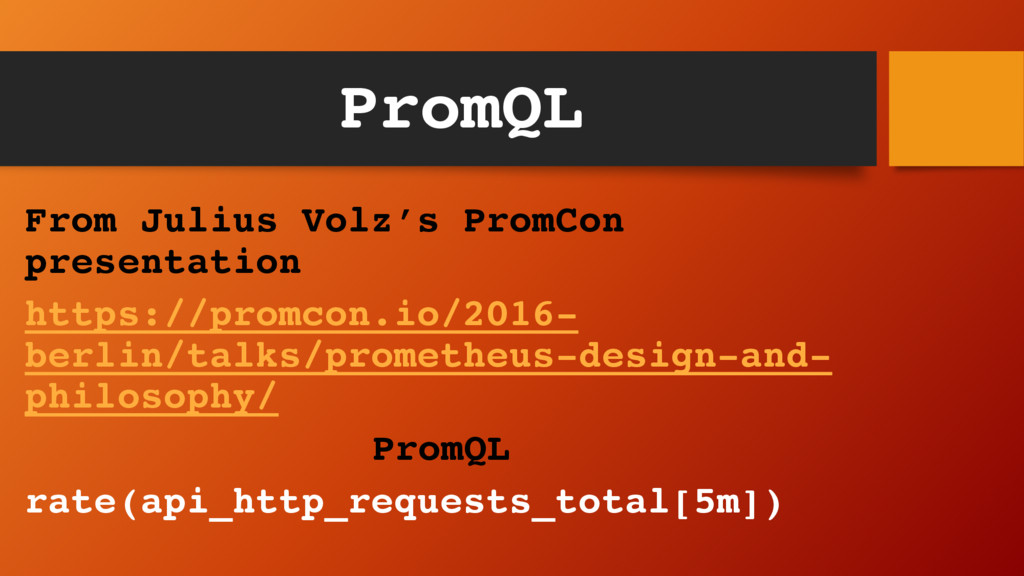
![PromQL vs SQL PromQL rate(api_http_requests_total[5m]) SQL SELECT job, instance, method,](https://files.speakerdeck.com/presentations/ff248254e6d149bbbe14f06852c92aa5/slide_45.jpg)
![Thank You! [email protected] Twitter - @copyconstruct](https://files.speakerdeck.com/presentations/ff248254e6d149bbbe14f06852c92aa5/slide_49.jpg)