Upgrade to Pro — share decks privately, control downloads, hide ads and more …

Using the Open Source OPC-UA Client and Server ...

Sponsored · Your Podcast. Everywhere. Effortlessly. Share. Educate. Inspire. Entertain. You do you. We'll handle the rest.

Using the Open Source OPC-UA Client and Server for Your IIoT Solutions

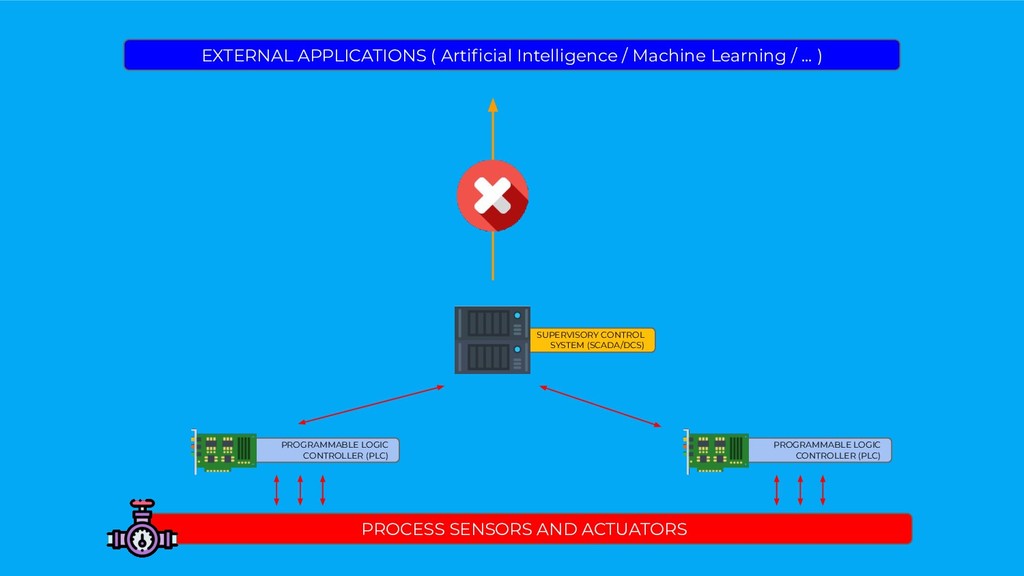
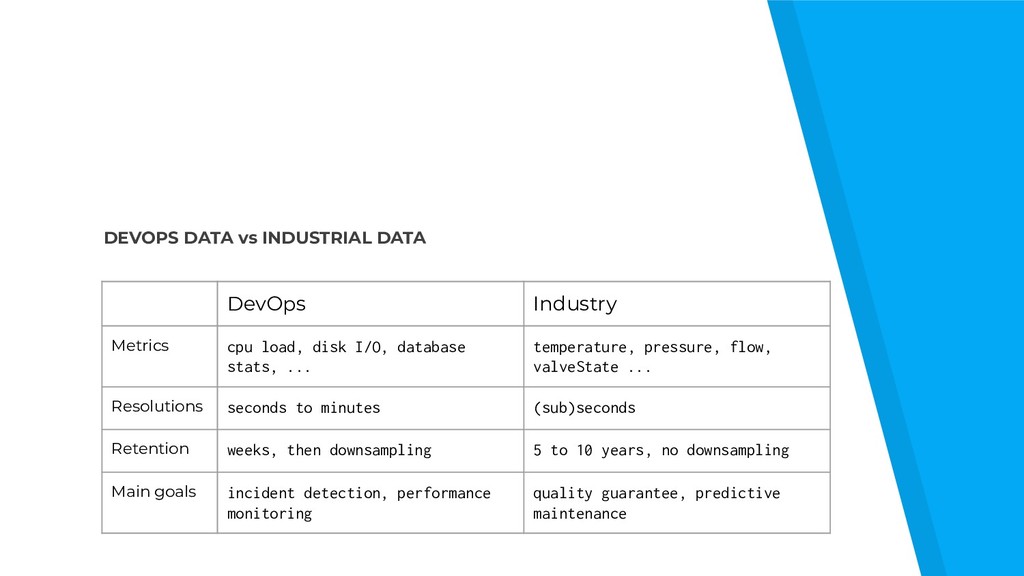
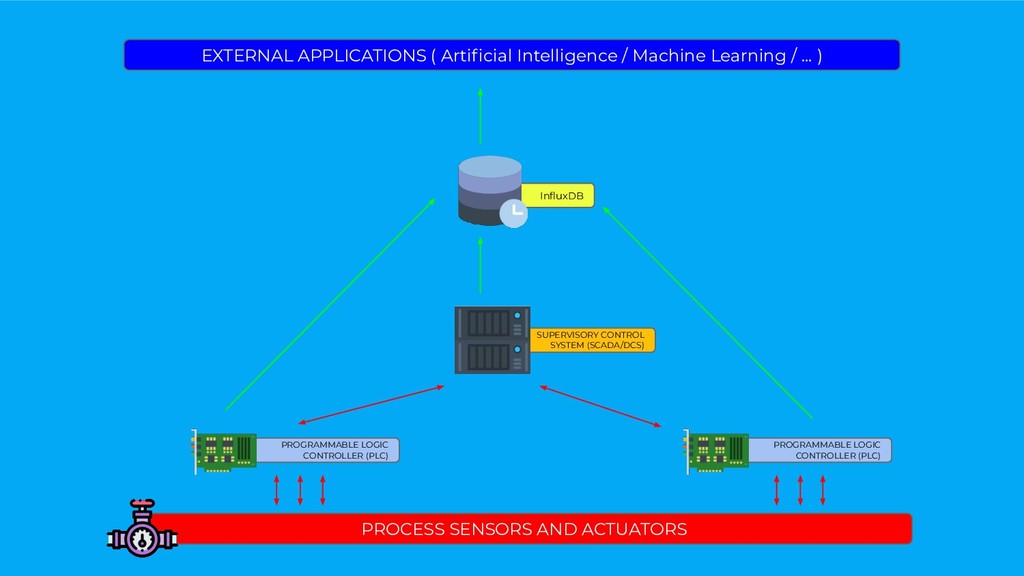
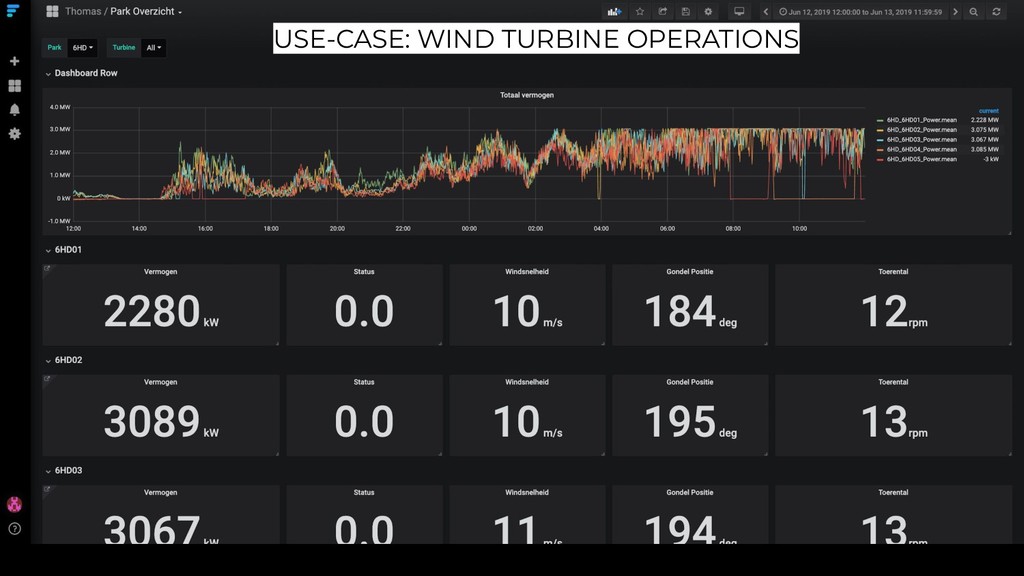
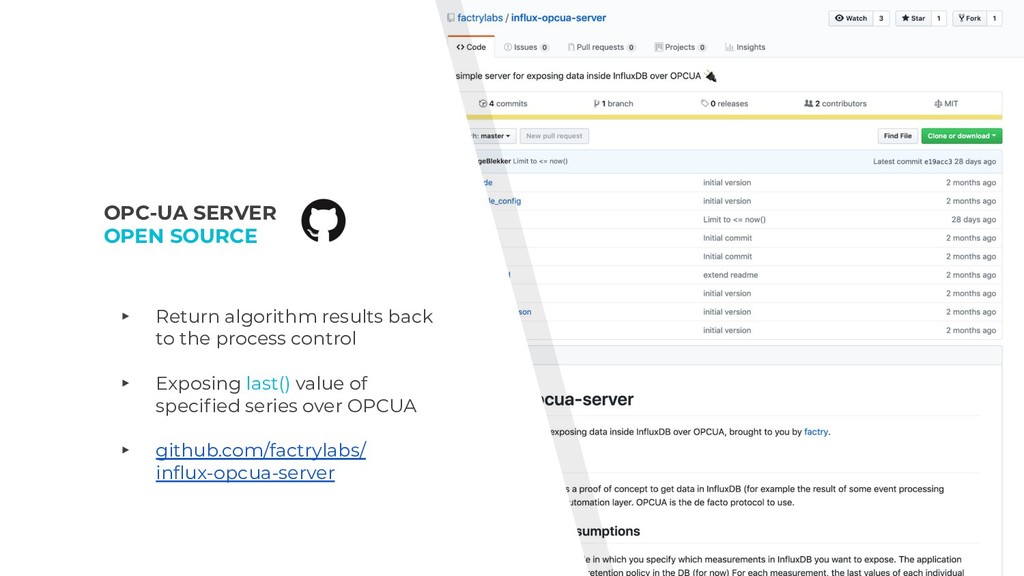
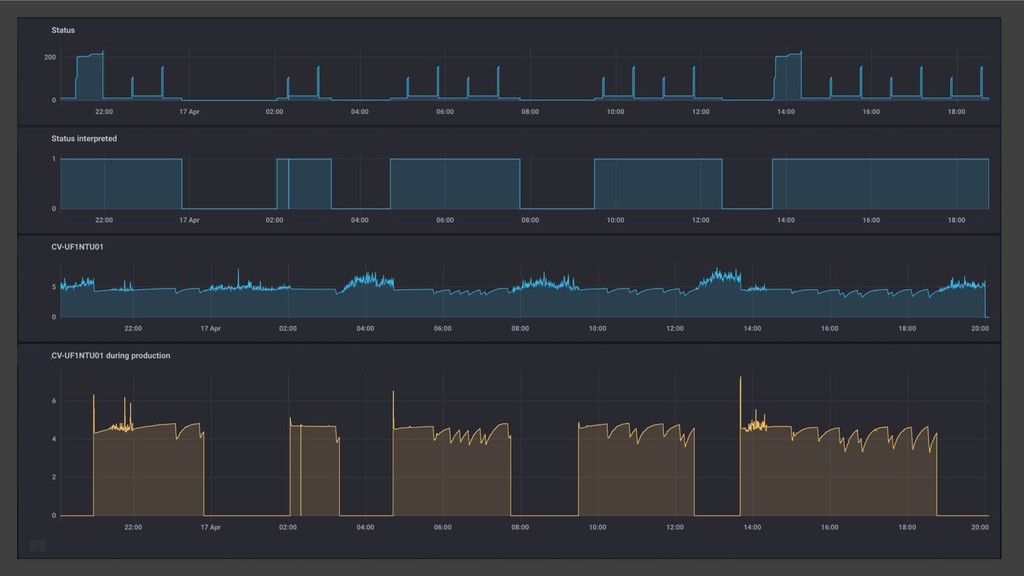
While currently a lot of the focus of time-series databases is on DevOps use-cases, they can also have a major impact for industrial applications. This talk focusses on the industrial application of InfluxDB, enabled bij the OPCUA protocol. It shows how we built an open-source OPC-UA client and server to bring data from and to your process control systems. We also zoom in on how Flux fits into the picture.

(Talk originally presented at InfluxDays London 2019
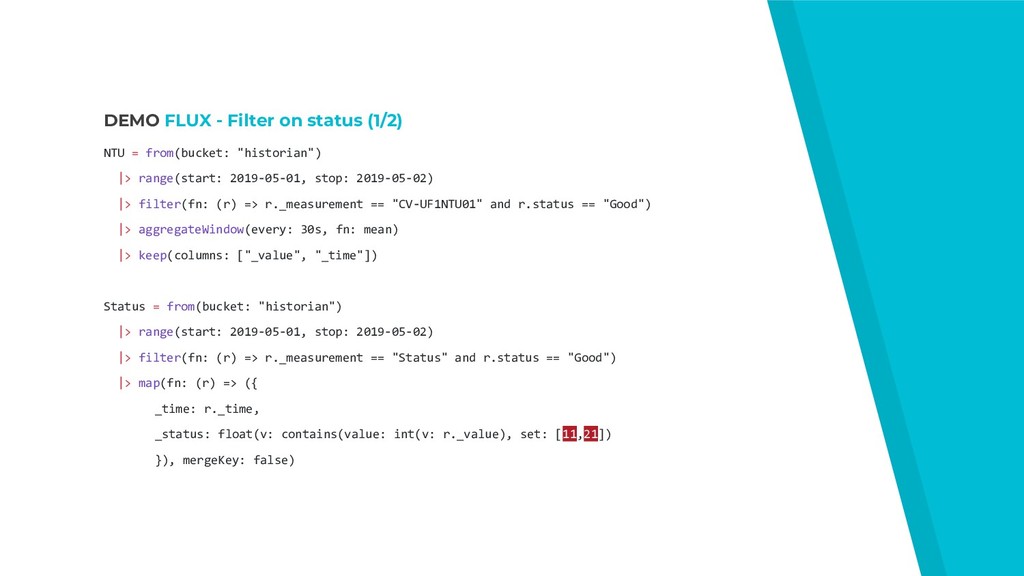
Avatar for Jeroen Coussement

Jeroen Coussement

June 14, 2019
Tweet

Other Decks in Technology

Transcript

  1. Using the Open Source OPC-UA Client and Server for Your

    IIoT Solutions JEROEN COUSSEMENT - INFLUXDAYS 2019 - LONDON
  2. ABOUT FACTRY ▸ Based in Ghent, Belgium ▸ Industrial software

    solutions ▸ Tools for data-driven operational improvement ▸ Factry Historian ▸ Lots of open-source
  3. SUPERVISORY CONTROL SYSTEM (SCADA/DCS) PROGRAMMABLE LOGIC CONTROLLER (PLC) PROCESS SENSORS

    AND ACTUATORS EXTERNAL APPLICATIONS ( Artificial Intelligence / Machine Learning / … ) PROGRAMMABLE LOGIC CONTROLLER (PLC)
  4. DEVOPS DATA vs INDUSTRIAL DATA DevOps Industry Metrics cpu load,

    disk I/O, database stats, ... temperature, pressure, flow, valveState ... Resolutions seconds to minutes (sub)seconds Retention weeks, then downsampling 5 to 10 years, no downsampling Main goals incident detection, performance monitoring quality guarantee, predictive maintenance
  5. SUPERVISORY CONTROL SYSTEM (SCADA/DCS) PROGRAMMABLE LOGIC CONTROLLER (PLC) PROCESS SENSORS

    AND ACTUATORS InfluxDB EXTERNAL APPLICATIONS ( Artificial Intelligence / Machine Learning / … ) PROGRAMMABLE LOGIC CONTROLLER (PLC)
  6. OPC-UA DESCRIPTION ▸ Industrial communication protocol ▸ Successor of OPC

    - OLE for Process Control ▸ Vendor independent / Platform independent ▸ Released in 2006, but became adopted only recently ▸ Integrated on newest controllers, but retrofit on older ones possible.
  7. OPC-UA DATA STRUCTURE ▸ Hierarchical data structure ▸ Everything is

    represented as a data node. ▹ Each node has a unique nodeID ▹ Consists of namespace + identifier ▹ ns=2;s=S7:12_03_12.DB100.4,r
  8. SUPERVISORY CONTROL SYSTEM (SCADA/DCS) PROGRAMMABLE LOGIC CONTROLLER (PLC) PROCESS SENSORS

    AND ACTUATORS InfluxDB EXTERNAL APPLICATIONS ( Artificial Intelligence / Machine Learning / … ) PROGRAMMABLE LOGIC CONTROLLER (PLC)
  9. OPC-UA LOGGER OPEN SOURCE ▸ Reads data from OPCUA sources

    ▸ Local buffering for no data loss ▸ github.com/coussej/ node-opcua-logger
  10. OPC-UA LOGGER OPEN SOURCE ▸ V2 coming soon ▹ Cleaner

    code (async/await!) ▹ Better buffering ▹ Deploy as a single binary
  11. SUPERVISORY CONTROL SYSTEM (SCADA/DCS) PROGRAMMABLE LOGIC CONTROLLER (PLC) PROCESS SENSORS

    AND ACTUATORS InfluxDB EXTERNAL APPLICATIONS ( Artificial Intelligence / Machine Learning / … ) PROGRAMMABLE LOGIC CONTROLLER (PLC)
  12. OPC-UA SERVER OPEN SOURCE ▸ Return algorithm results back to

    the process control ▸ Exposing last() value of specified series over OPCUA ▸ github.com/factrylabs/ influx-opcua-server
  13. FLUX CUSTOMER QUESTION 1 ▸ Input Pressure ▸ Output Pressure

    ▸ Can we calculate Pressure drop? ▸ Math across measurements!
  14. DEMO FLUX - Pressure drop (1/2) UF1PT01 = from(bucket: "historian")

    |> range(start: 2019-05-01, stop: 2019-05-25) |> filter(fn: (r) => r._measurement == "CV-UF1PT01") |> aggregateWindow(every: 3m, fn: mean, createEmpty: false) UF1PT02 = from(bucket: "historian") |> range(start: 2019-05-01, stop: 2019-05-25) |> filter(fn: (r) => r._measurement == "CV-UF1PT02") |> aggregateWindow(every: 3m, fn: mean, createEmpty: false)
  15. DEMO FLUX - Pressure drop (2/2) join( tables: {pt01:UF1PT01, pt02:UF1PT02},

    on: ["_time"] ) |> map(fn: (r) => ({ _time: r._time, _pressureDrop: r._value_pt01 - r._value_pt02 })) |> filter(fn: (r) => r._pressureDrop > 0) |> aggregateWindow(columns: ["_pressureDrop"], every: 1h, fn: mean, createEmpty: false)
  16. FLUX CUSTOMER QUESTION 2 ▸ NTU (Nephelometric Turbidity Unit) ▸

    Machine Status ▸ Can we see the NTU only when the machine is in production?
  17. DEMO FLUX - Filter on status (1/2) NTU = from(bucket:

    "historian") |> range(start: 2019-05-01, stop: 2019-05-02) |> filter(fn: (r) => r._measurement == "CV-UF1NTU01" and r.status == "Good") |> aggregateWindow(every: 30s, fn: mean) |> keep(columns: ["_value", "_time"]) Status = from(bucket: "historian") |> range(start: 2019-05-01, stop: 2019-05-02) |> filter(fn: (r) => r._measurement == "Status" and r.status == "Good") |> map(fn: (r) => ({ _time: r._time, _status: float(v: contains(value: int(v: r._value), set: [11,21]) }), mergeKey: false)
  18. DEMO FLUX - Filter on status (2/2) union(tables: [NTU, Status])

    |> sort(columns: ["_time"], desc: false) |> fill(column: "_status", usePrevious: true) |> fill(column: "_status", value: 0.0) |> fill(column: "_value", usePrevious: true) // same for the values themselves |> fill(column: "_value", value: 0.0) |> map(fn: (r) => ({_time: r._time, _filteredValue: r._value * r._status}), mergeKey: false) |> yield()