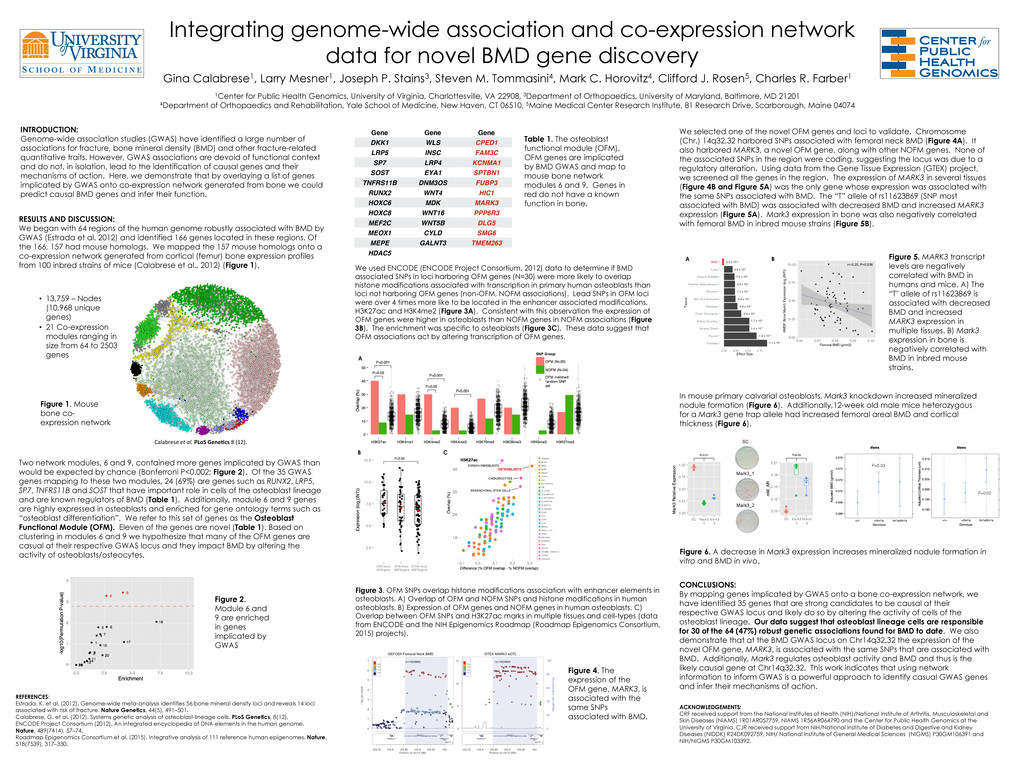
gene discovery Gina Calabrese1, Larry Mesner1, Joseph P. Stains3, Steven M. Tommasini4, Mark C. Horovitz4, Clifford J. Rosen5, Charles R. Farber1 1Center for Public Health Genomics, University of Virginia, Charlottesville, VA 22908, 3Department of Orthopaedics, University of Maryland, Baltimore, MD 21201 4Department of Orthopaedics and Rehabilitation, Yale School of Medicine, New Haven, CT 06510, 5Maine Medical Center Research Institute, 81 Research Drive, Scarborough, Maine 04074 INTRODUCTION: Genome-wide association studies (GWAS) have identified a large number of associations for fracture, bone mineral density (BMD) and other fracture-related quantitative traits. However, GWAS associations are devoid of functional context and do not, in isolation, lead to the identification of causal genes and their mechanisms of action. Here, we demonstrate that by overlaying a list of genes implicated by GWAS onto co-expression network generated from bone we could predict causal BMD genes and infer their function. Figure 1. Mouse bone co- expression network • 13,759 – Nodes (10,968 unique genes) • 21 Co-expression modules ranging in size from 64 to 2503 genes Calabrese et al. PLoS Gene)cs 8 (12). Figure 2. Module 6 and 9 are enriched in genes implicated by GWAS SC Mark3_1 Mark3_2 RESULTS AND DISCUSSION: We began with 64 regions of the human genome robustly associated with BMD by GWAS (Estrada et al. 2012) and identified 166 genes located in these regions. Of the 166, 157 had mouse homologs. We mapped the 157 mouse homologs onto a co-expression network generated from cortical (femur) bone expression profiles from 100 inbred strains of mice (Calabrese et al., 2012) (Figure 1). Two network modules, 6 and 9, contained more genes implicated by GWAS than would be expected by chance (Bonferroni P<0.002; Figure 2). Of the 35 GWAS genes mapping to these two modules, 24 (69%) are genes such as RUNX2, LRP5, SP7, TNFRS11B and SOST that have important role in cells of the osteoblast lineage and are known regulators of BMD (Table 1). Additionally, module 6 and 9 genes are highly expressed in osteoblasts and enriched for gene ontology terms such as “osteoblast differentiation”. We refer to this set of genes as the Osteoblast Functional Module (OFM). Eleven of the genes are novel (Table 1). Based on clustering in modules 6 and 9 we hypothesize that many of the OFM genes are casual at their respective GWAS locus and they impact BMD by altering the activity of osteoblasts/osteocytes. Table 1. The osteoblast functional module (OFM). OFM genes are implicated by BMD GWAS and map to mouse bone network modules 6 and 9. Genes in red do not have a known function in bone. Gene Gene Gene DKK1 WLS CPED1 LRP5 INSC FAM3C SP7 LRP4 KCNMA1 SOST EYA1 SPTBN1 TNFRS11B DNM3OS FUBP3 RUNX2 WNT4 HIC1 HOXC6 MDK MARK3 HOXC8 WNT16 PPP6R3 MEF2C WNT5B DLG5 MEOX1 CYLD SMG6 MEPE GALNT3 TMEM263 HDAC5 We used ENCODE (ENCODE Project Consortium, 2012) data to determine if BMD associated SNPs in loci harboring OFM genes (N=30) were more likely to overlap histone modifications associated with transcription in primary human osteoblasts than loci not harboring OFM genes (non-OFM, NOFM associations). Lead SNPs in OFM loci were over 4 times more like to be located in the enhancer associated modifications, H3K27ac and H3K4me2 (Figure 3A). Consistent with this observation the expression of OFM genes were higher in osteoblasts than NOFM genes in NOFM associations (Figure 3B). The enrichment was specific to osteoblasts (Figure 3C). These data suggest that OFM associations act by altering transcription of OFM genes. Figure 3. OFM SNPs overlap histone modifications association with enhancer elements in osteoblasts. A) Overlap of OFM and NOFM SNPs and histone modifications in human osteoblasts. B) Expression of OFM genes and NOFM genes in human osteoblasts. C) Overlap between OFM SNPs and H3K27ac marks in multiple tissues and cell-types (data from ENCODE and the NIH Epigenomics Roadmap (Roadmap Epigenomics Consortium, 2015) projects). We selected one of the novel OFM genes and loci to validate. Chromosome (Chr.) 14q32.32 harbored SNPs associated with femoral neck BMD (Figure 4A). It also harbored MARK3, a novel OFM gene, along with other NOFM genes. None of the associated SNPs in the region were coding, suggesting the locus was due to a regulatory alteration. Using data from the Gene Tissue Expression (GTEX) project, we screened all the genes in the region. The expression of MARK3 in several tissues (Figure 4B and Figure 5A) was the only gene whose expression was associated with the same SNPs associated with BMD. The “T” allele of rs11623869 (SNP most associated with BMD) was associated with decreased BMD and increased MARK3 expression (Figure 5A). Mark3 expression in bone was also negatively correlated with femoral BMD in inbred mouse strains (Figure 5B). Figure 4. The expression of the OFM gene, MARK3, is associated with the same SNPs associated with BMD. In mouse primary calvarial osteoblasts, Mark3 knockdown increased mineralized nodule formation (Figure 6). Additionally,12-week old male mice heterozygous for a Mark3 gene trap allele had increased femoral areal BMD and cortical thickness (Figure 6). CONCLUSIONS: By mapping genes implicated by GWAS onto a bone co-expression network, we have identified 35 genes that are strong candidates to be causal at their respective GWAS locus and likely do so by altering the activity of cells of the osteoblast lineage. Our data suggest that osteoblast lineage cells are responsible for 30 of the 64 (47%) robust genetic associations found for BMD to date. We also demonstrate that at the BMD GWAS locus on Chr14q32.32 the expression of the novel OFM gene, MARK3, is associated with the same SNPs that are associated with BMD. Additionally, Mark3 regulates osteoblast activity and BMD and thus is the likely causal gene at Chr14q32.32. This work indicates that using network information to inform GWAS is a powerful approach to identify casual GWAS genes and infer their mechanisms of action. REFERENCES: Estrada, K. et al. (2012). Genome-wide meta-analysis identifies 56 bone mineral density loci and reveals 14 loci associated with risk of fracture. Nature Genetics, 44(5), 491–501. Calabrese, G. et al. (2012). Systems genetic analysis of osteoblast-lineage cells. PLoS Genetics, 8(12). ENCODE Project Consortium (2012). An integrated encyclopedia of DNA elements in the human genome. Nature, 489(7414), 57–74. Roadmap Epigenomics Consortium et al. (2015). Integrative analysis of 111 reference human epigenomes. Nature, 518(7539), 317–330. P=0.03! P=0.02! Figure 5. MARK3 transcript levels are negatively correlated with BMD in humans and mice. A) The “T" allele of rs11623869 is associated with decreased BMD and increased MARK3 expression in multiple tissues. B) Mark3 expression in bone is negatively correlated with BMD in inbred mouse strains. A B C A B Figure 6. A decrease in Mark3 expression increases mineralized nodule formation in vitro and BMD in vivo. ACKNOWLEDGEMENTS: CRF received support from the National Institutes of Health (NIH)/National Institute of Arthritis, Musculoskeletal and Skin Diseases (NIAMS) 1R01AR057759, NIAMS 1R56AR064790 and the Center for Public Health Genomics at the University of Virginia. CJR received support from NIH/National Institute of Diabetes and Digestive and Kidney Diseases (NIDDK) R24DK092759, NIH/ National Institute of General Medical Sciences (NIGMS) P30GM106391 and NIH/NIGMS P30GM103392.