for Public Health Genomics University of Virginia @cr_farber [email protected] farberlab.com Biochemistry and Molecular Genetics, Thursday Seminar, UVa, 4/28/16 Slides on speakerdeck.com
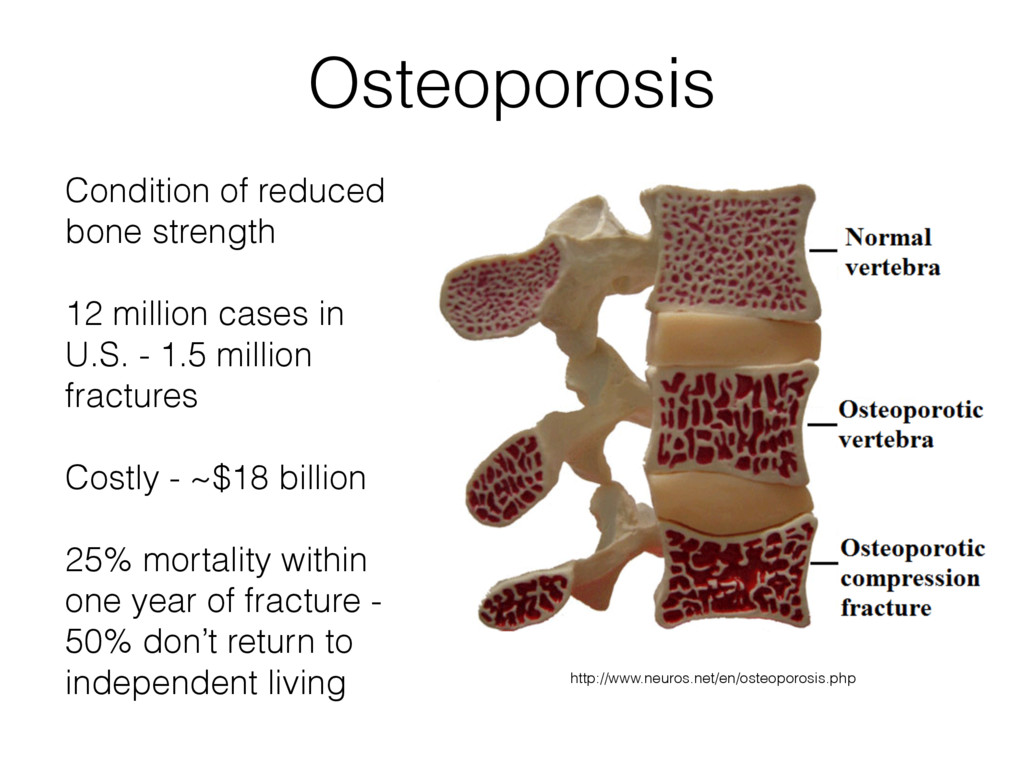
- 1.5 million fractures Costly - ~$18 billion 25% mortality within one year of fracture - 50% don’t return to independent living Osteoporosis http://www.neuros.net/en/osteoporosis.php
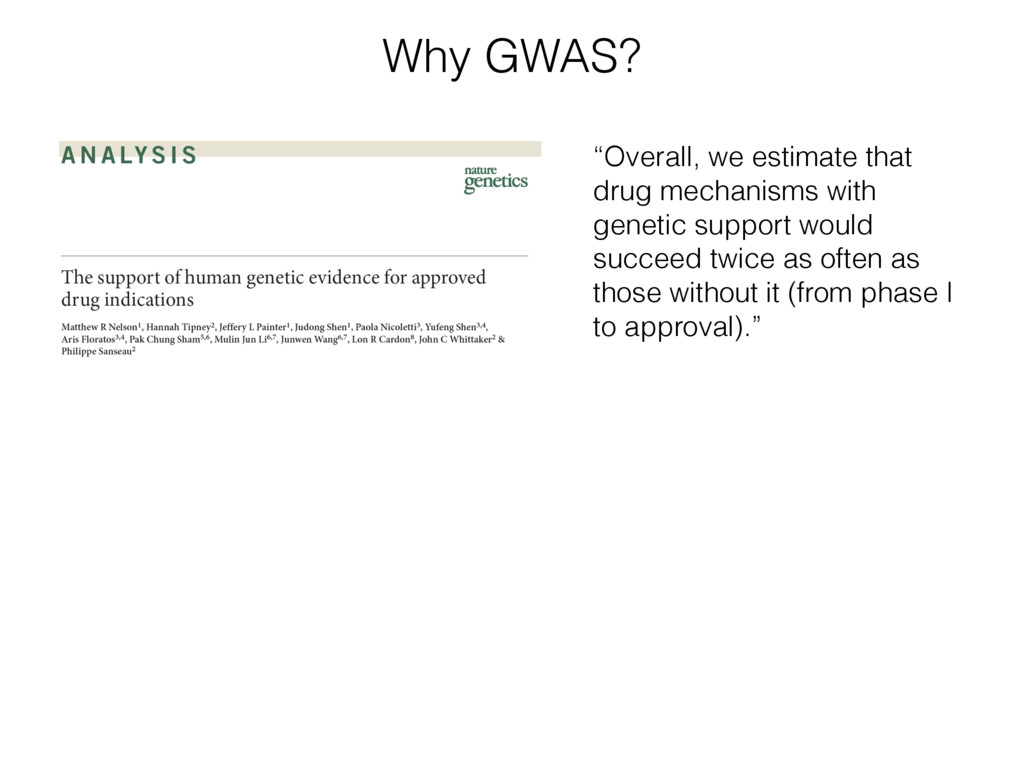
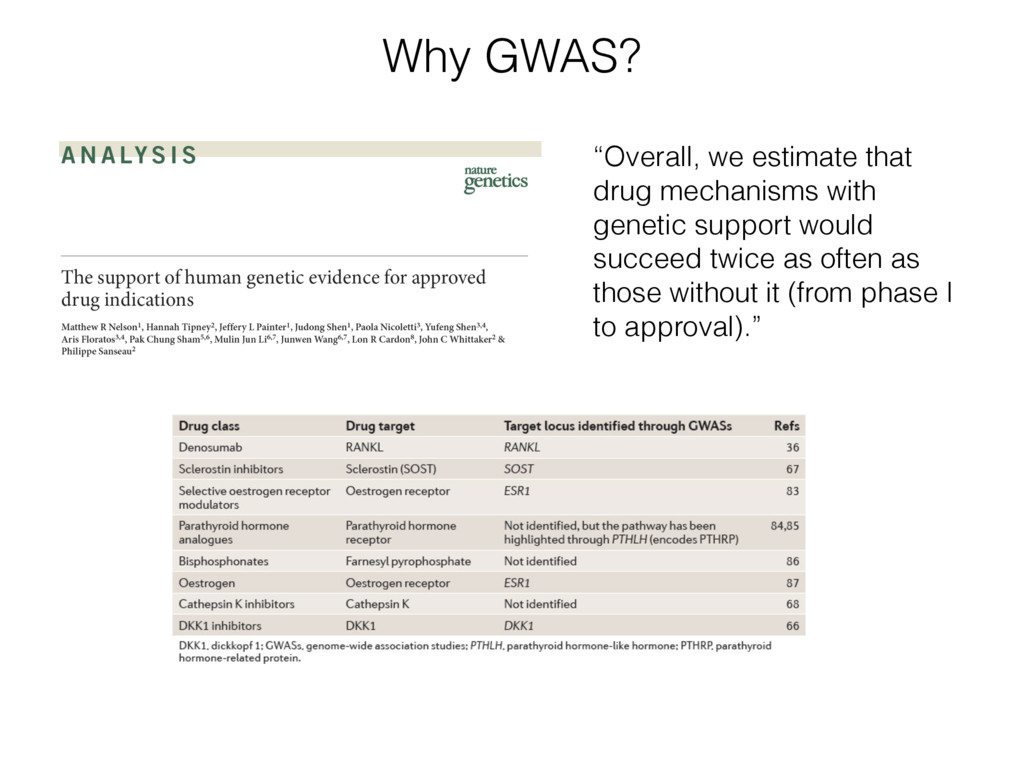
D. (2012). Genetics of osteoporosis from genome- wide association studies: advances and challenges. Nature Reviews Genetics, 13(8), 576–588. “Overall, we estimate that drug mechanisms with genetic support would succeed twice as often as those without it (from phase I to approval).”
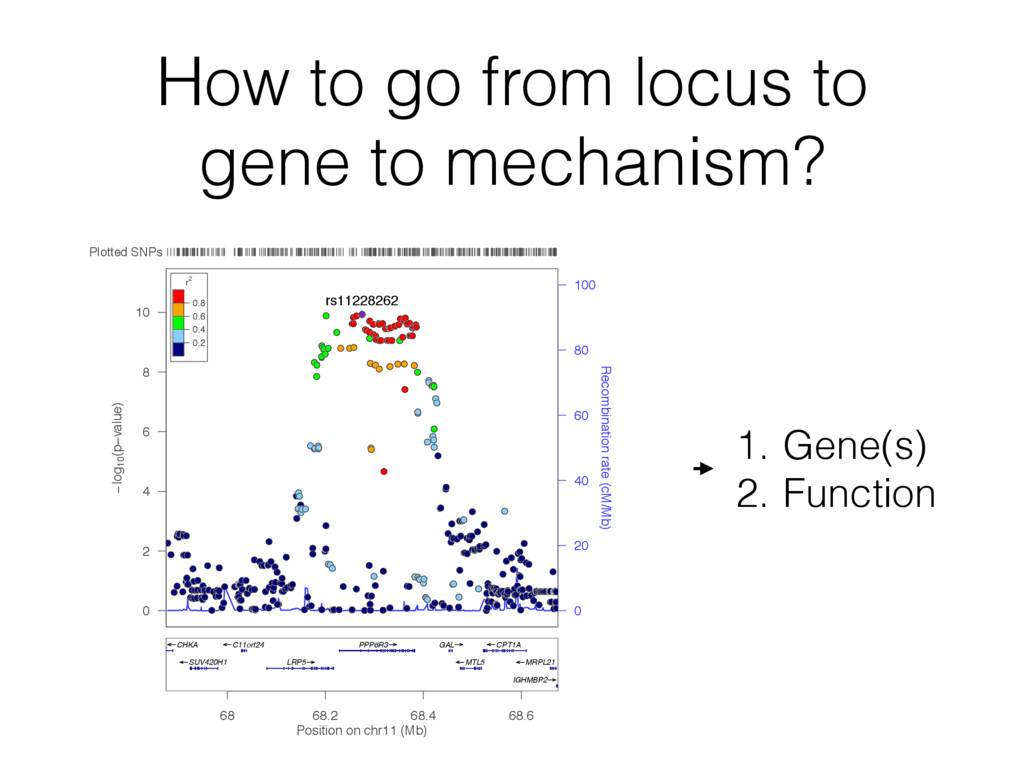
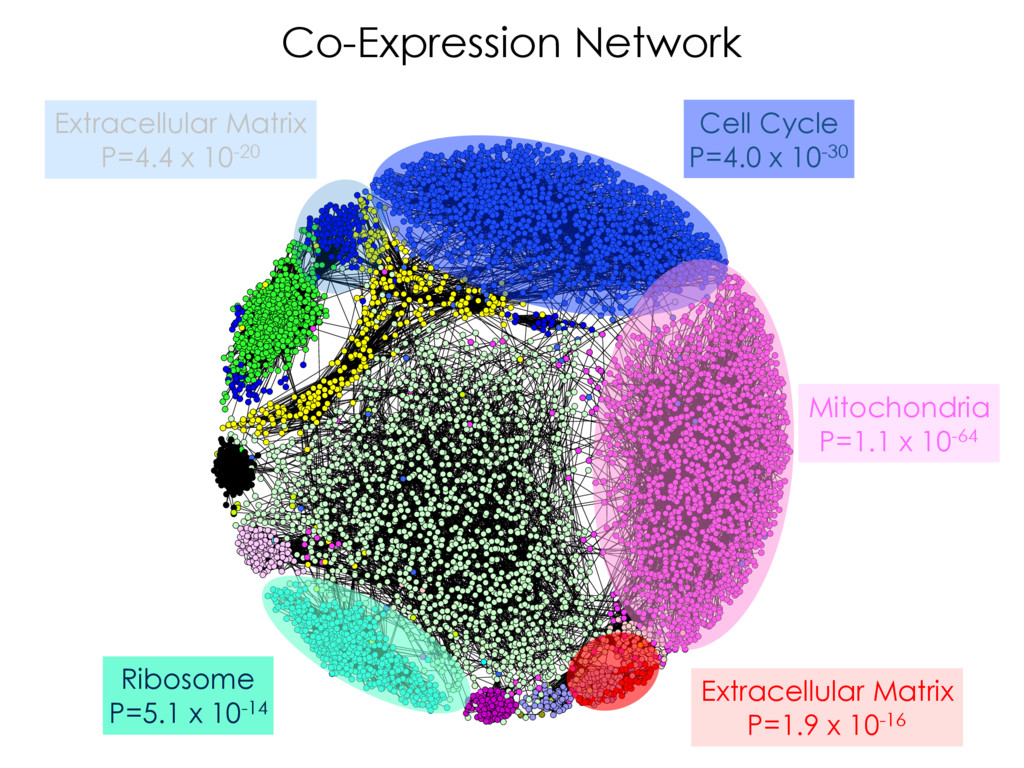
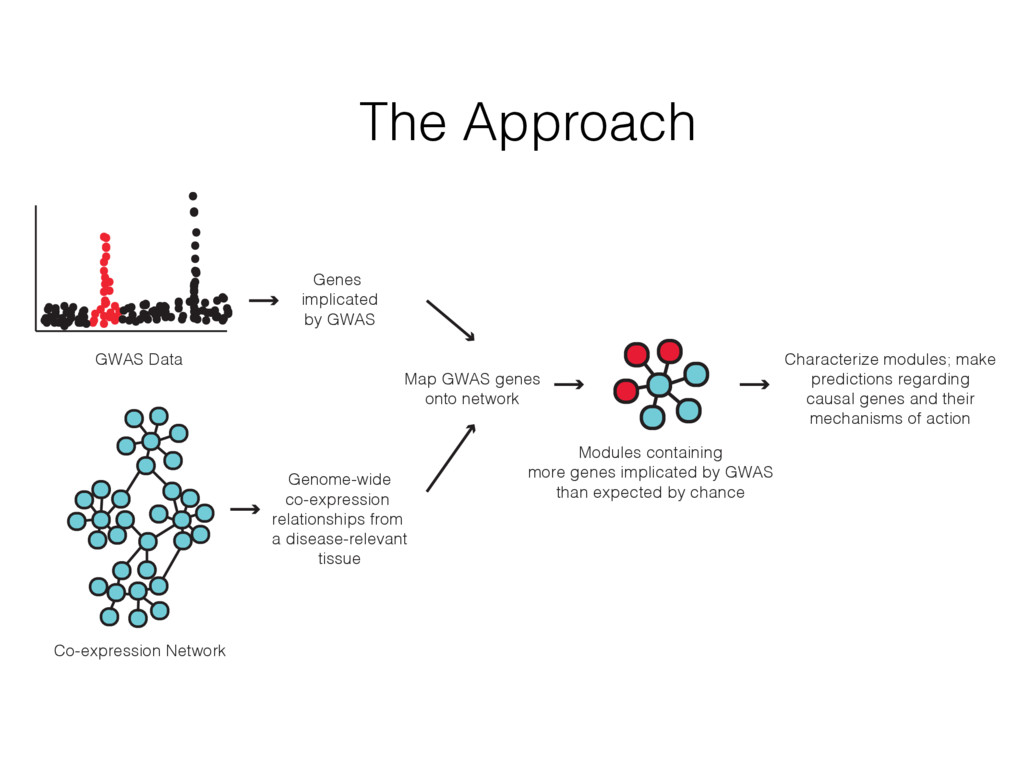
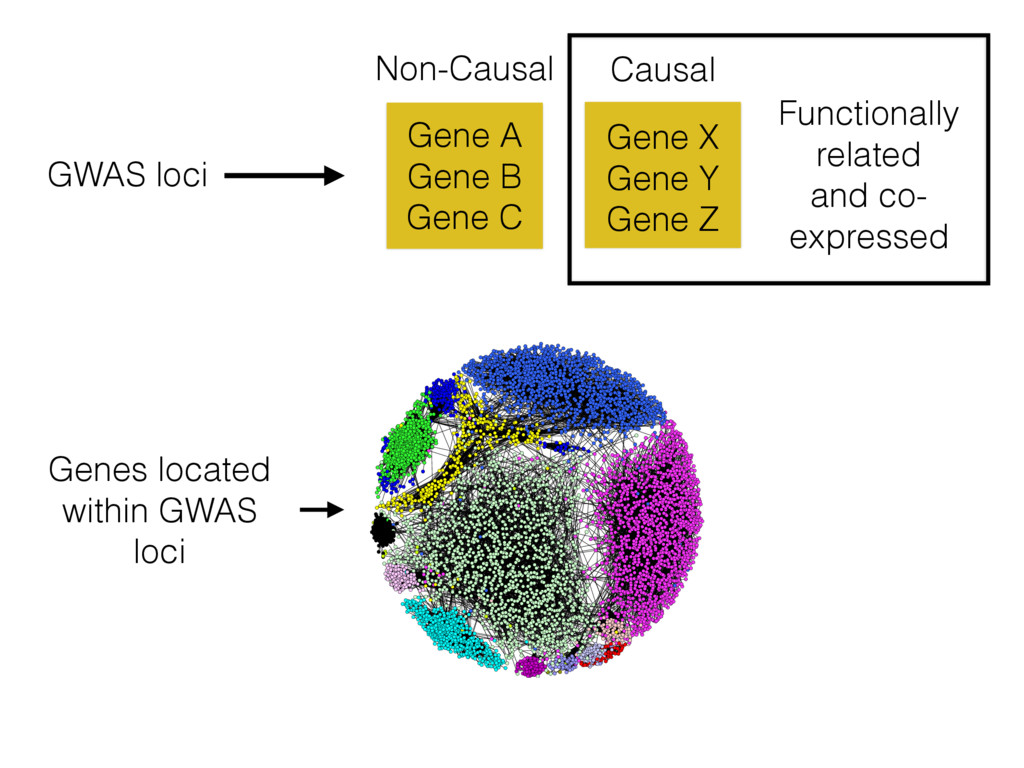
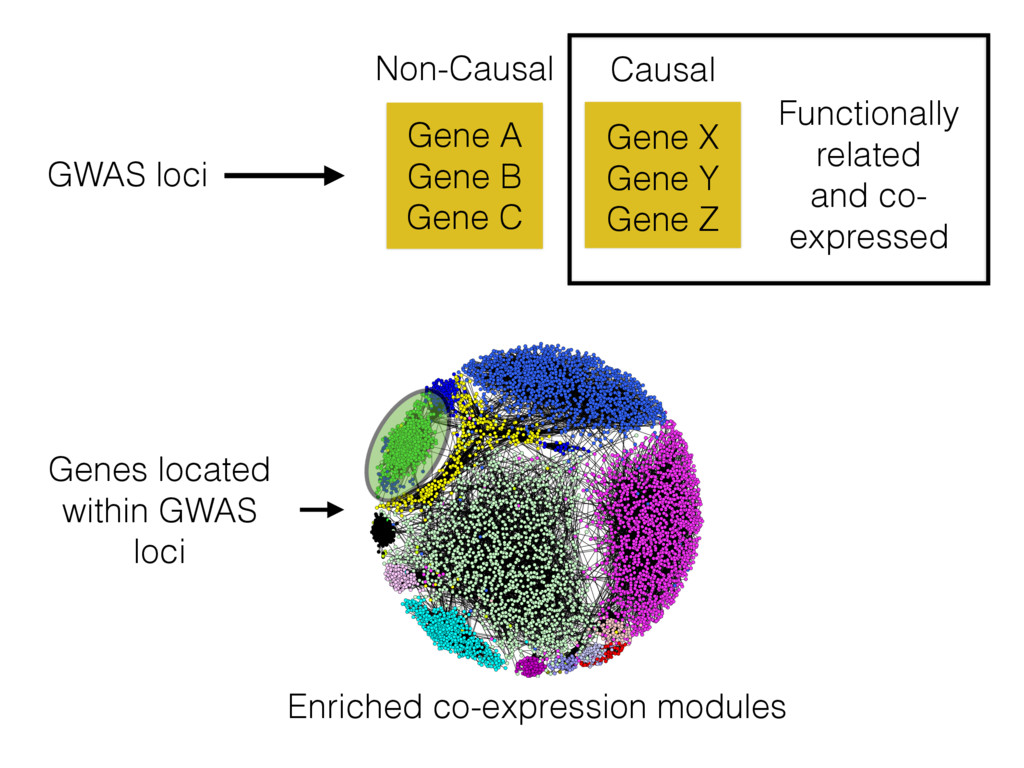
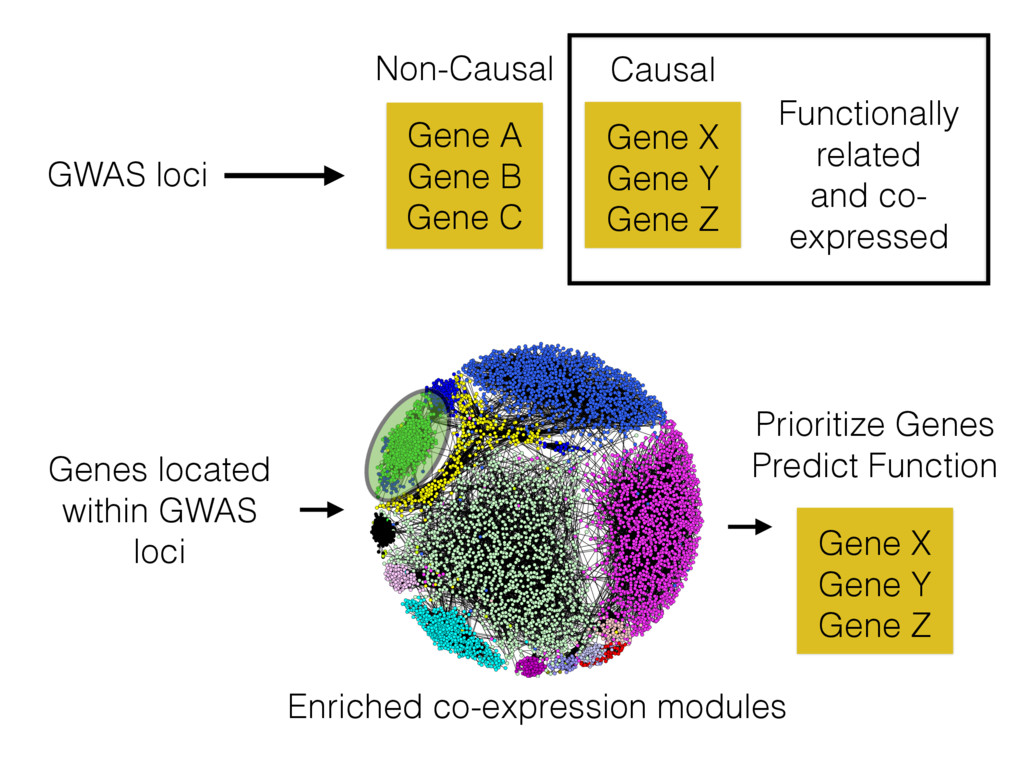
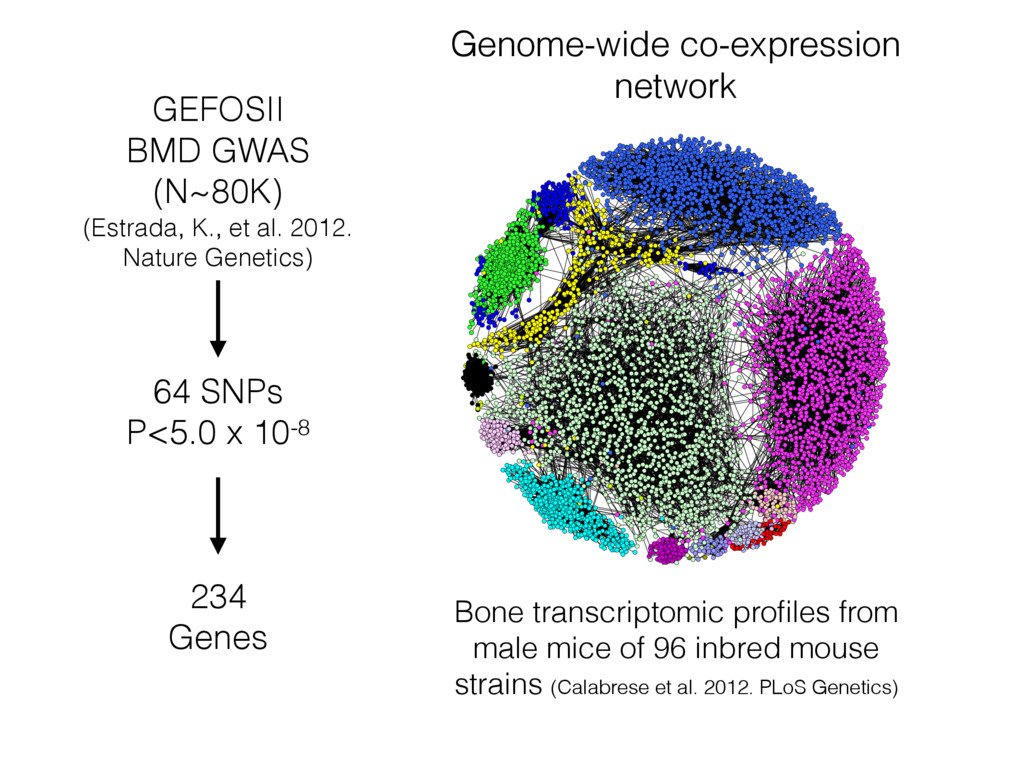
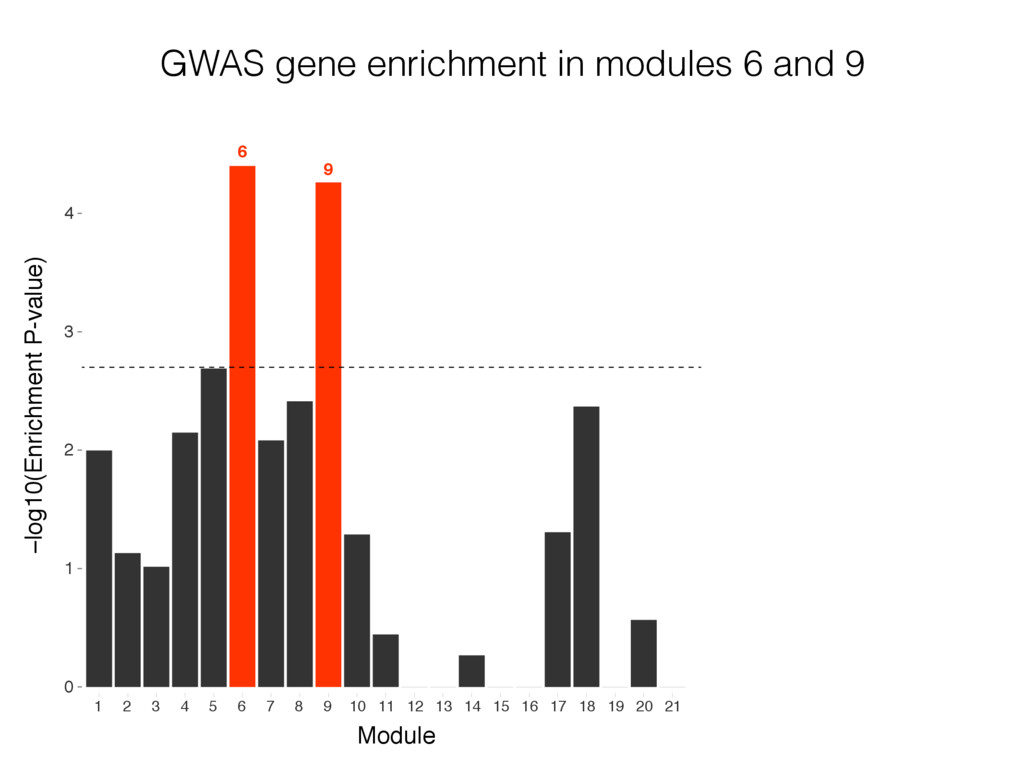
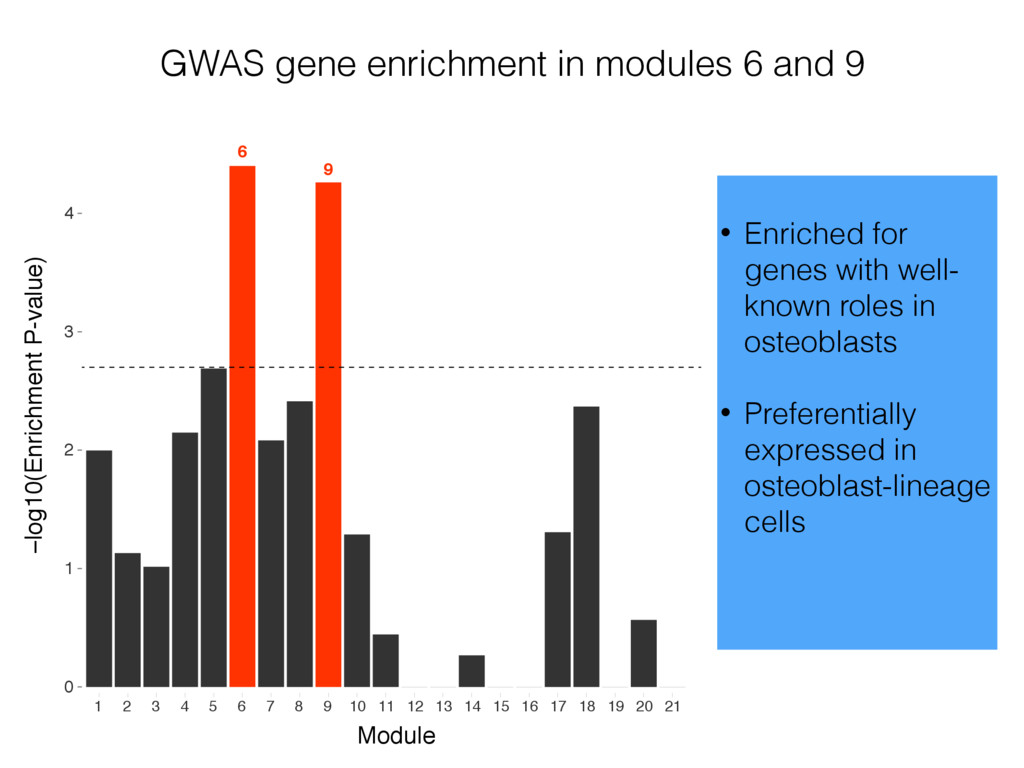
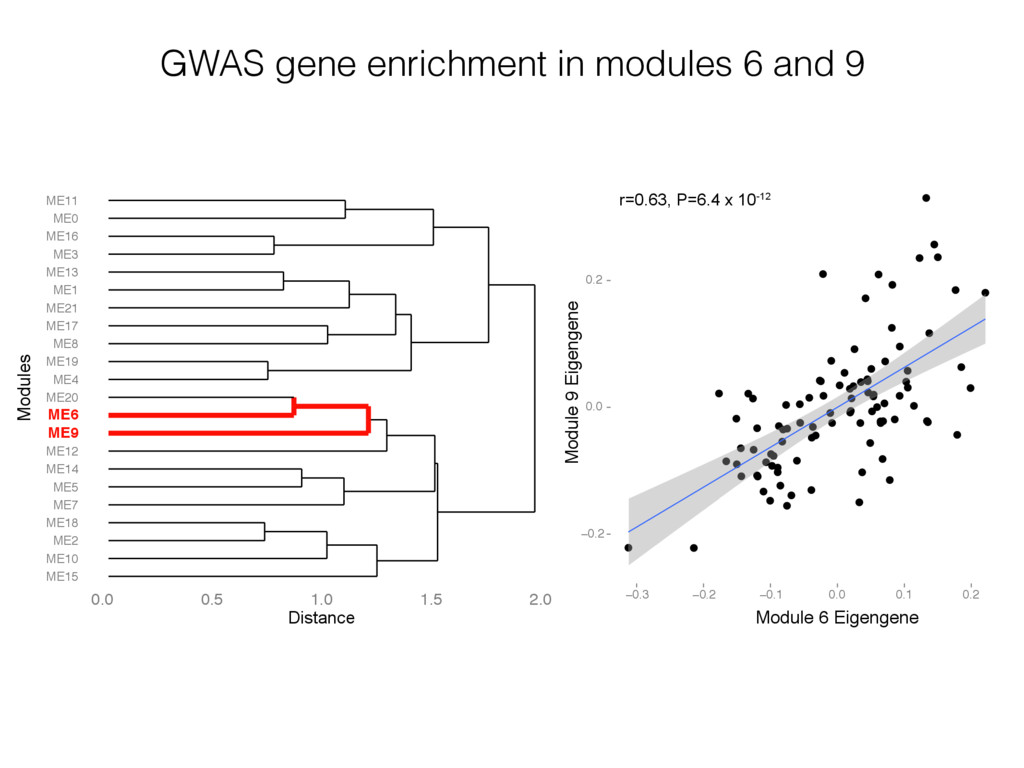
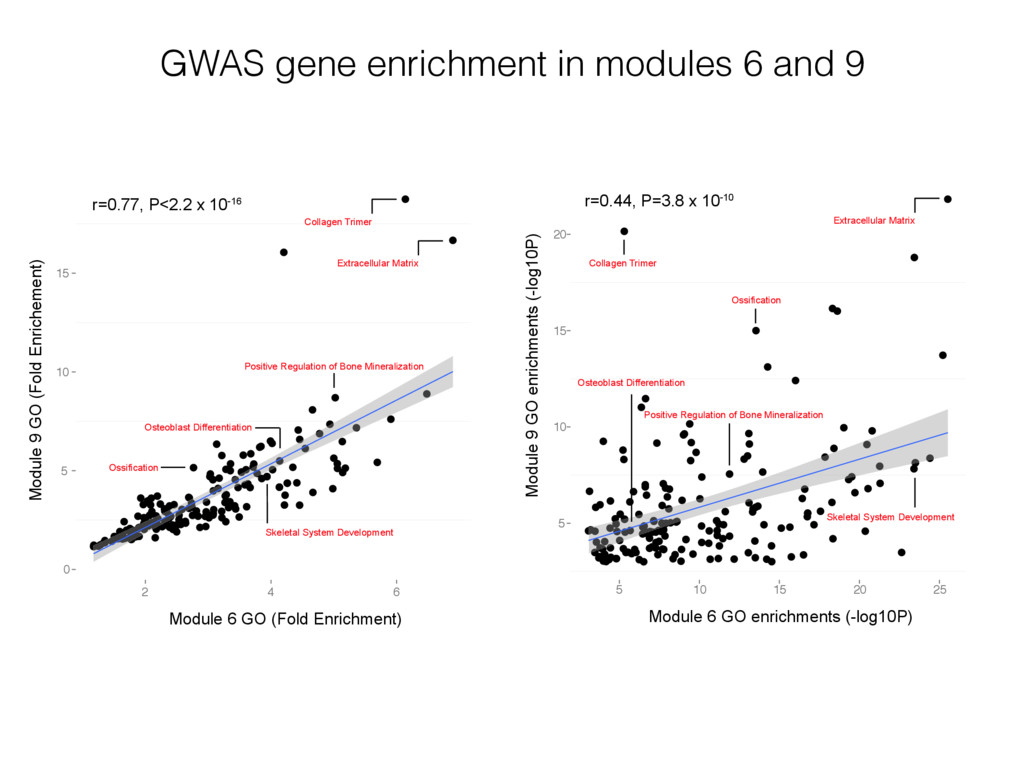
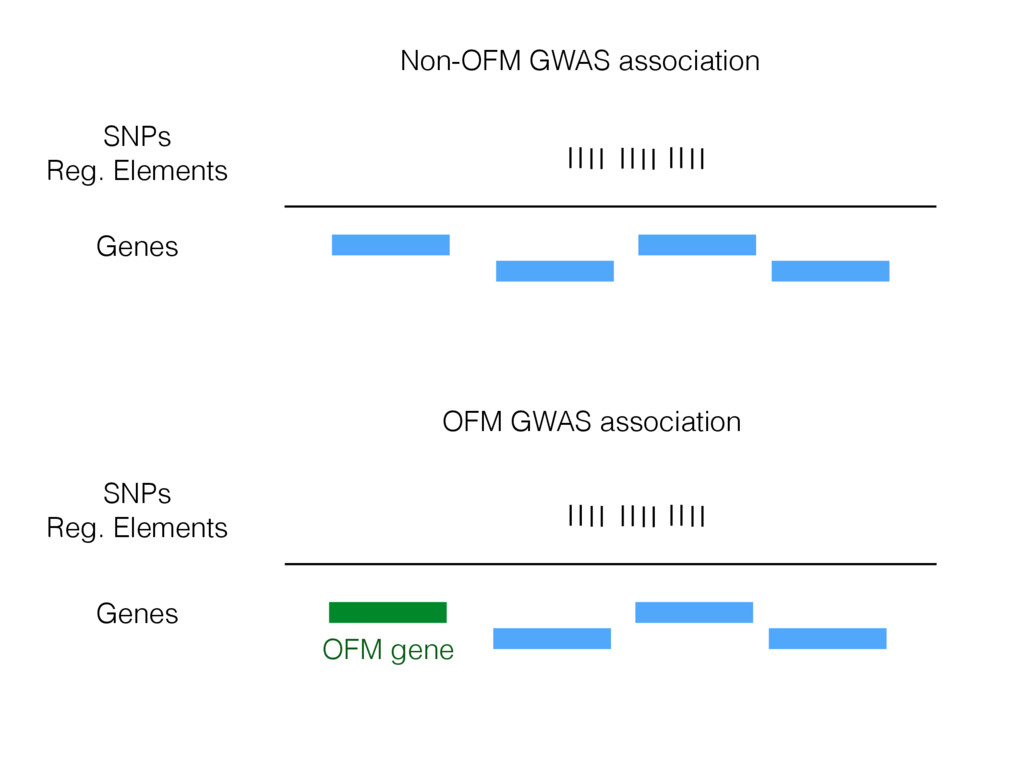
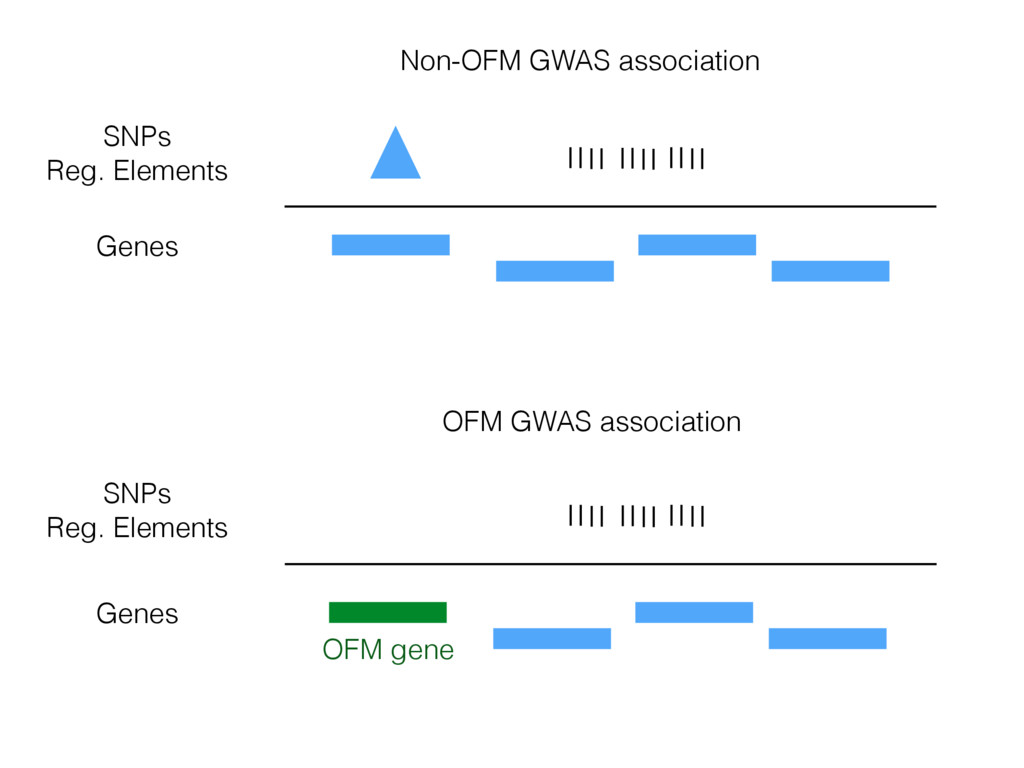
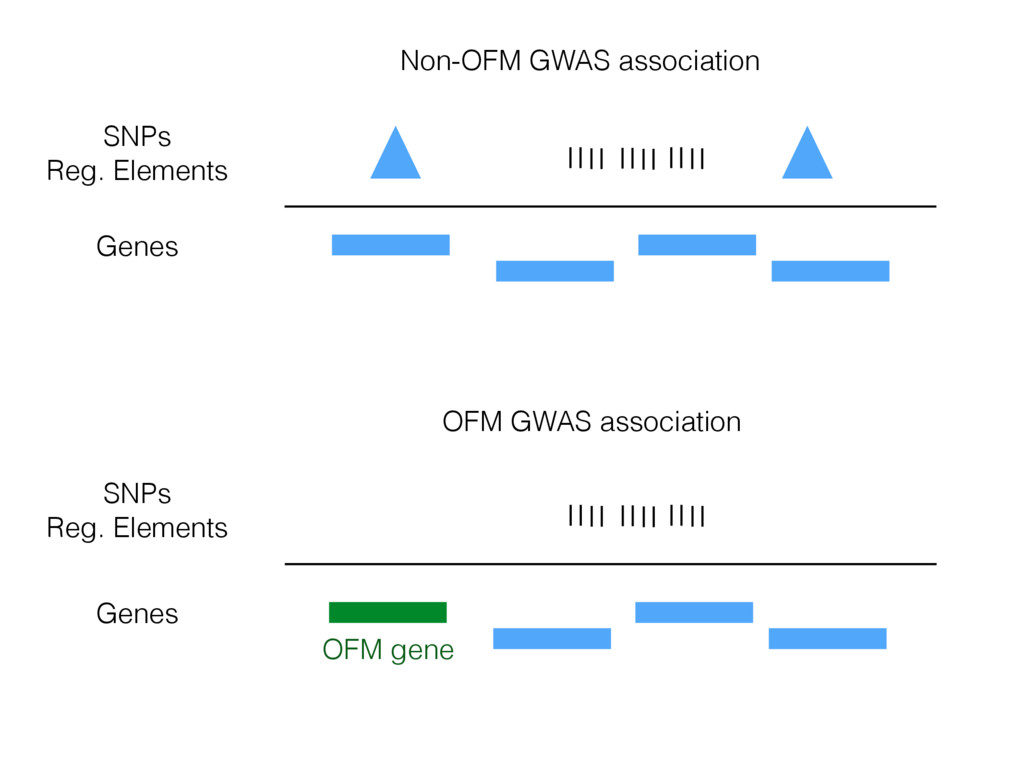
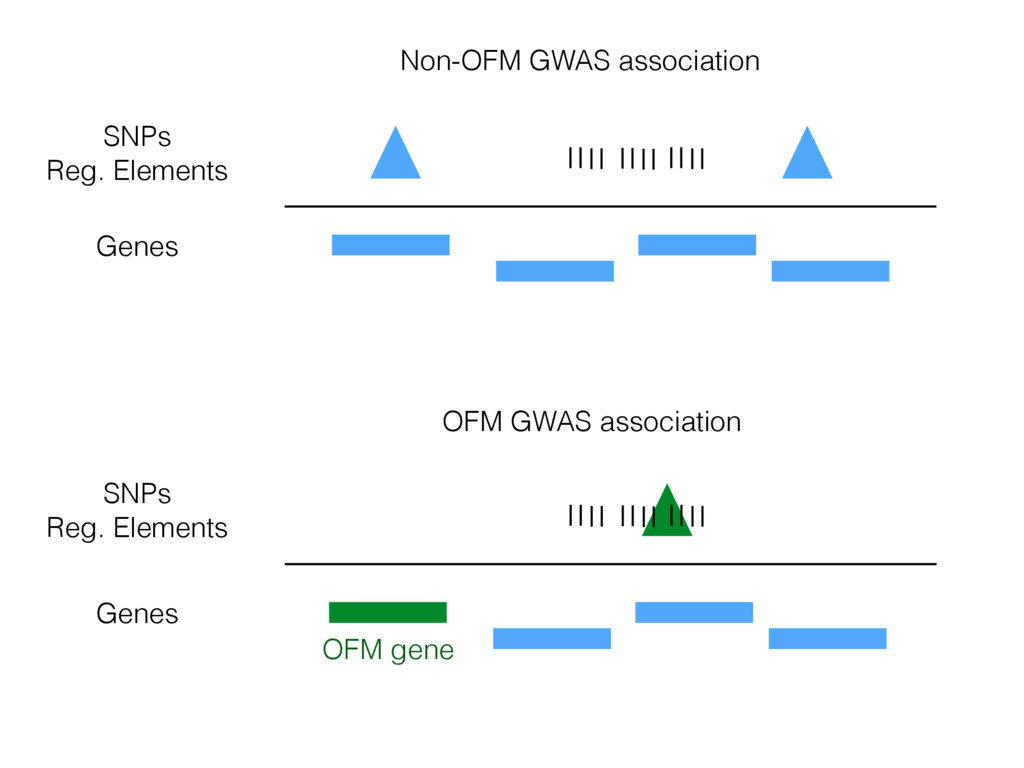
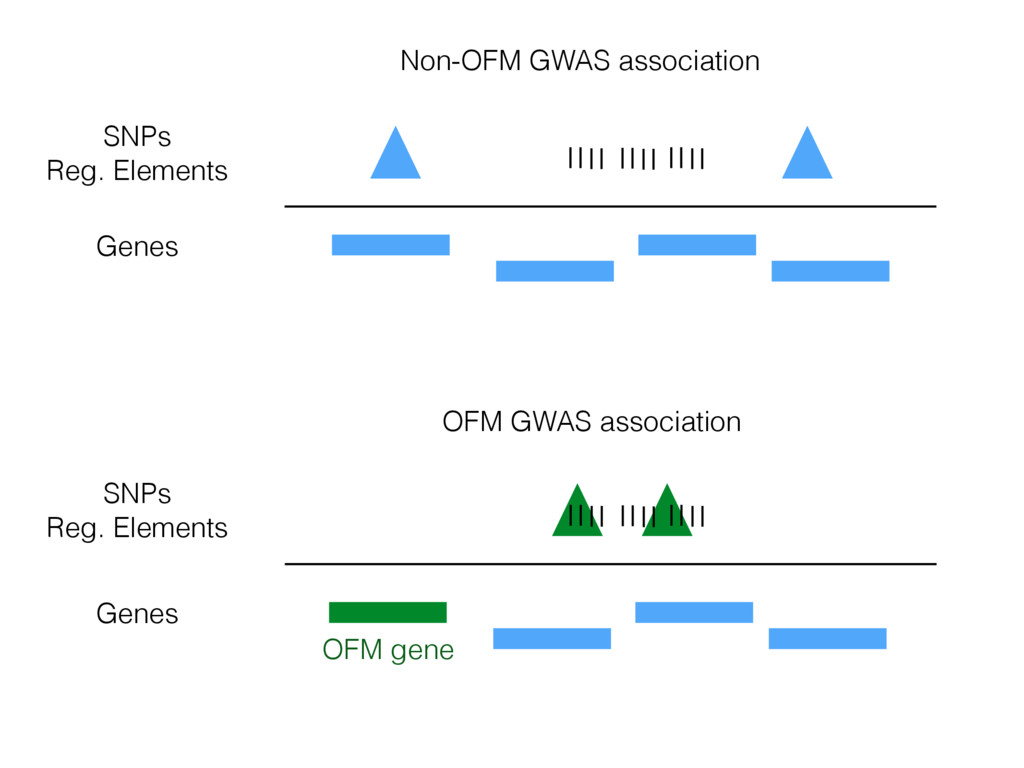
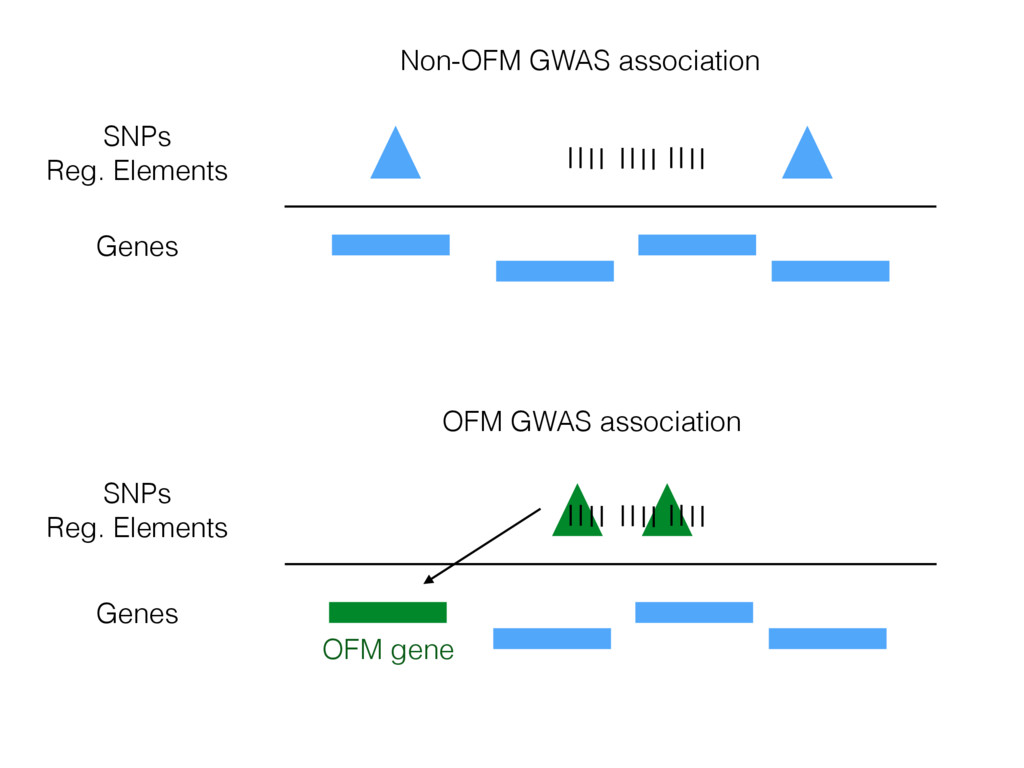
genes implicated by GWAS than expected by chance Genes implicated by GWAS Characterize modules; make predictions regarding causal genes and their mechanisms of action Genome-wide co-expression relationships from a disease-relevant tissue Co-expression Network The Approach
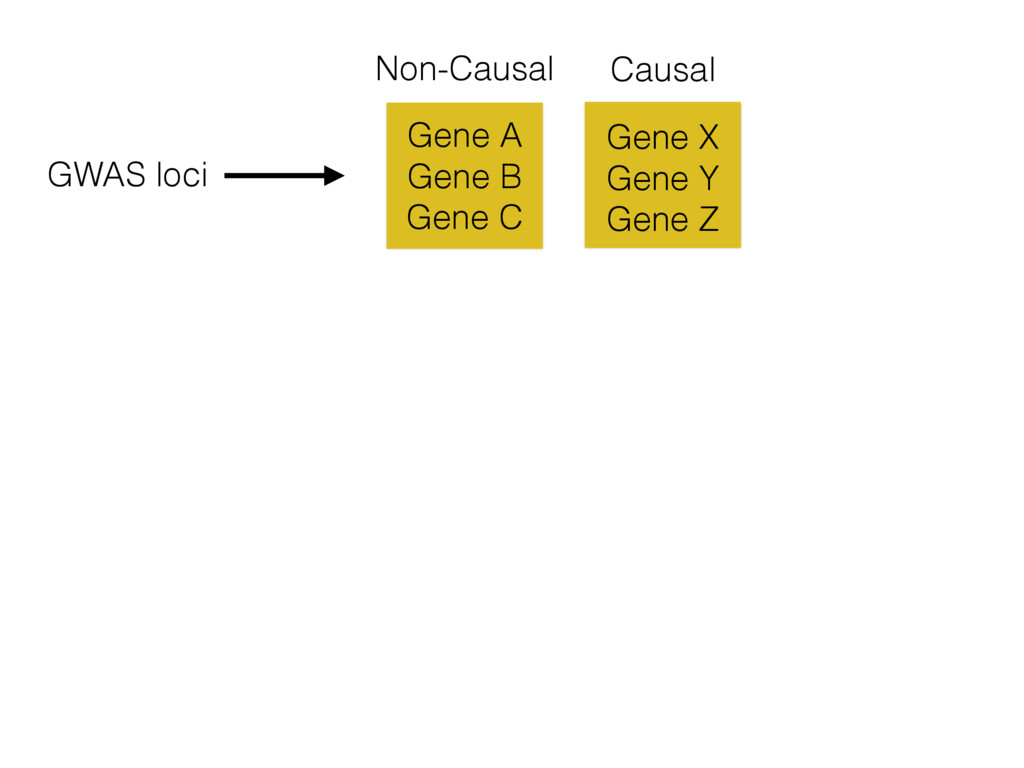
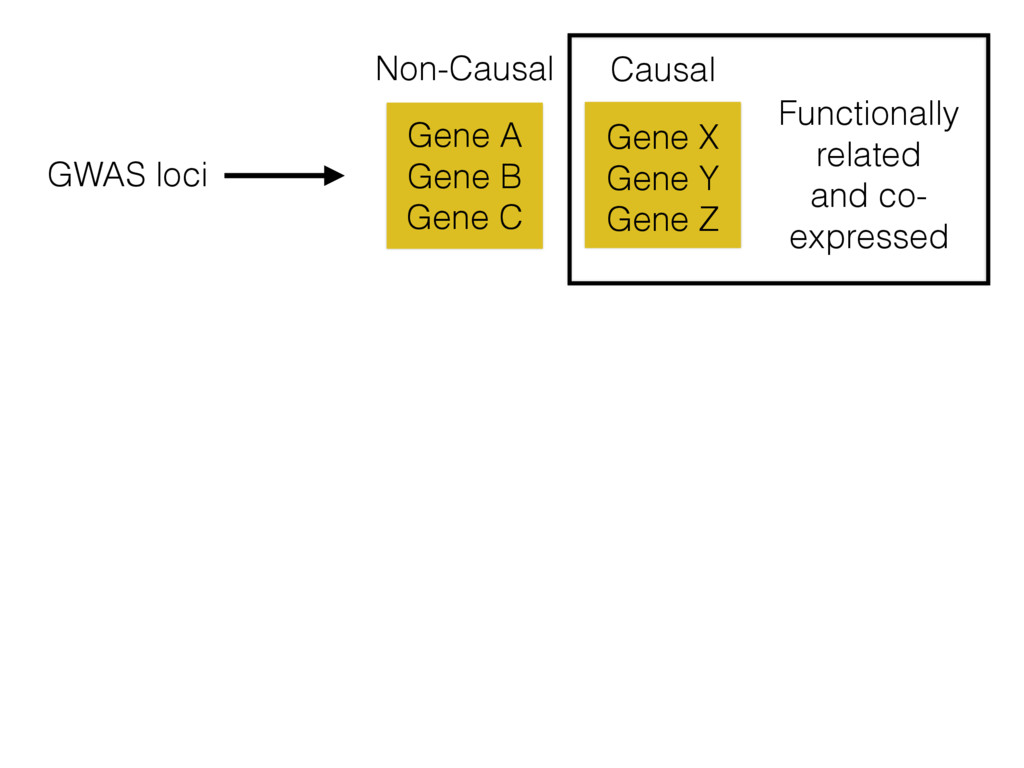
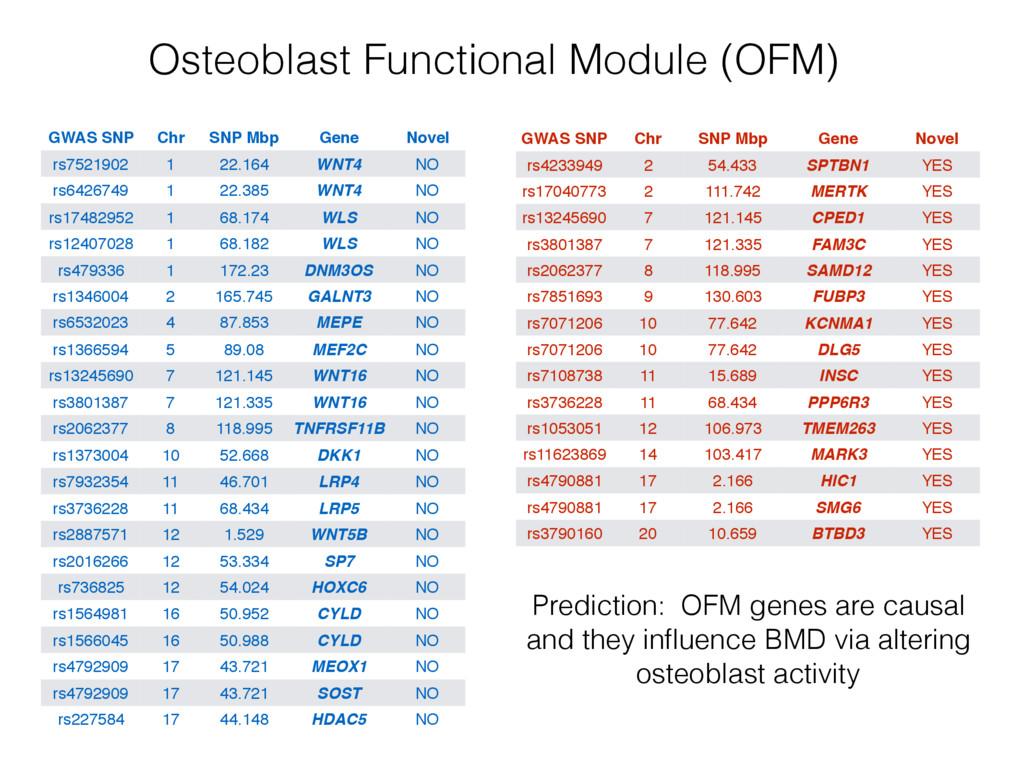
A Gene B Gene C Non-Causal Causal GWAS loci Functionally related and co- expressed Genes located within GWAS loci Gene X Gene Y Gene Z Prioritize Genes Predict Function
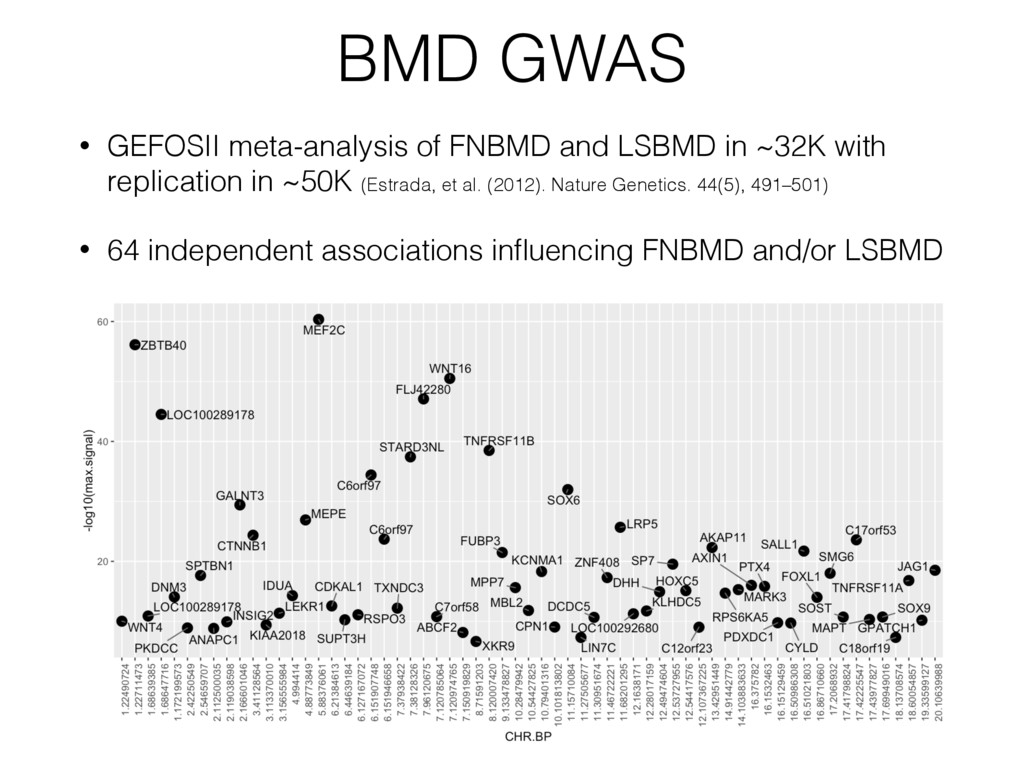
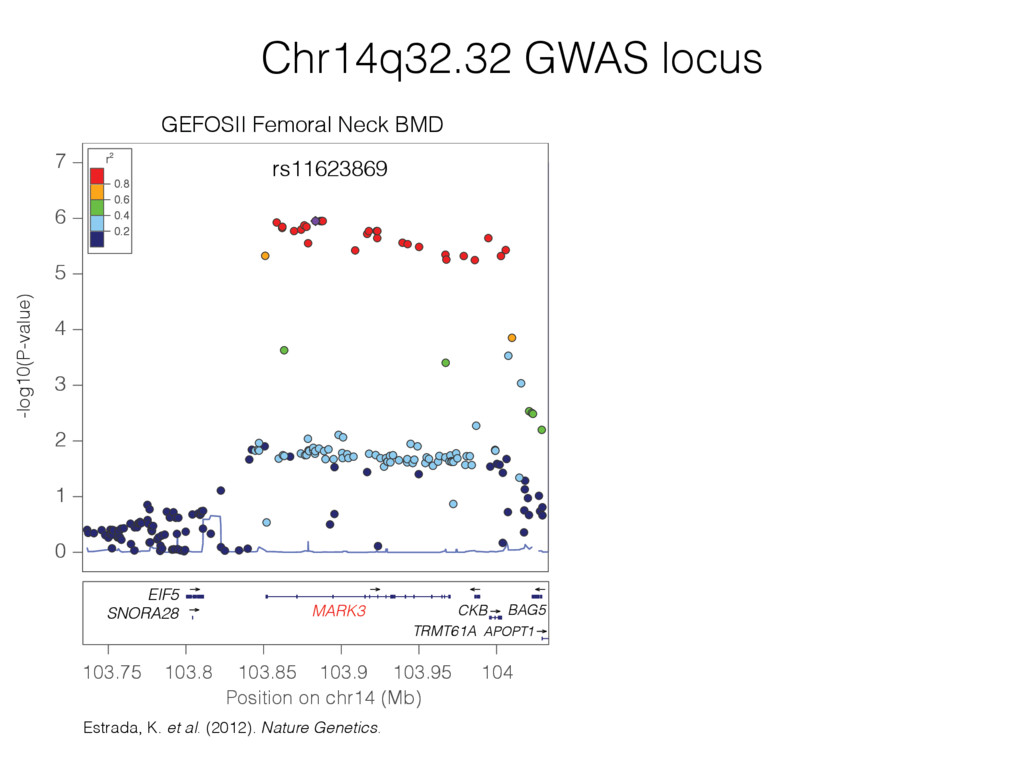
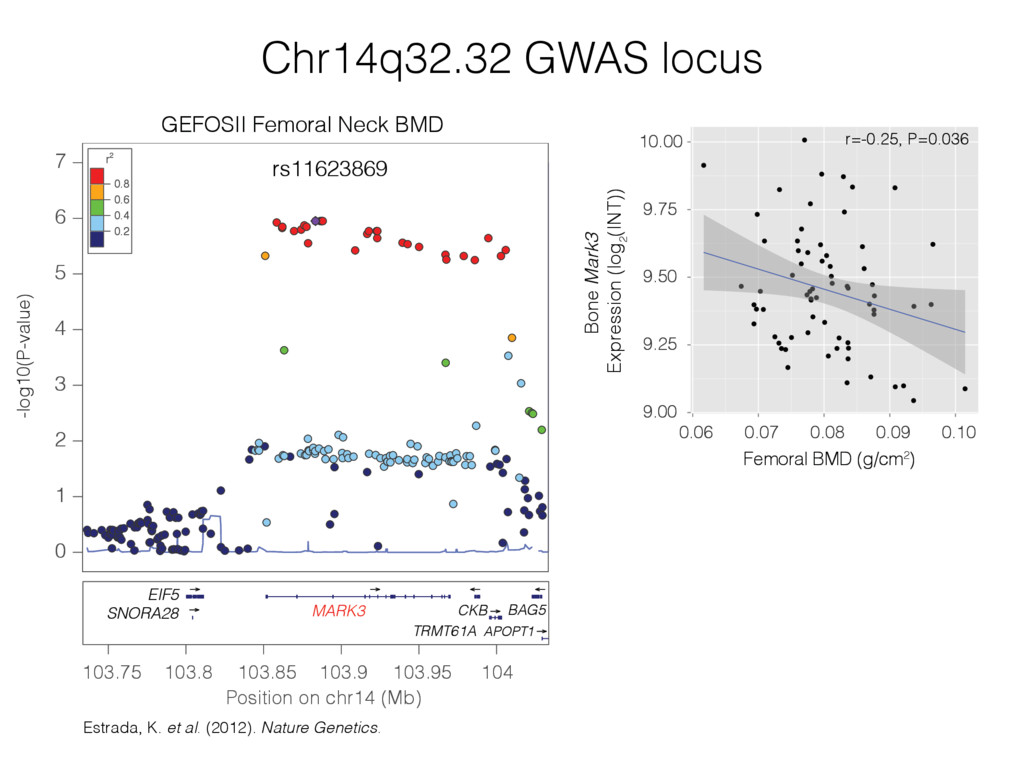
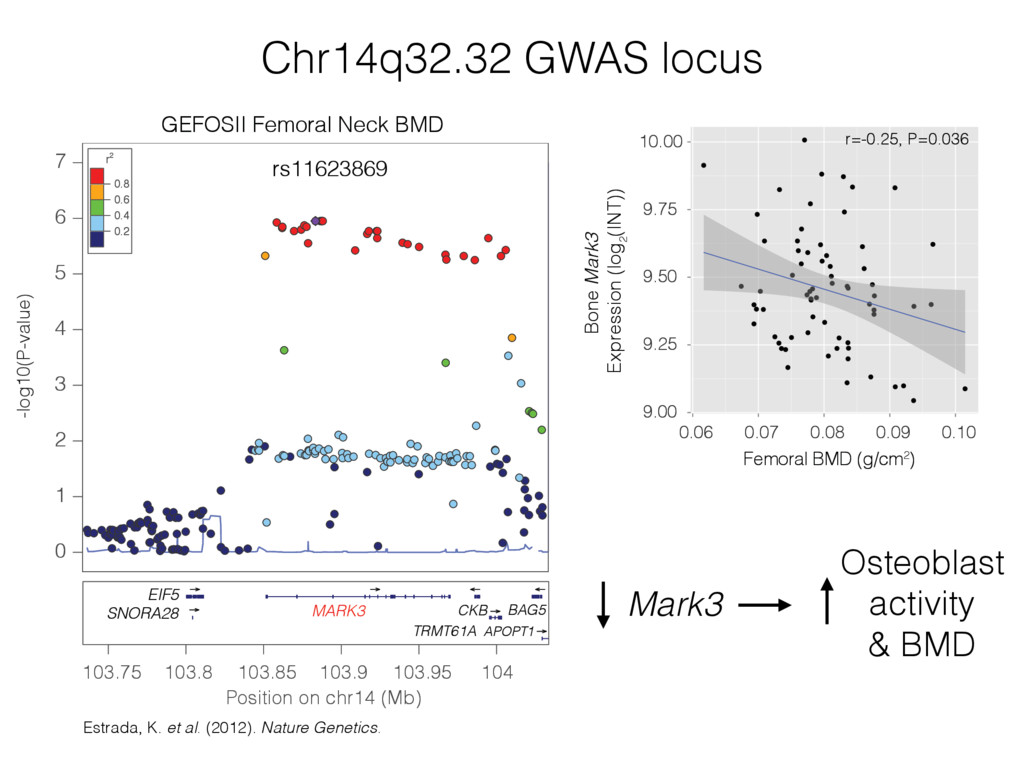
from male mice of 96 inbred mouse strains (Calabrese et al. 2012. PLoS Genetics) Genome-wide co-expression network GEFOSII BMD GWAS (N~80K) (Estrada, K., et al. 2012. Nature Genetics)
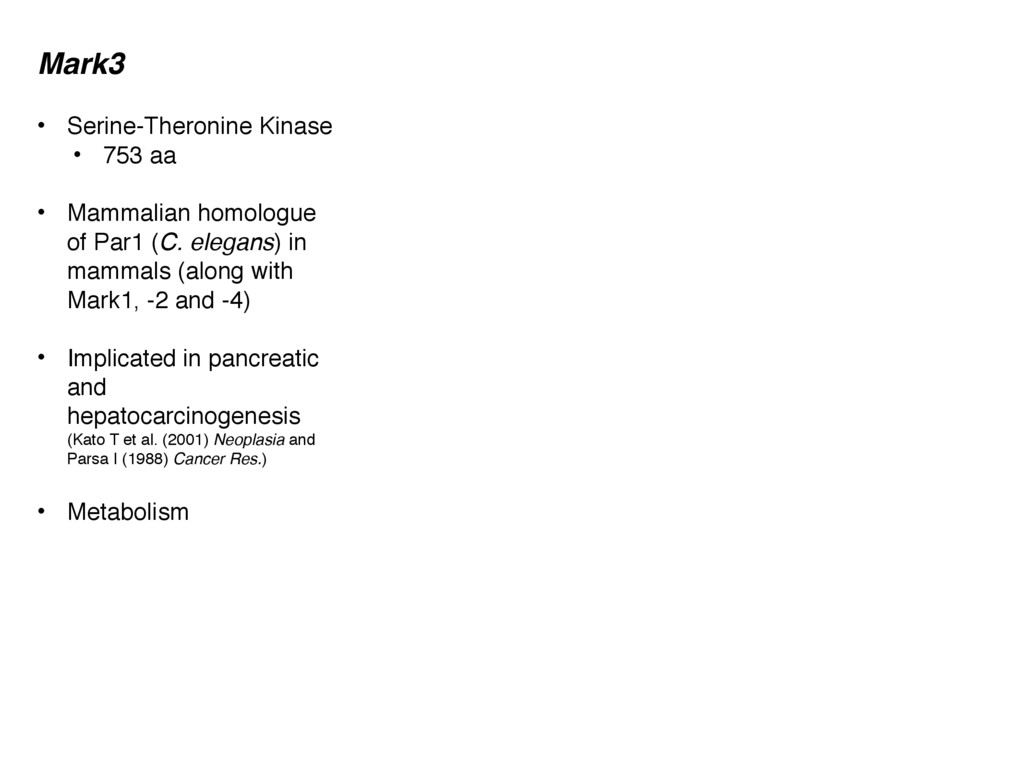
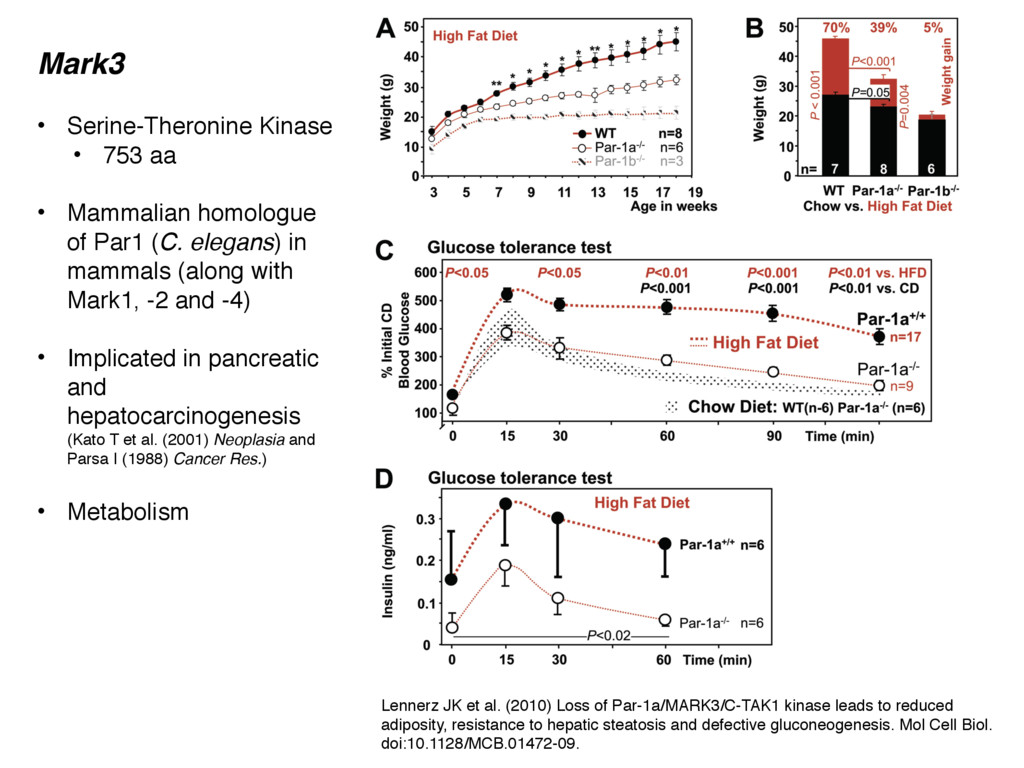
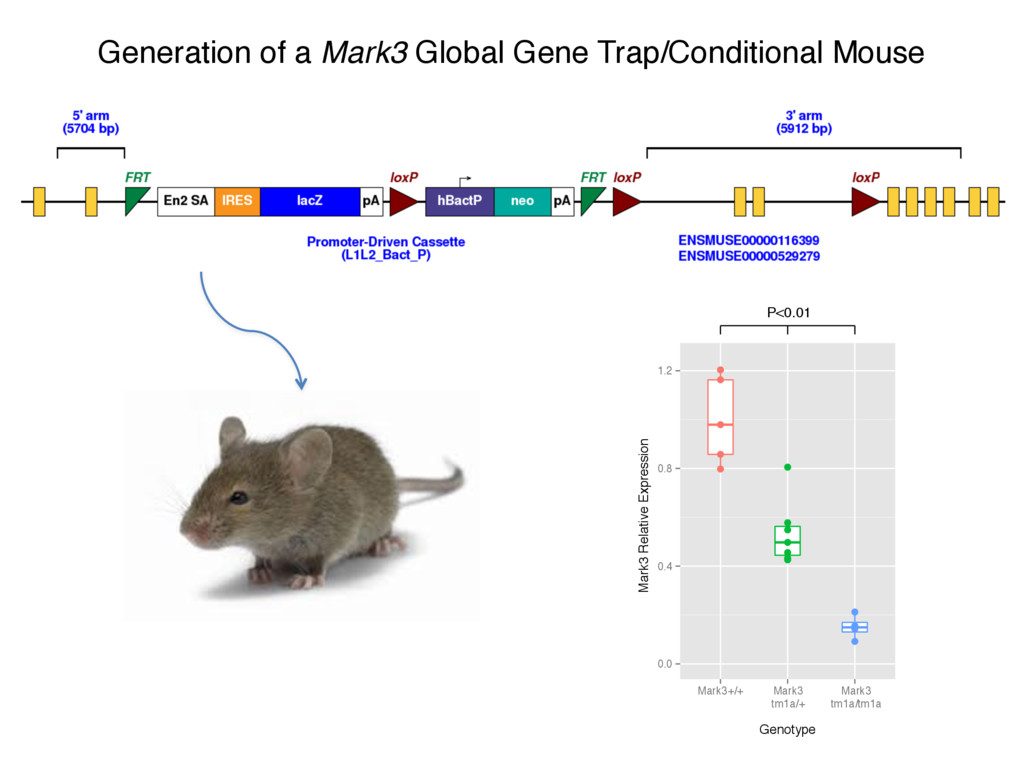
of Par1 (C. elegans) in mammals (along with Mark1, -2 and -4) • Implicated in pancreatic and hepatocarcinogenesis (Kato T et al. (2001) Neoplasia and Parsa I (1988) Cancer Res.) • Metabolism
to reduced adiposity, resistance to hepatic steatosis and defective gluconeogenesis. Mol Cell Biol. doi:10.1128/MCB.01472-09. Mark3 • Serine-Theronine Kinase • 753 aa • Mammalian homologue of Par1 (C. elegans) in mammals (along with Mark1, -2 and -4) • Implicated in pancreatic and hepatocarcinogenesis (Kato T et al. (2001) Neoplasia and Parsa I (1988) Cancer Res.) • Metabolism
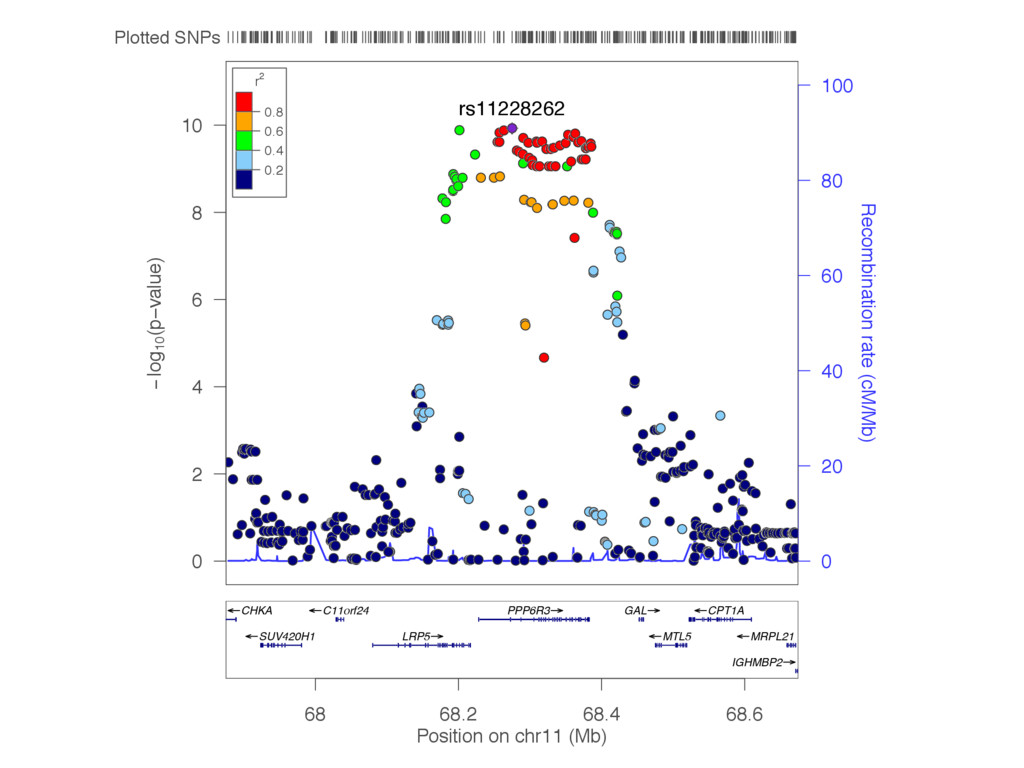
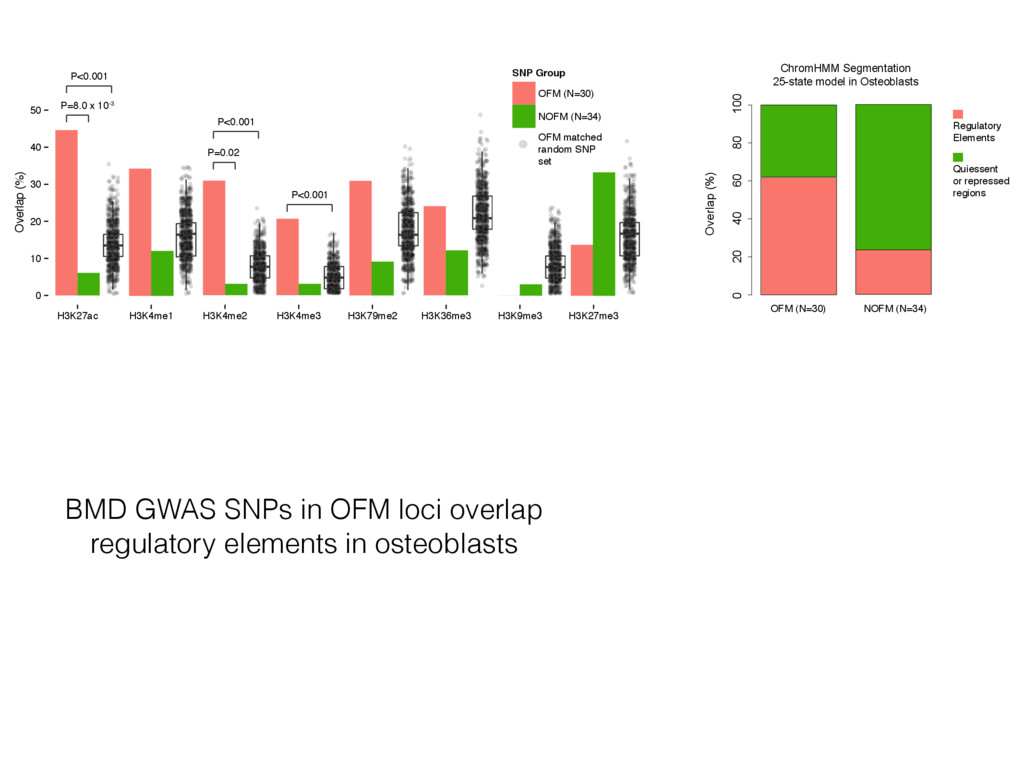
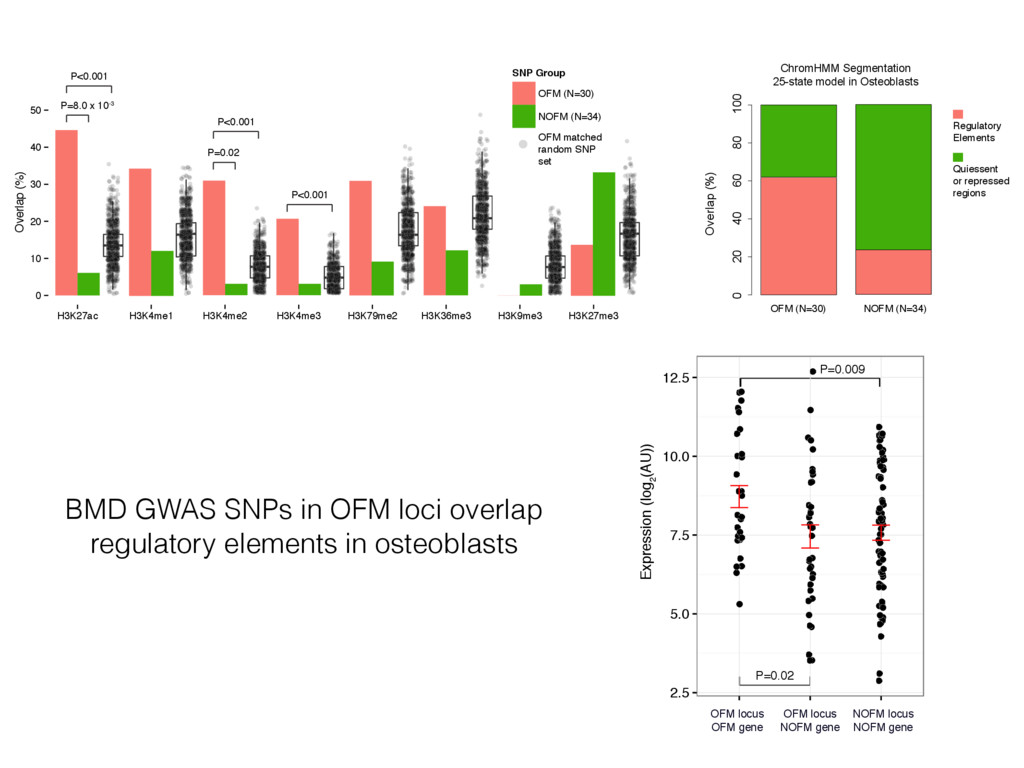
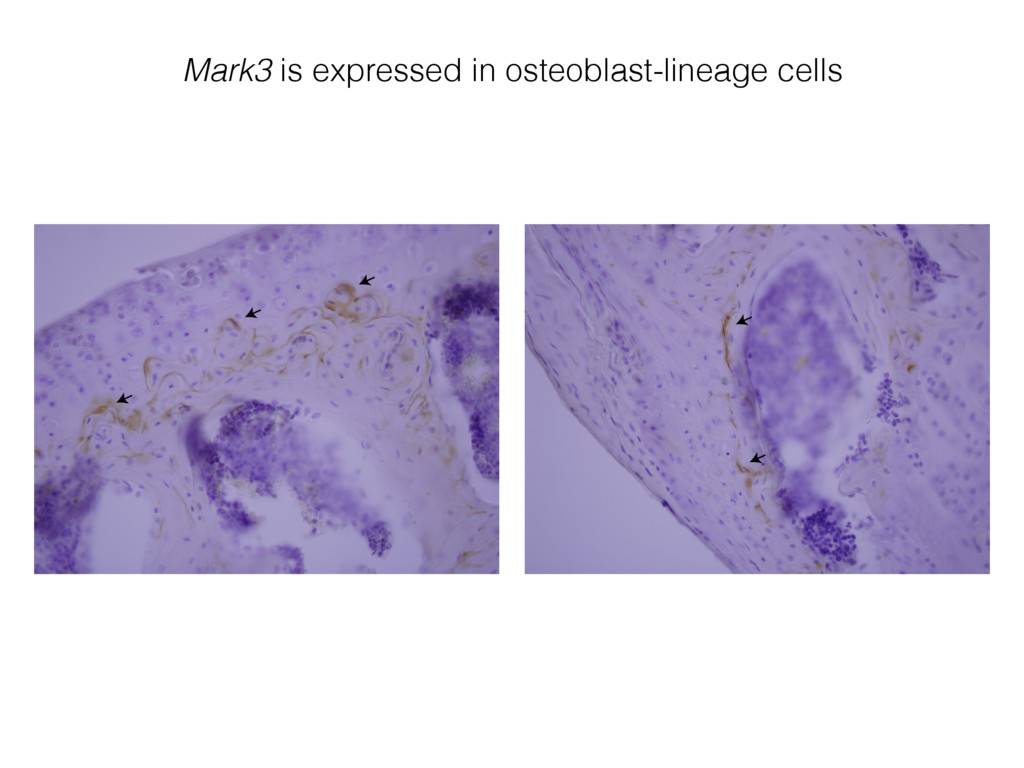
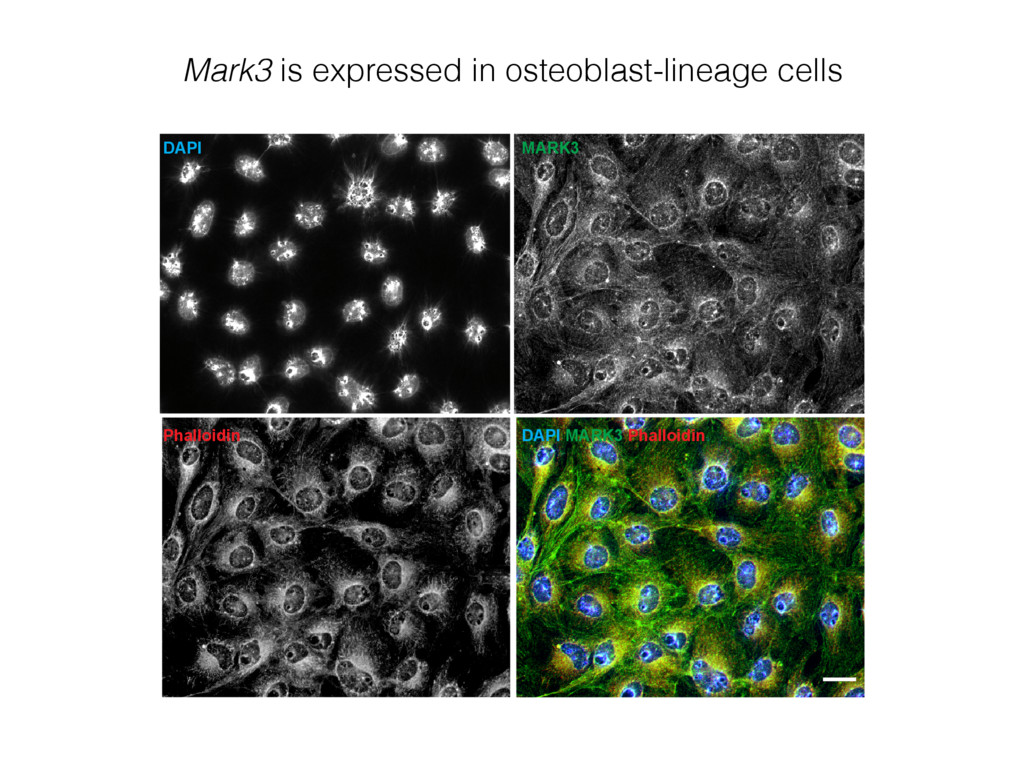
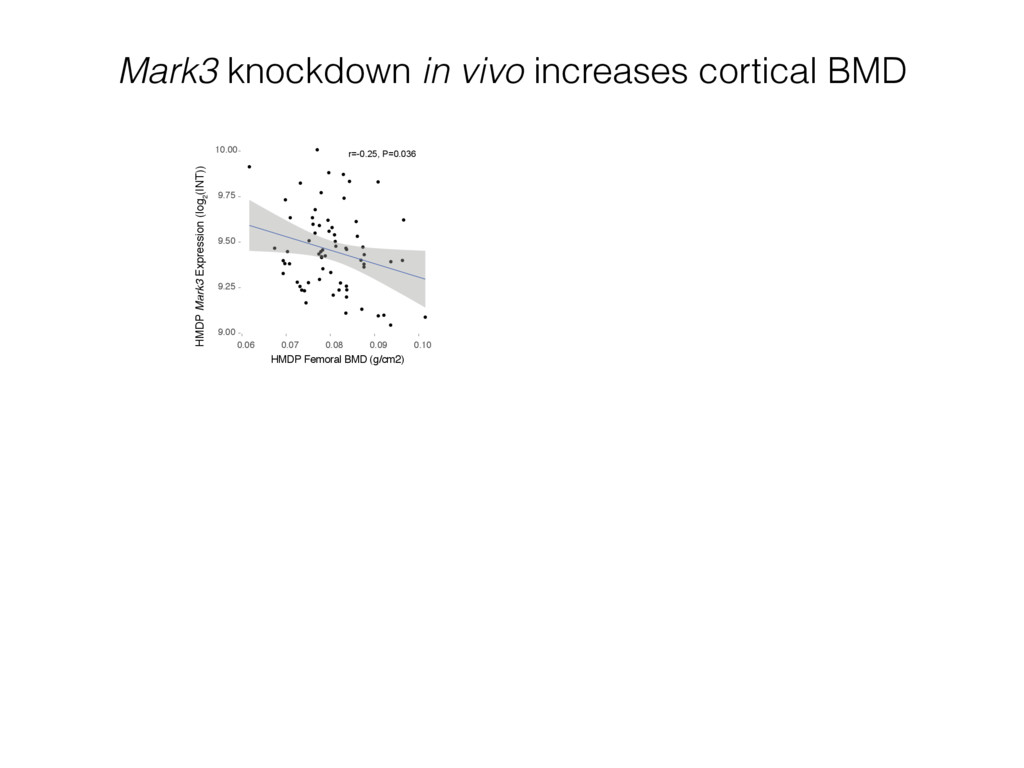
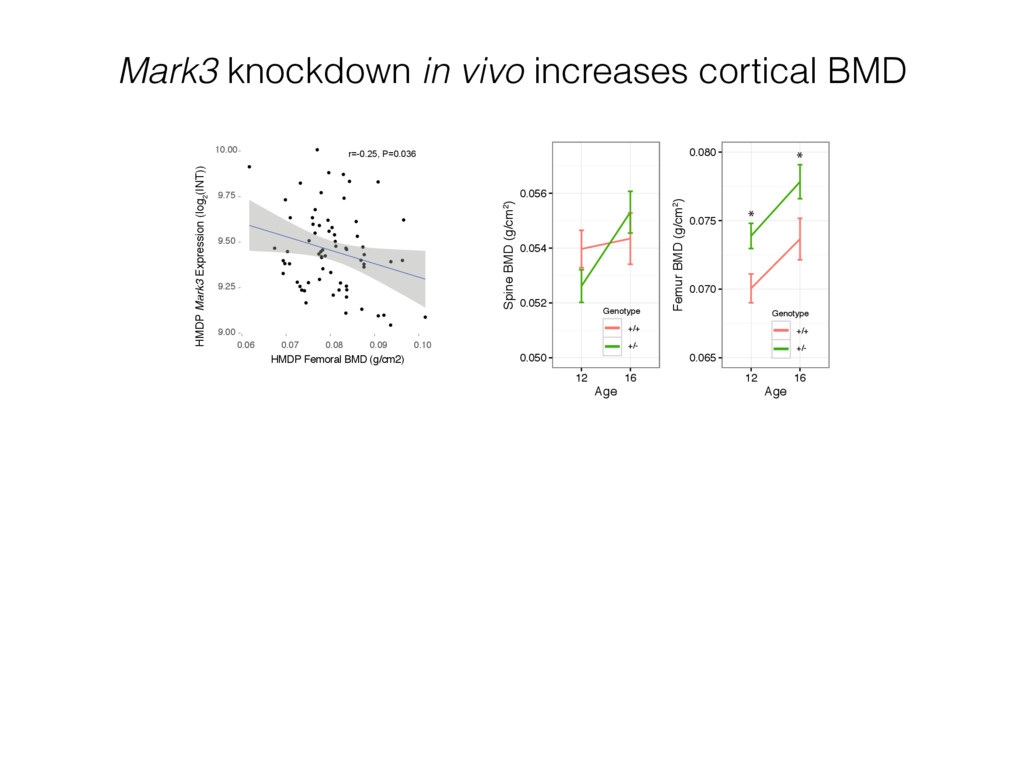
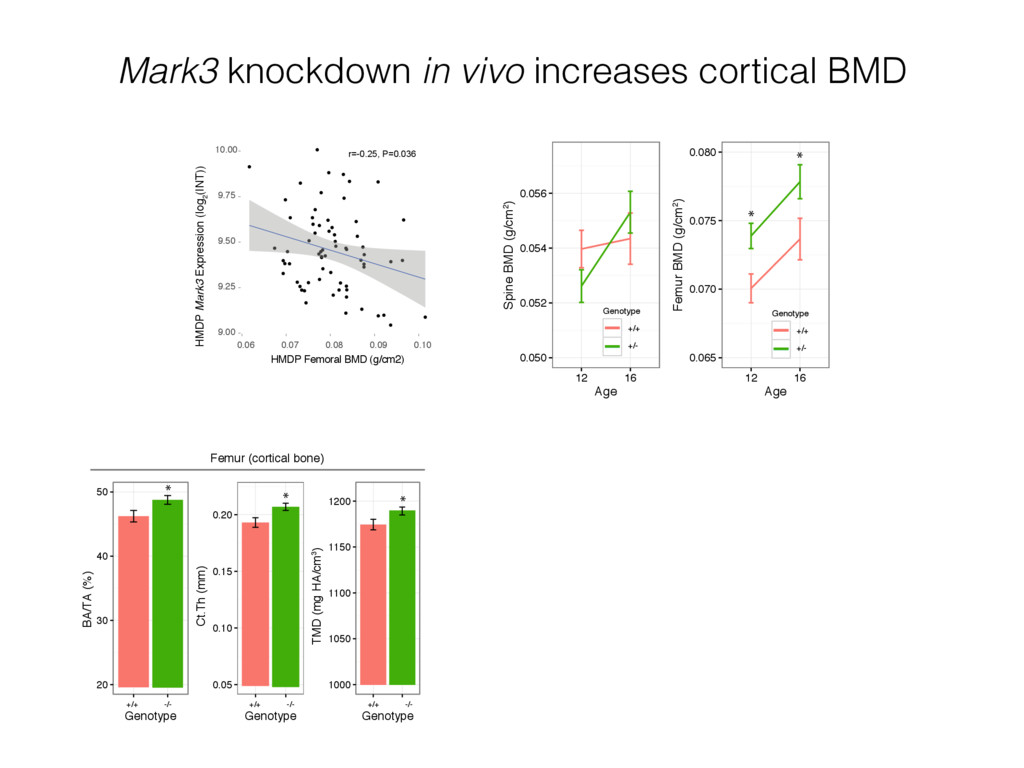
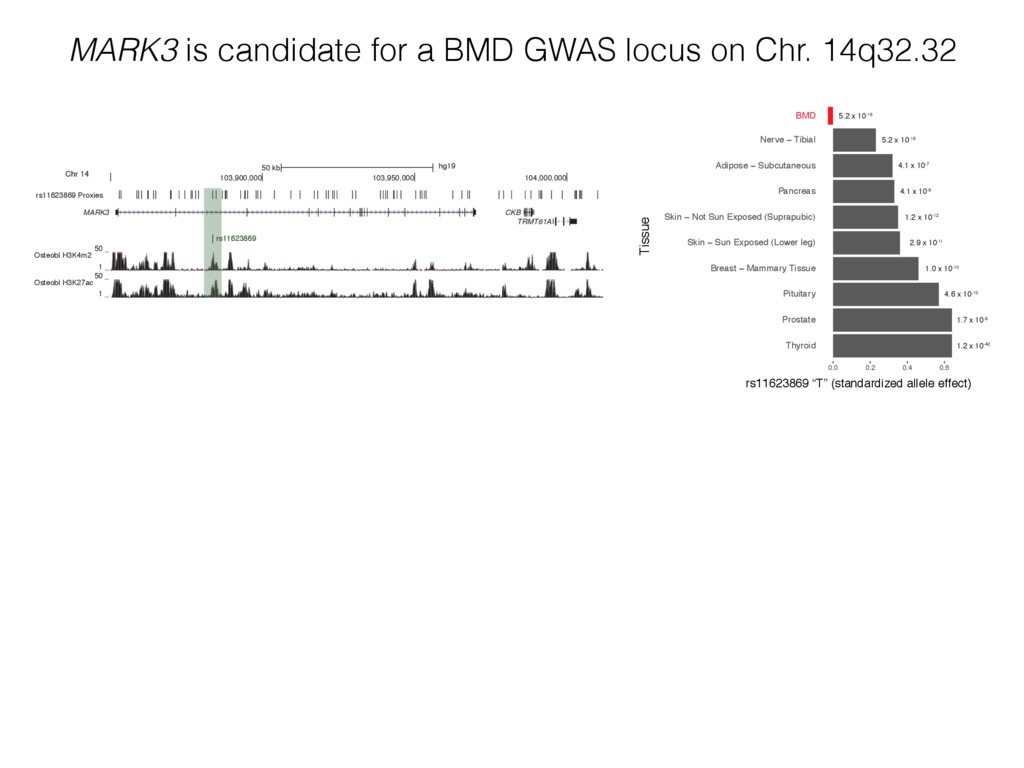
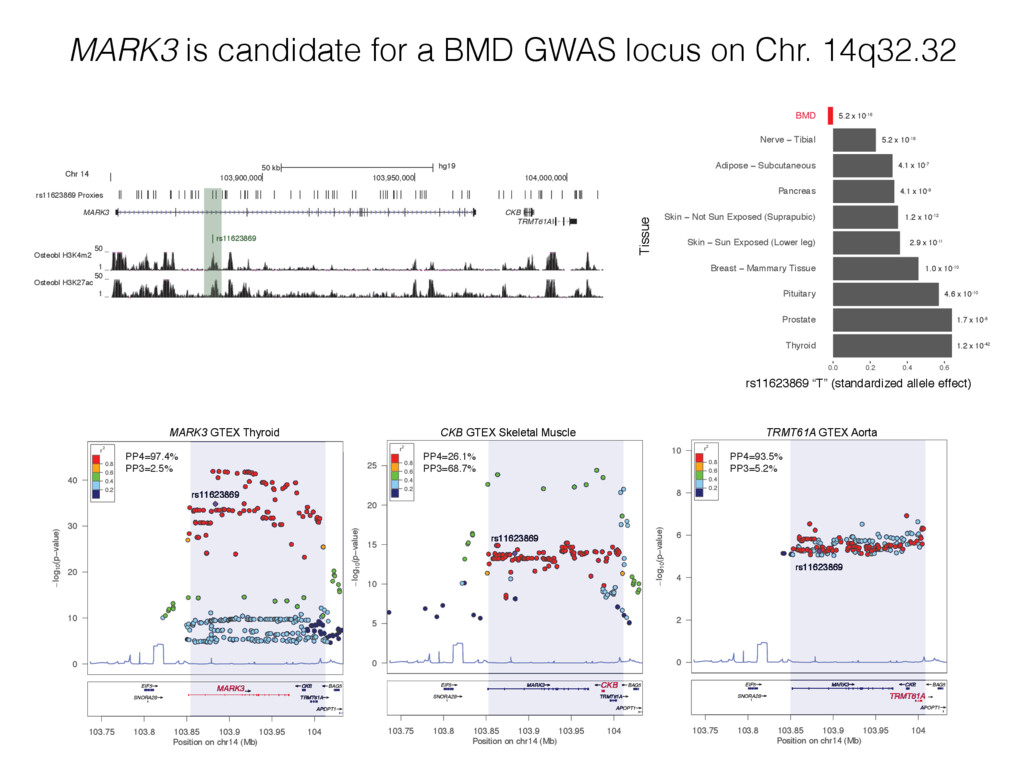
TRMT61A rs11623869 Osteobl H3K4m2 50 _ 1 _ Osteobl H3K27ac 50 _ 1 _ Chr 14 Thyroid Prostate Pituitary Breast − Mammary Tissue Skin − Sun Exposed (Lower leg) Skin − Not Sun Exposed (Suprapubic) Pancreas Adipose − Subcutaneous Nerve − Tibial 0.0 0.2 0.4 0.6 rs11623869 “T” (standardized allele effect) Tissue BMD 5.2 x 10⁻¹⁶ 5.2 x 10⁻¹⁶ 1.2 x 10⁻¹² 4.1 x 10⁻⁷ 4.1 x 10⁻⁹ 2.9 x 10⁻¹¹ 1.0 x 10⁻¹⁰ 4.6 x 10⁻¹⁰ 1.7 x 10⁻⁸ 1.2 x 10-42 MARK3 is candidate for a BMD GWAS locus on Chr. 14q32.32
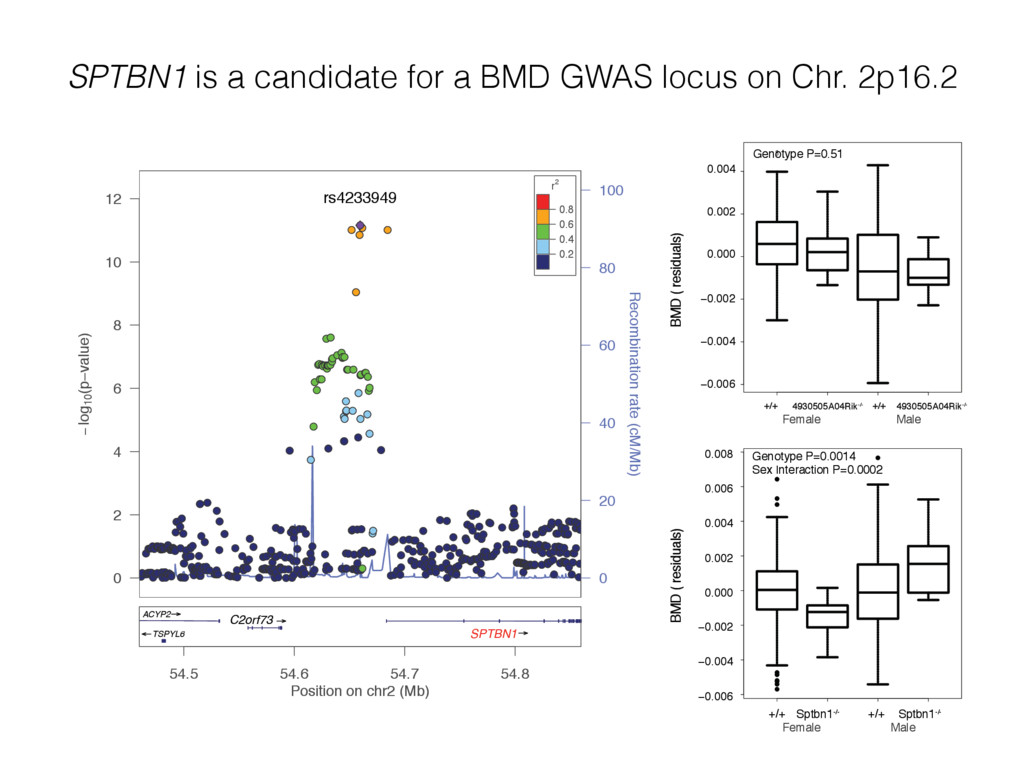
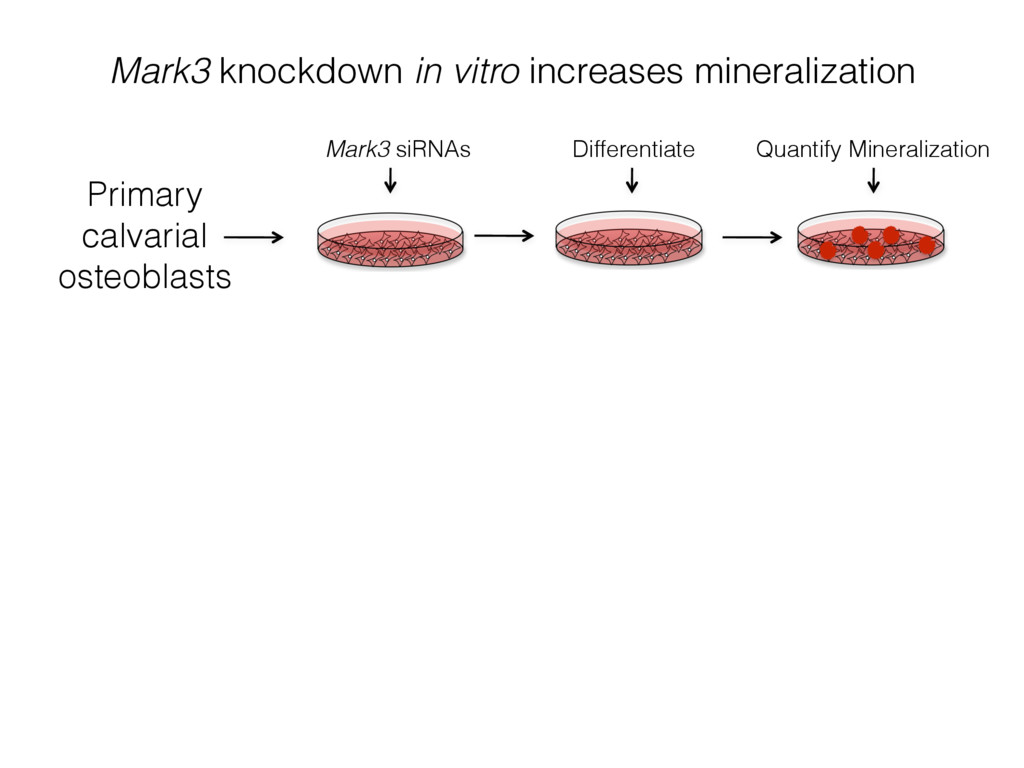
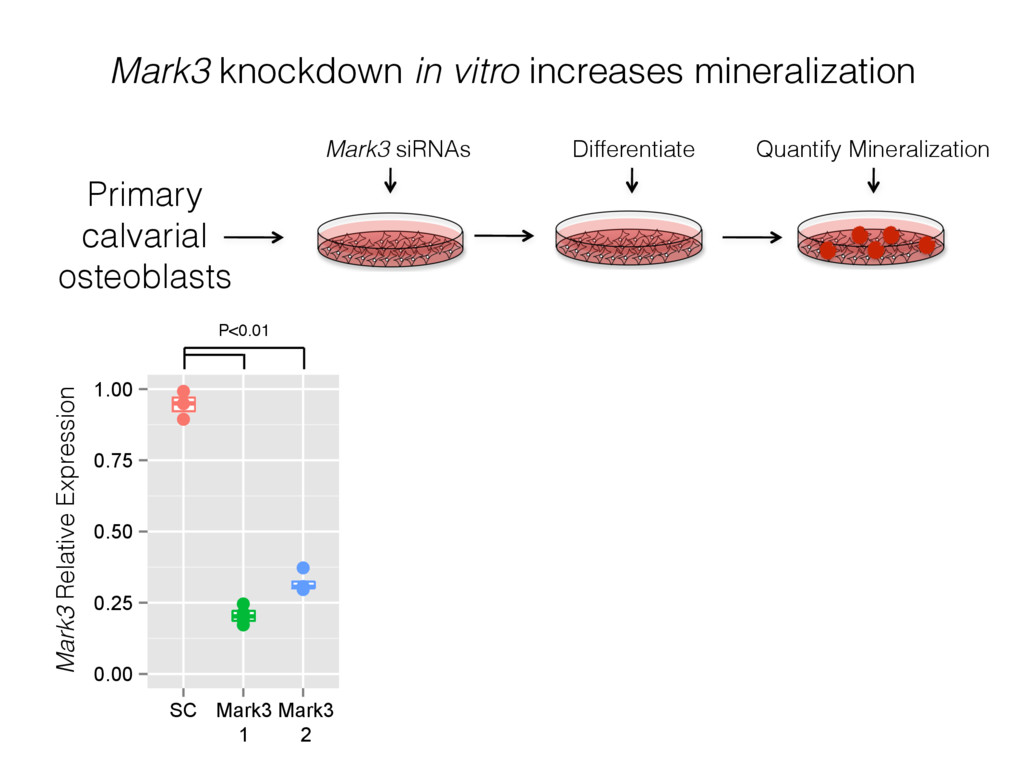
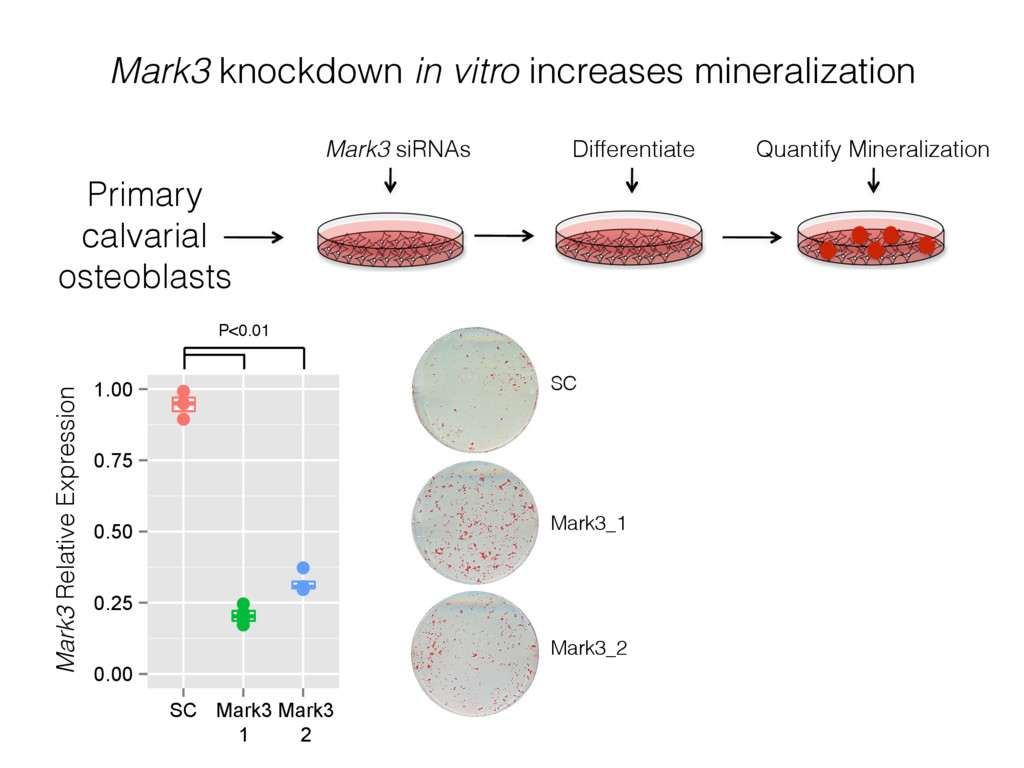
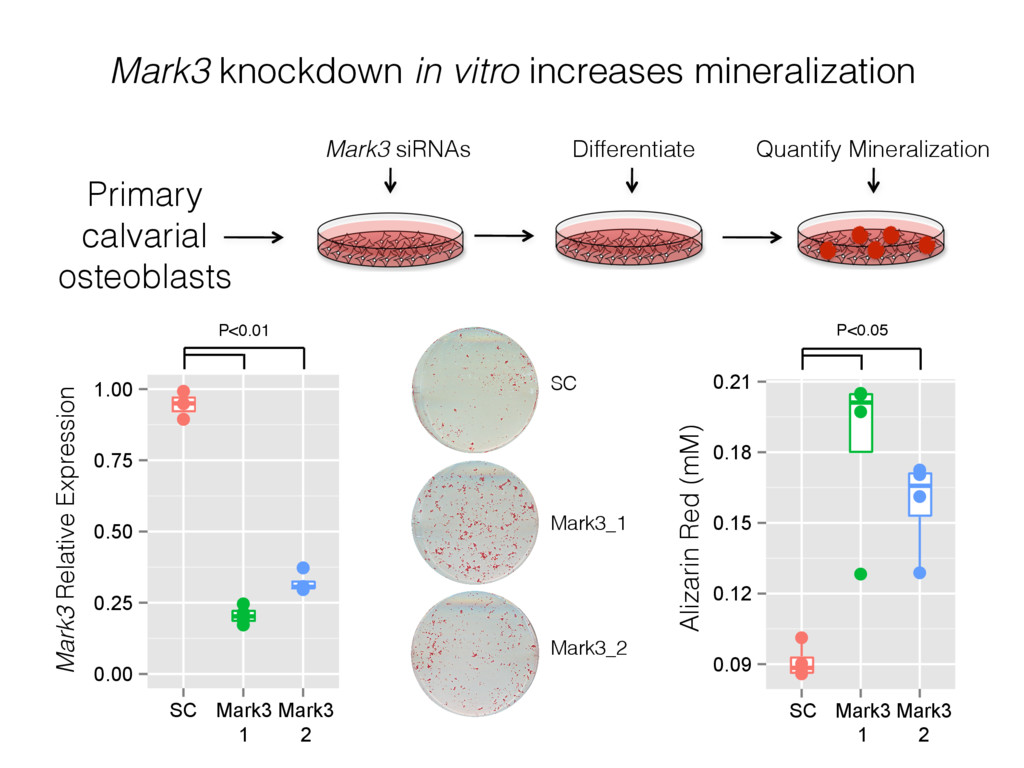
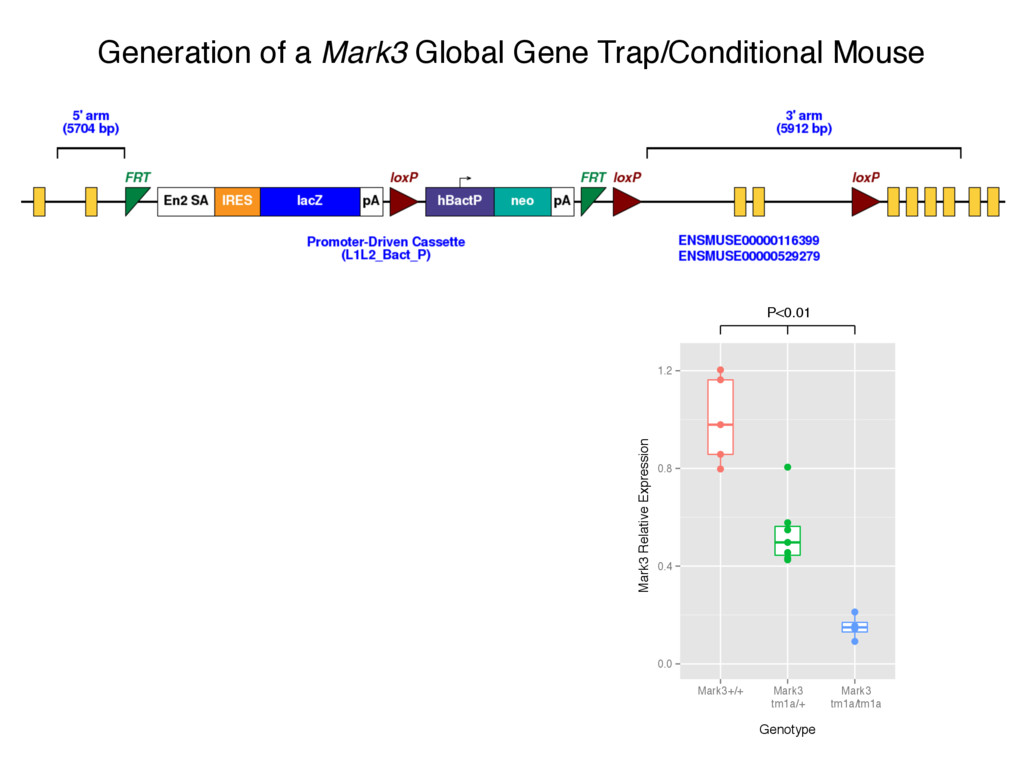
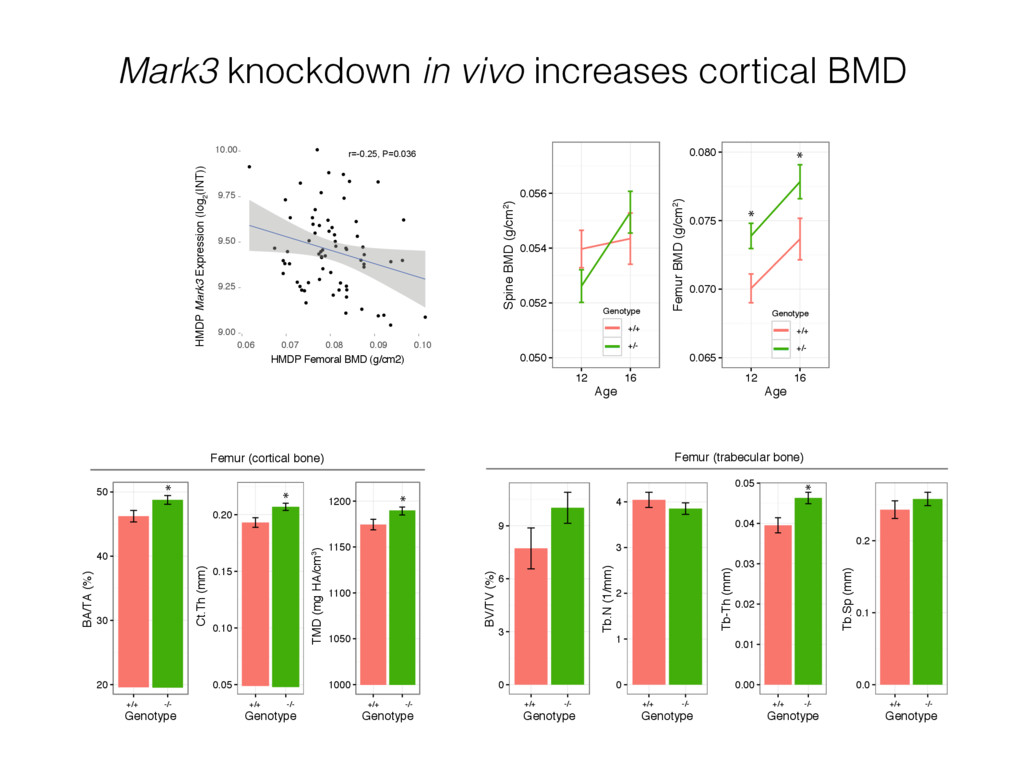
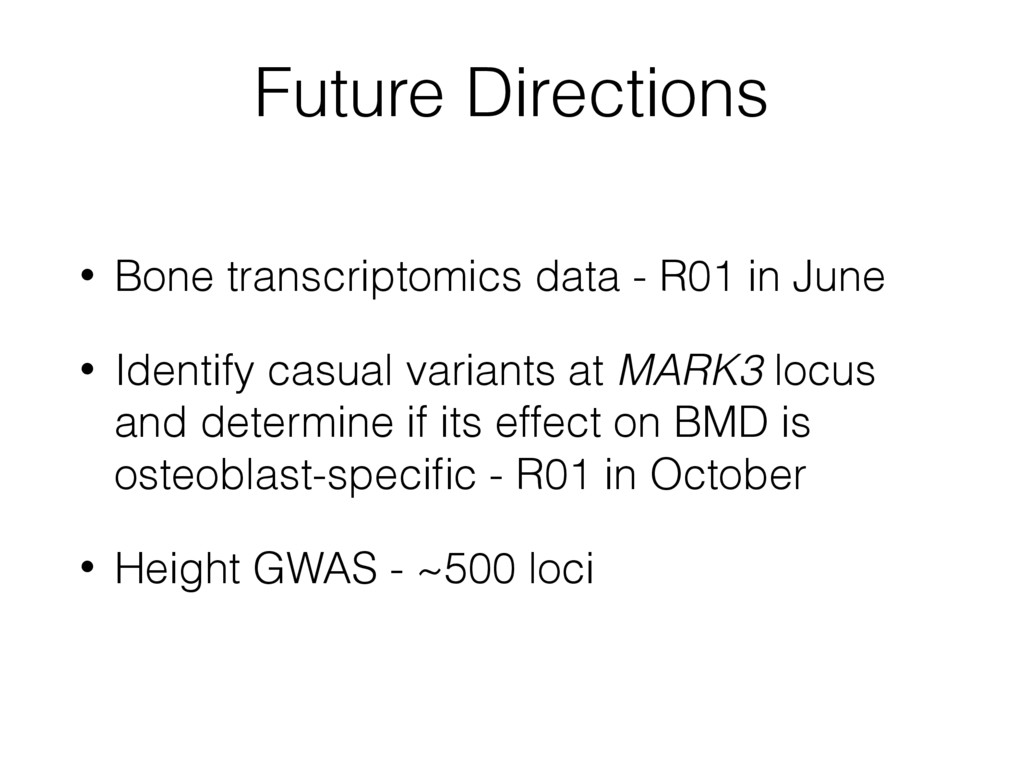
network we predicted causal genes for 30 of 64 GWAS loci • MARK3 is likely responsible for a GWAS locus on Chr. 14q32.32 • Approach could be useful for GWAS for many diseases
Olivia Sabik • Basel Al-Barghouthi UCLA • Jake Lusis, Ph.D. • Brian Bennett, Ph.D. • Luz Orozco, Ph.D. • Calvin Pan • Anatole Ghazalpour, Ph.D. • Hyun Min Kang, Ph.D. • Eleazar Eskin, Ph.D. Maine Medical Center Research Institute • Cliff Rosen, M.D. Yale • Mark C. Horowitz, Ph.D. • Steve Tommasini, Ph.D. University of Maryland • Joe Stains, Ph.D. R01-AR057759 R01-AR064790 R01-AR068345