Center for Public Health Genomics, University of Virginia @cr_farber [email protected] farberlab.com University Program in Genetics and Genomics, Tuesday Seminar, Duke, 11/16/15 Slides on speakerdeck.com
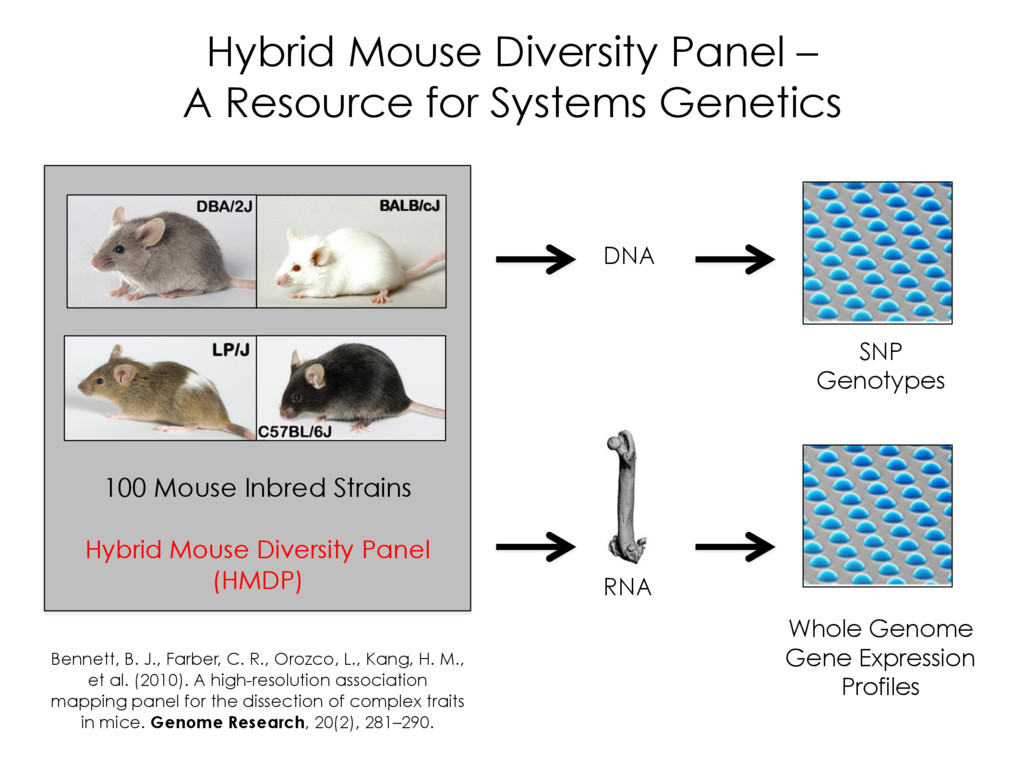
Genetics 100 Mouse Inbred Strains Whole Genome Gene Expression Profiles SNP Genotypes DNA RNA Hybrid Mouse Diversity Panel (HMDP) Bennett, B. J., Farber, C. R., Orozco, L., Kang, H. M., et al. (2010). A high-resolution association mapping panel for the dissection of complex traits in mice. Genome Research, 20(2), 281–290.
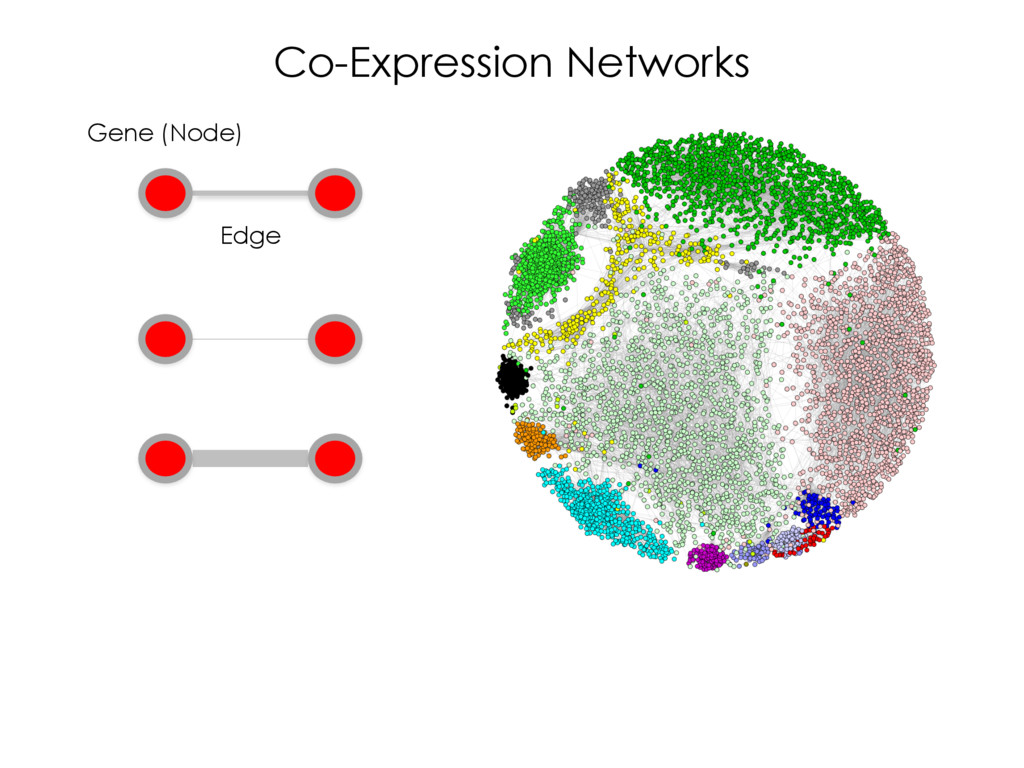
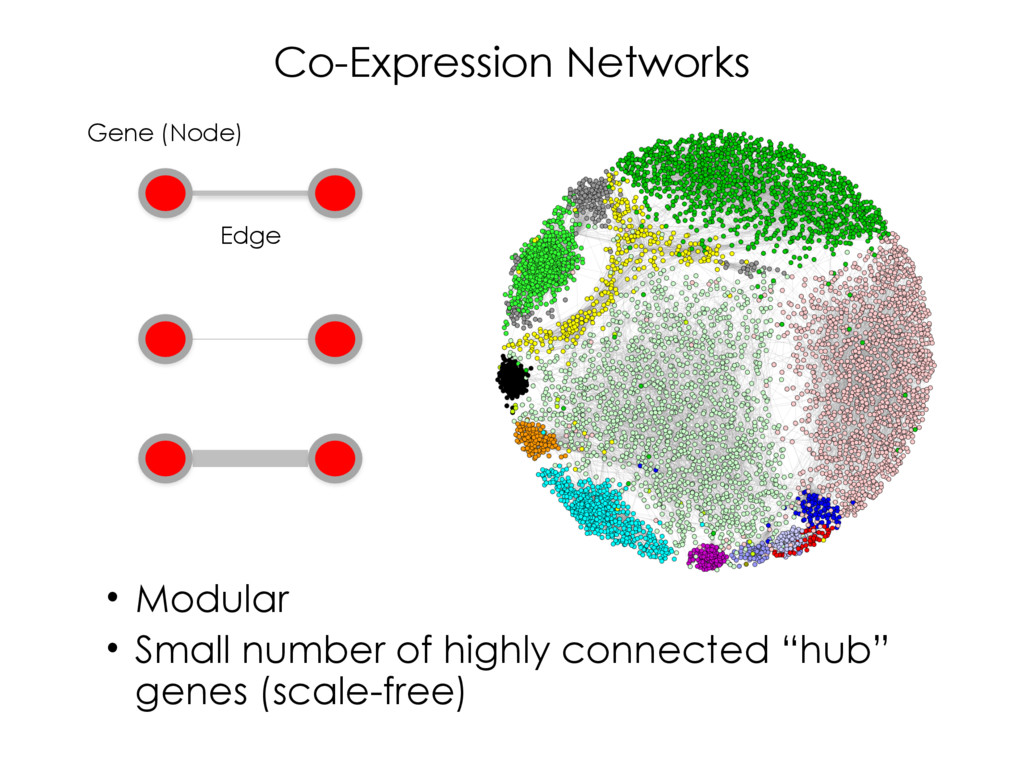
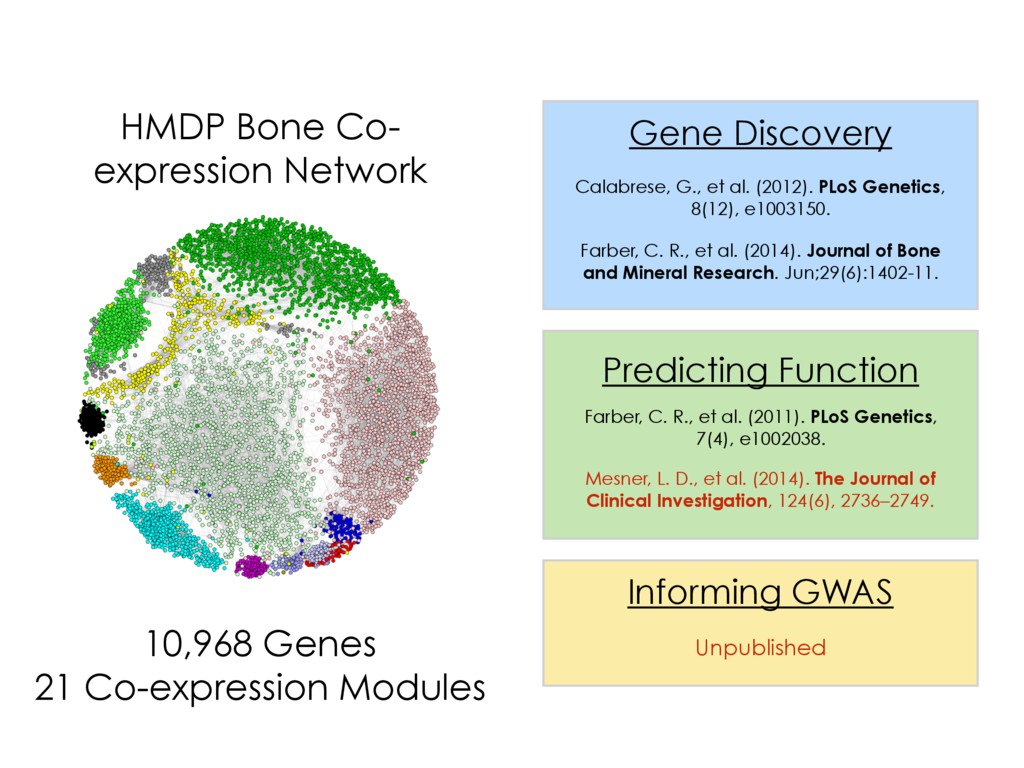
et al. (2014). The Journal of Clinical Investigation, 124(6), 2736–2749. Farber, C. R., et al. (2011). PLoS Genetics, 7(4), e1002038. Gene Discovery Farber, C. R., et al. (2014). Journal of Bone and Mineral Research. Jun;29(6):1402-11. Calabrese, G., et al. (2012). PLoS Genetics, 8(12), e1003150. Informing GWAS Unpublished 10,968 Genes 21 Co-expression Modules
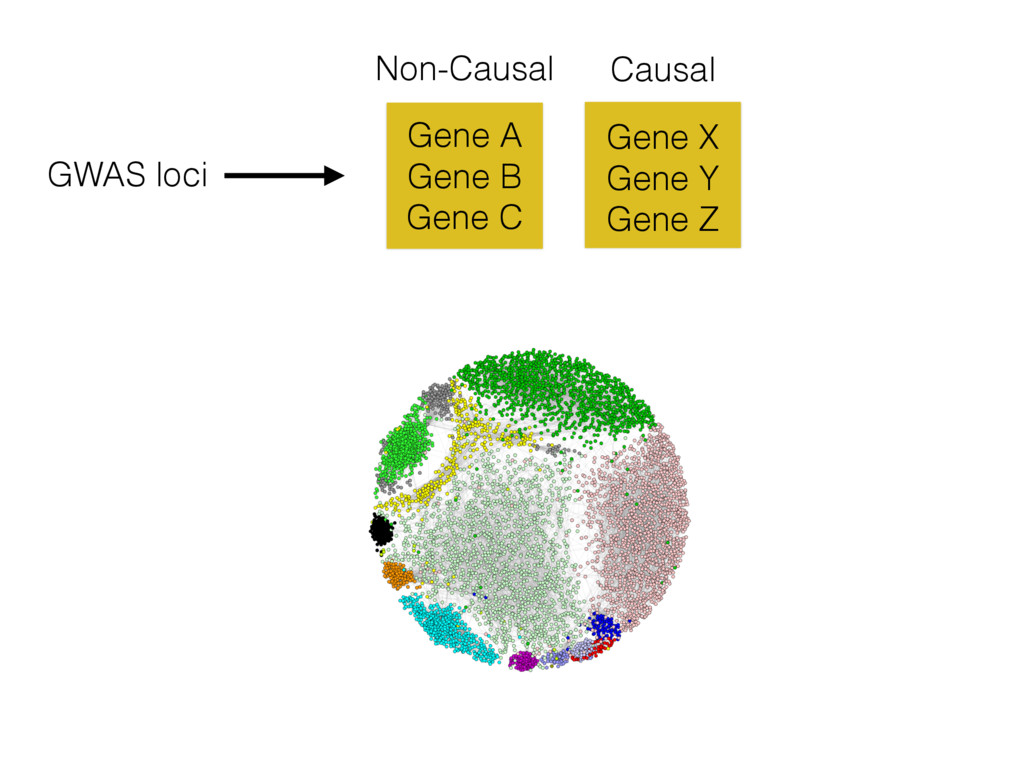
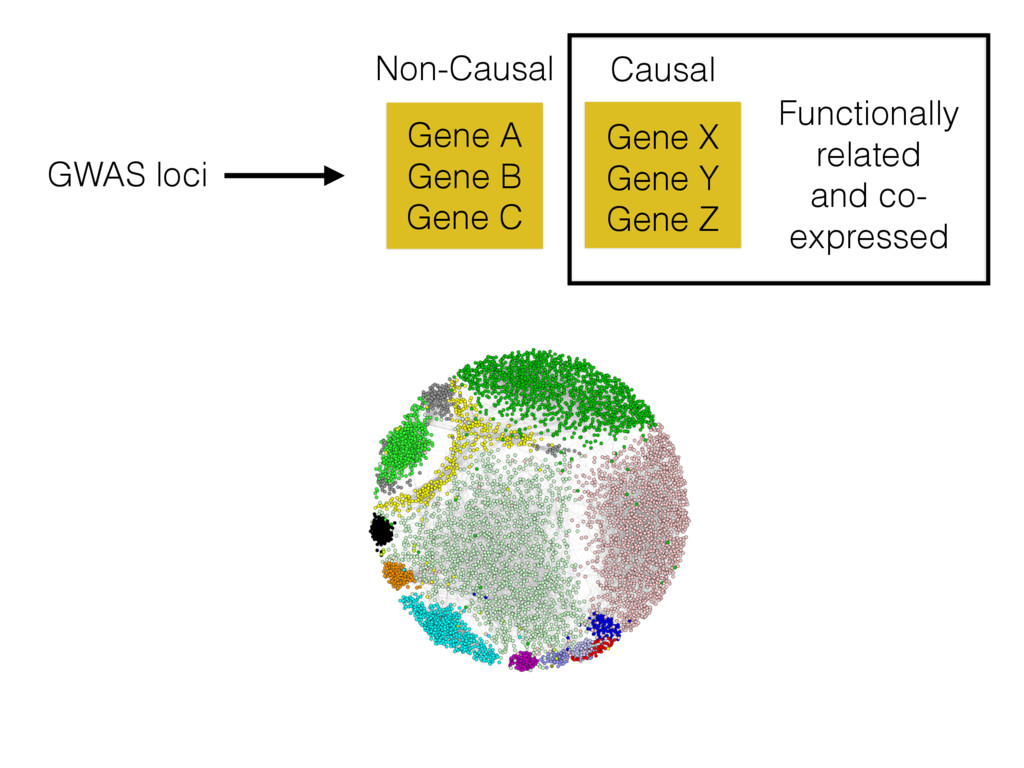
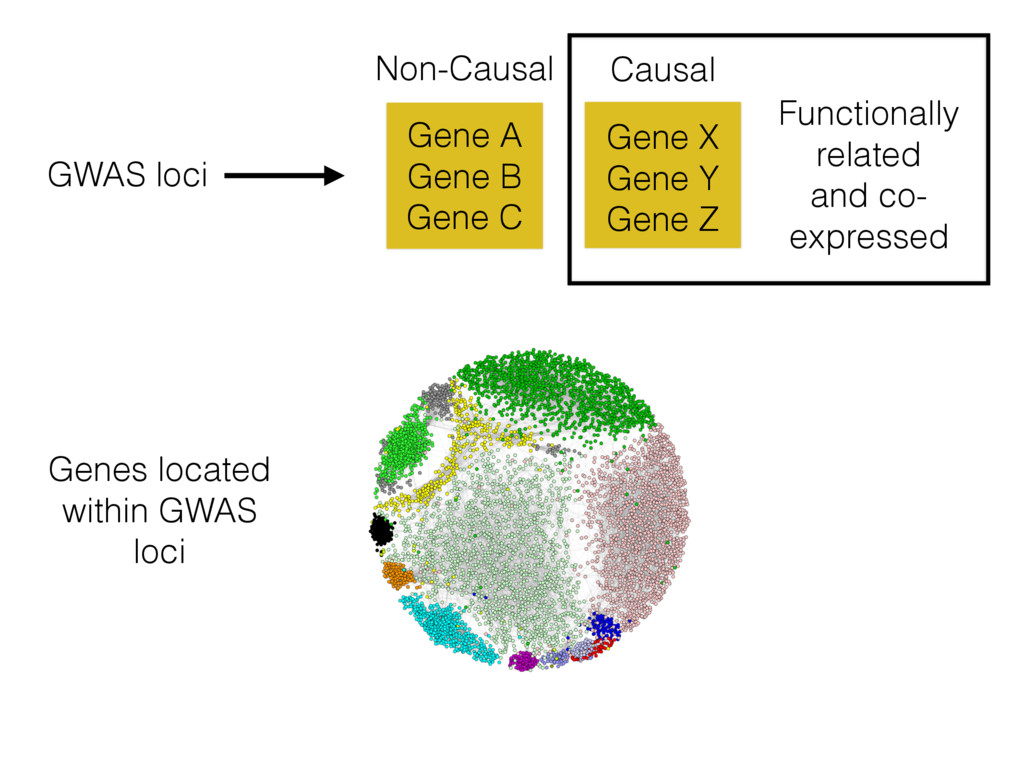
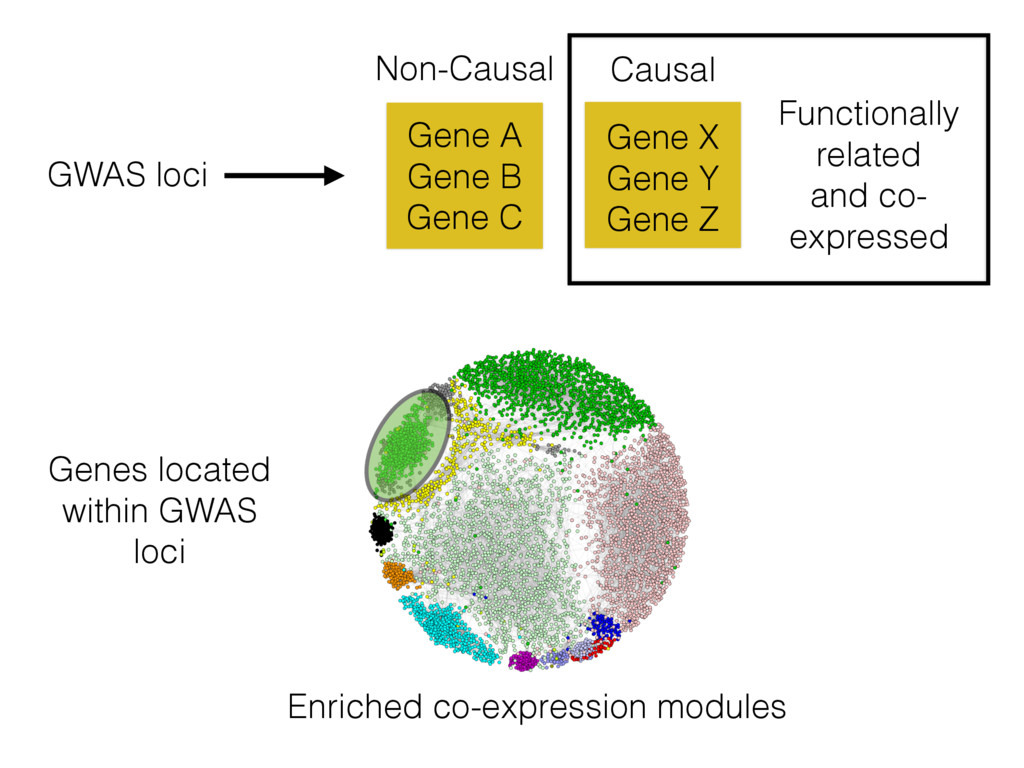
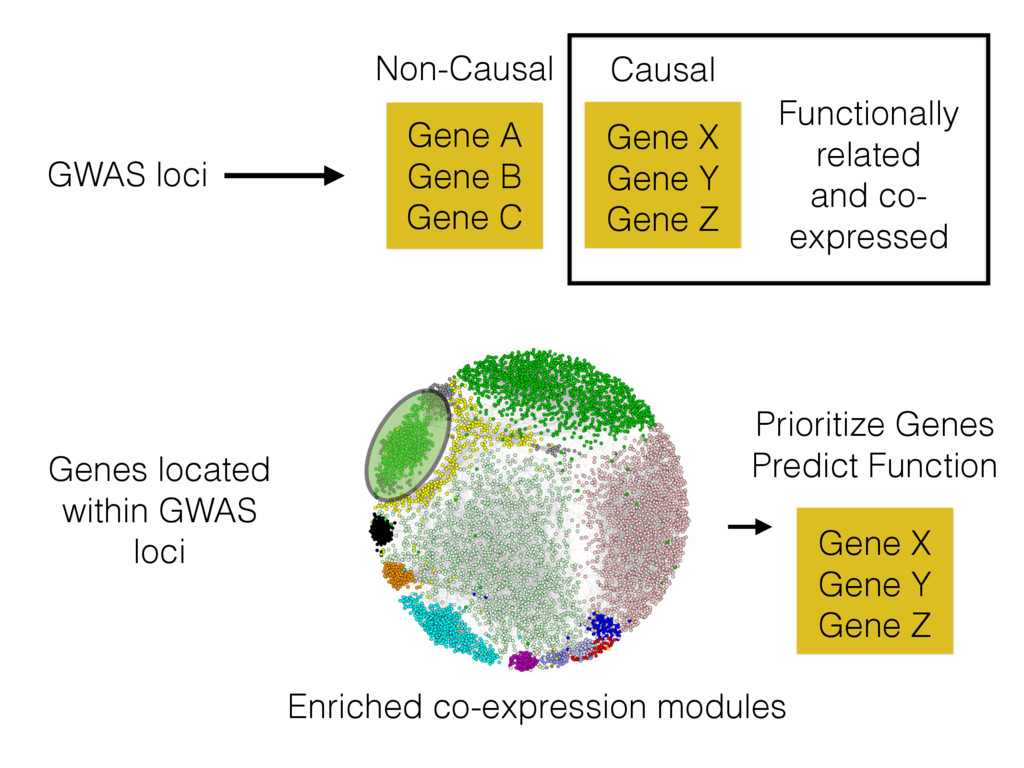
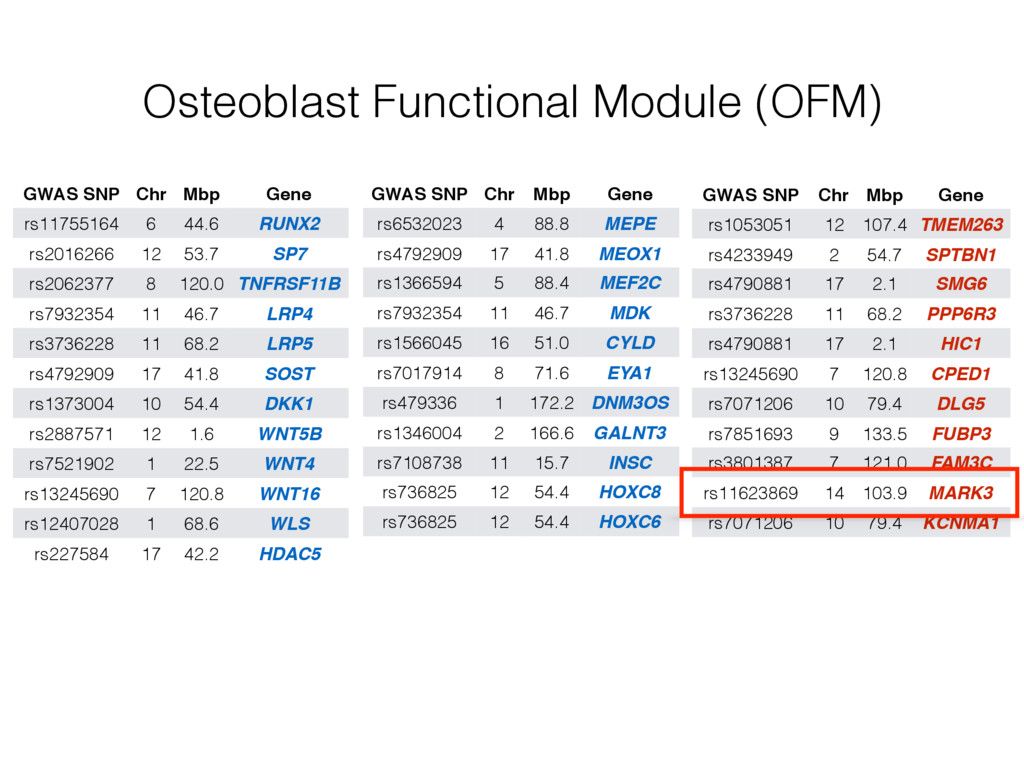
A Gene B Gene C Non-Causal Causal GWAS loci Functionally related and co- expressed Genes located within GWAS loci Gene X Gene Y Gene Z Prioritize Genes Predict Function
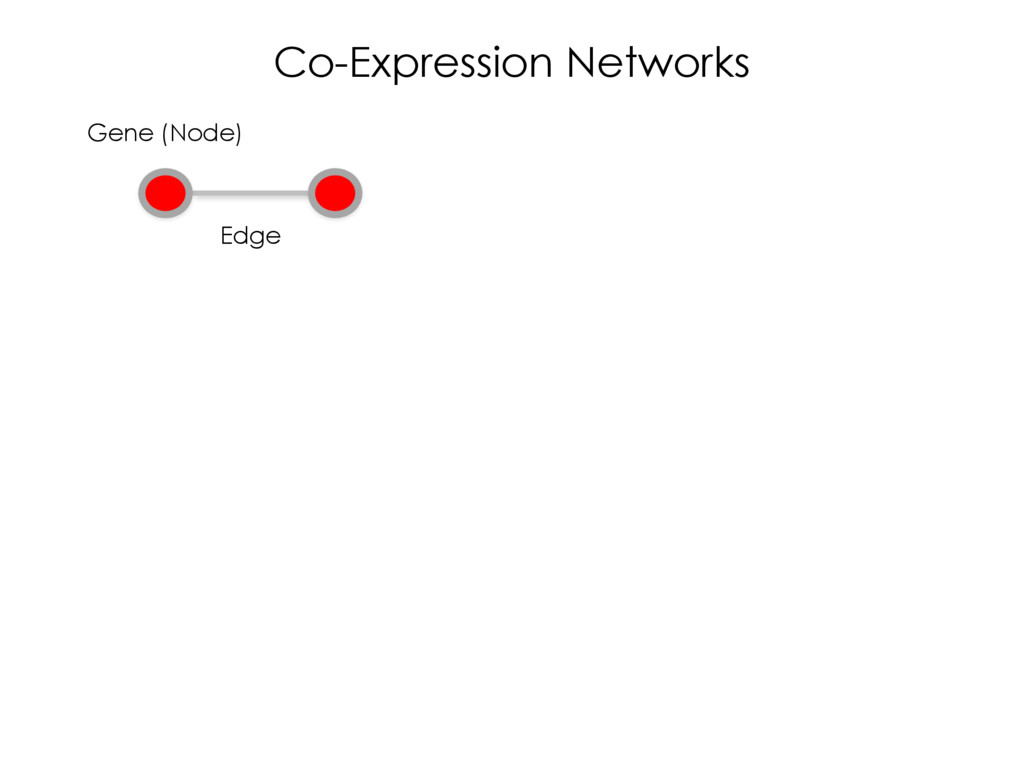
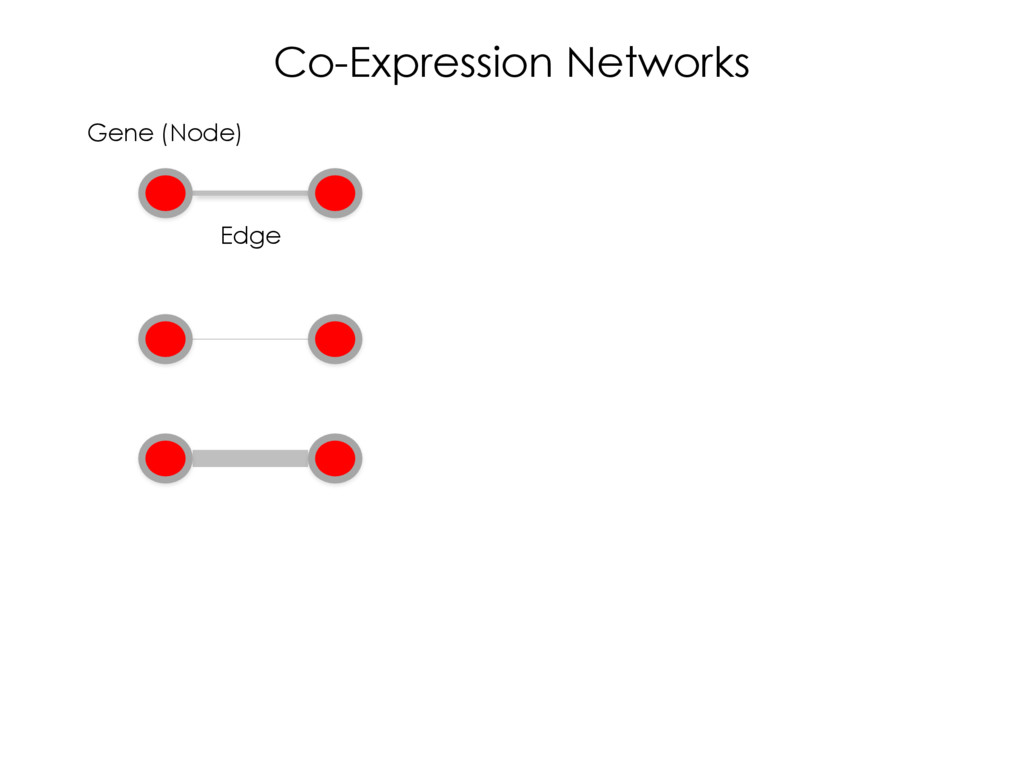
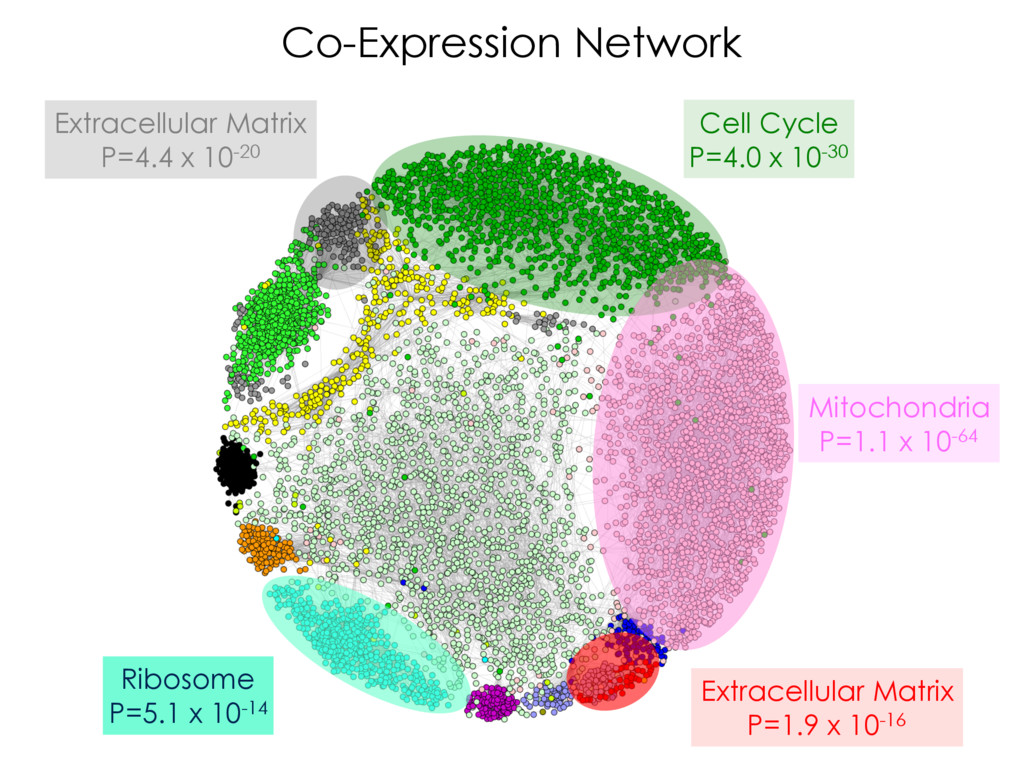
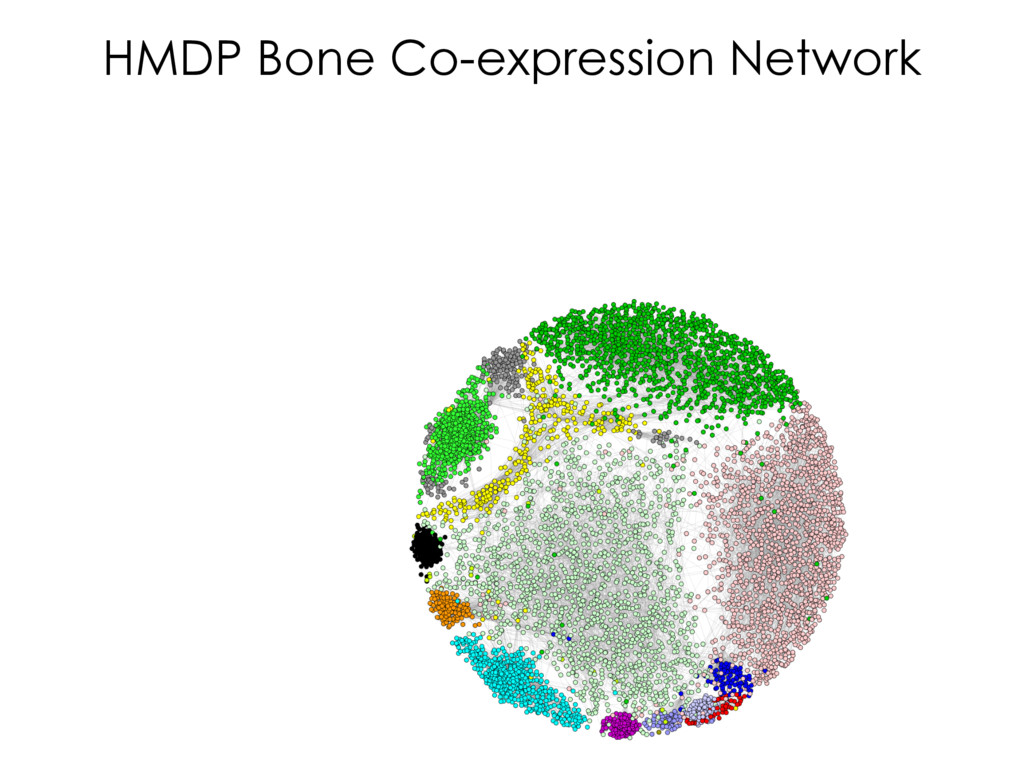
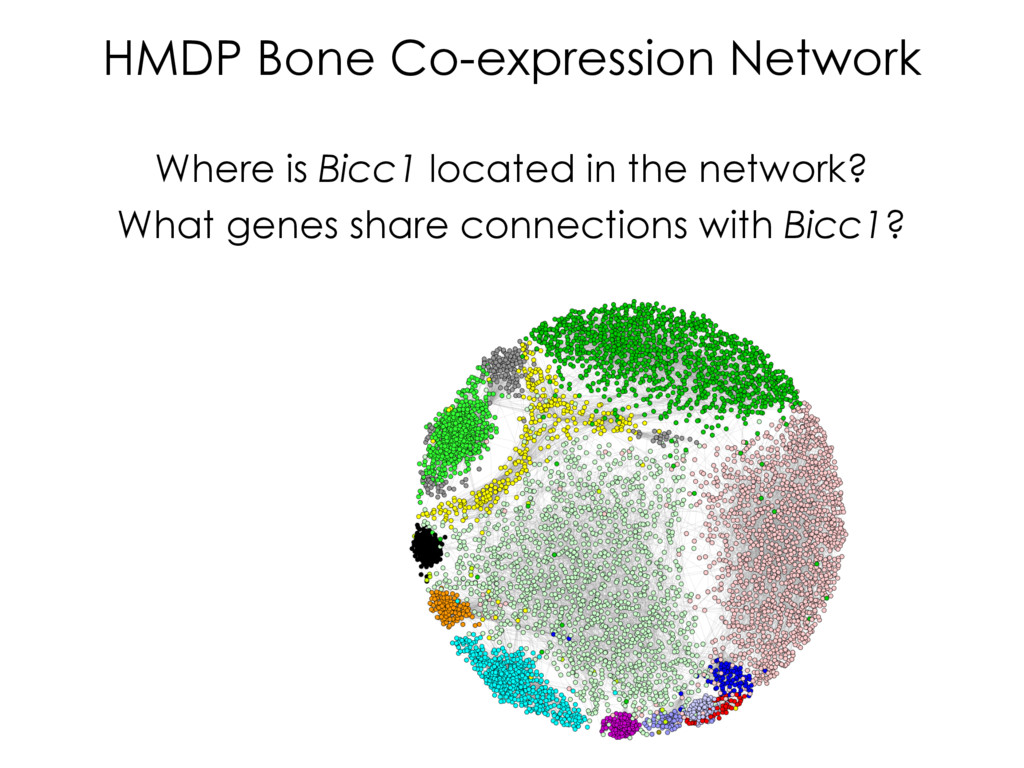
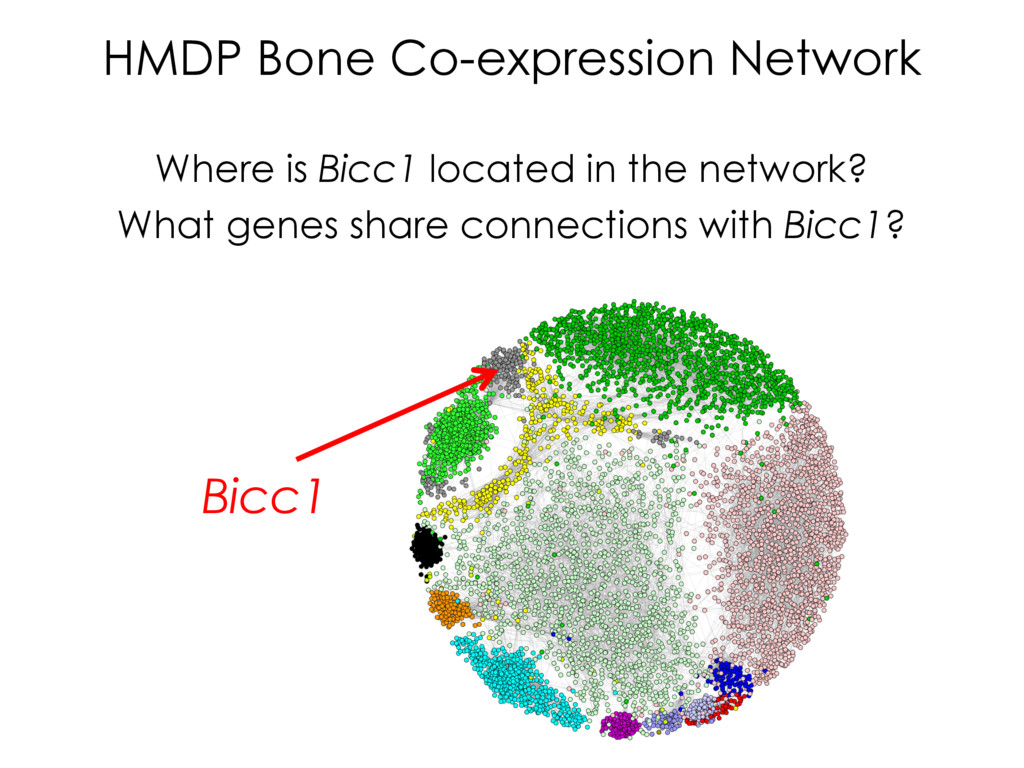
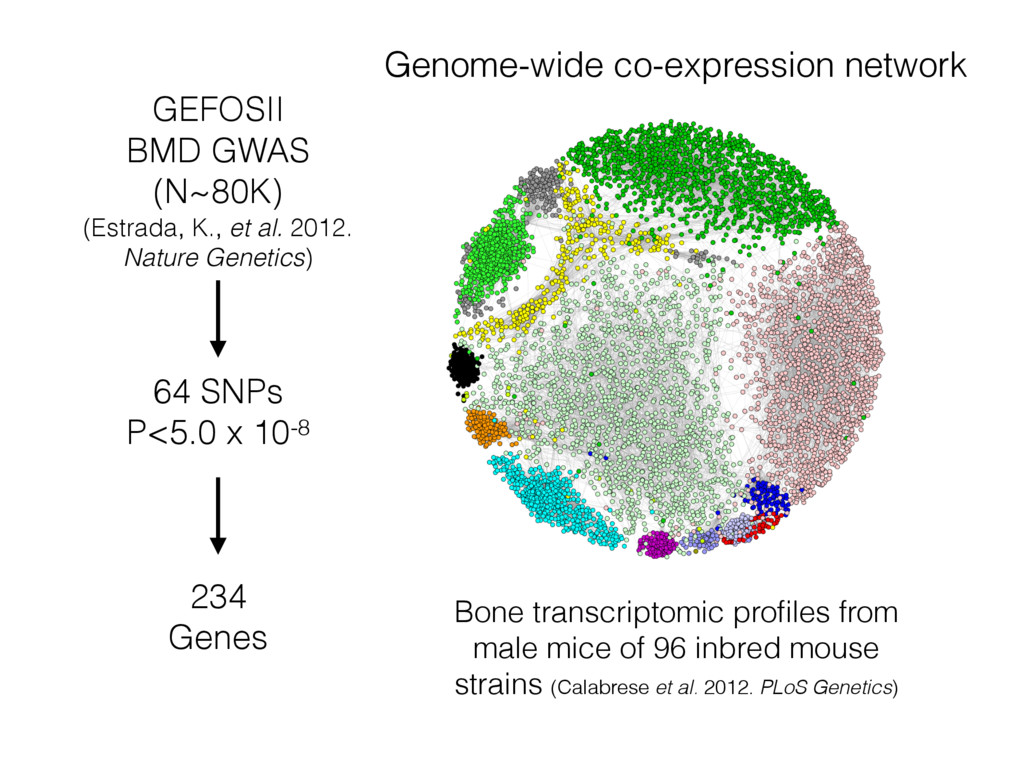
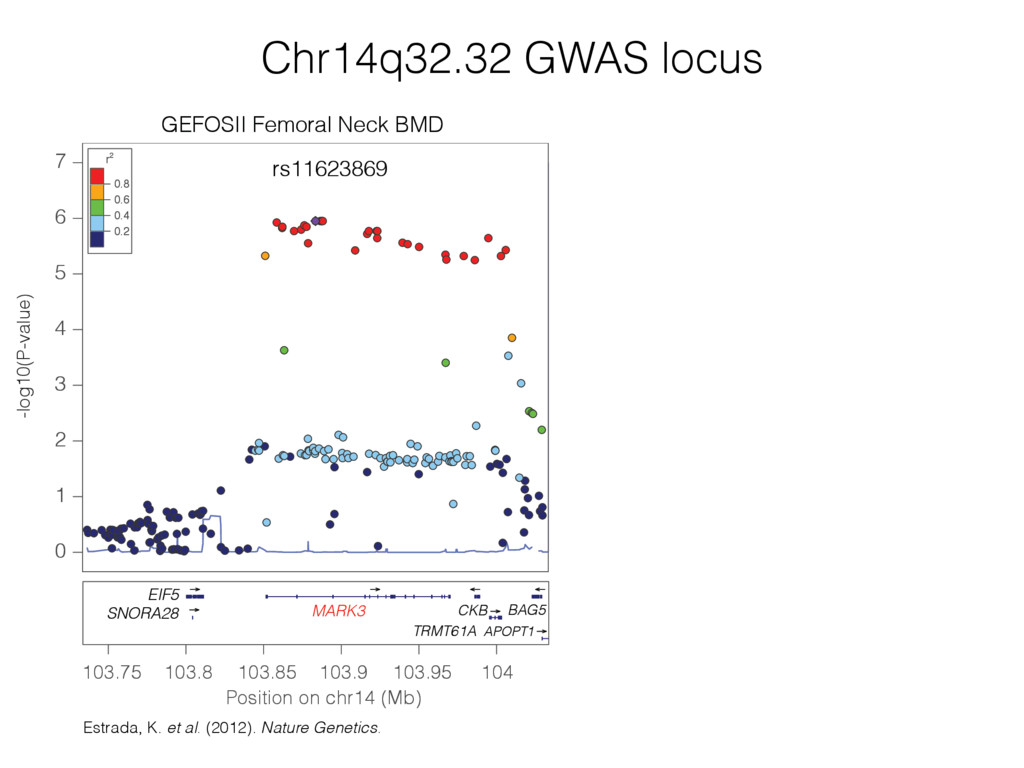
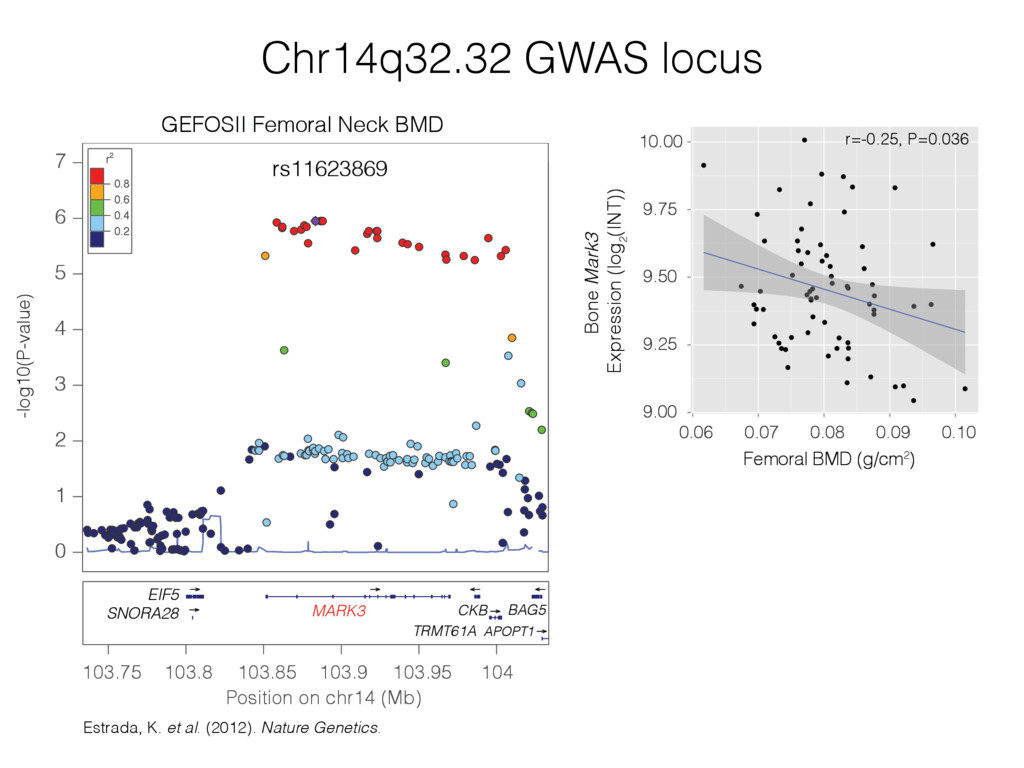
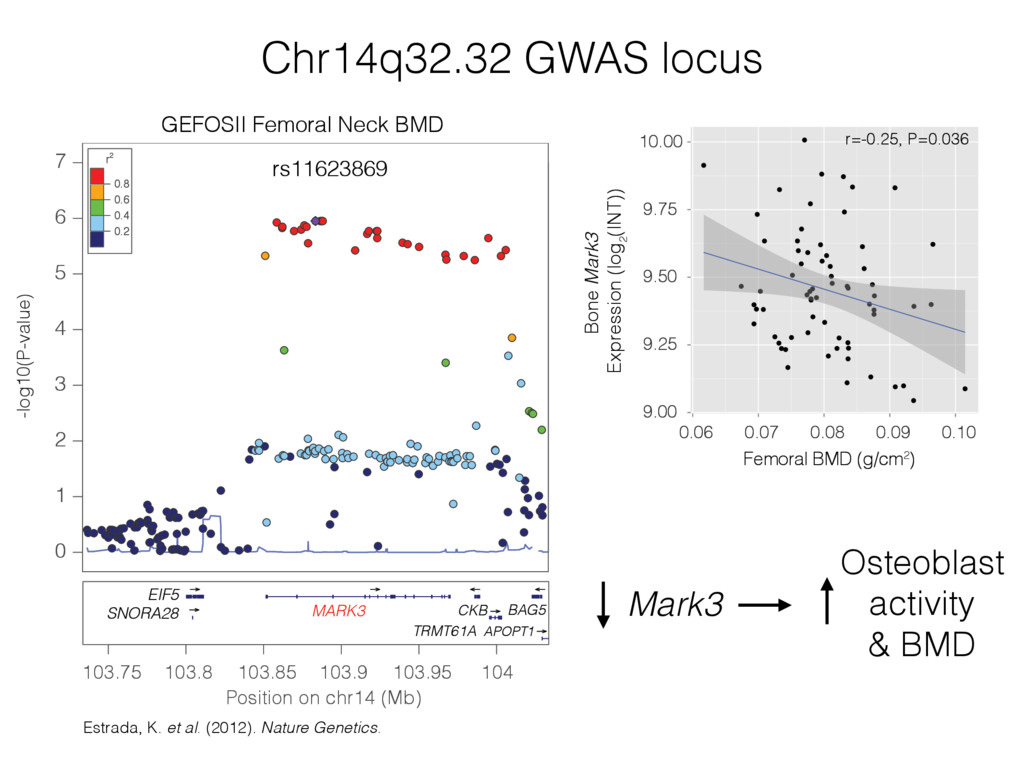
from male mice of 96 inbred mouse strains (Calabrese et al. 2012. PLoS Genetics) Genome-wide co-expression network GEFOSII BMD GWAS (N~80K) (Estrada, K., et al. 2012. Nature Genetics)
Brianne Ray, Ph.D. • Eric Lum • Achilleas Pitsillides, Ph.D. University of Virginia • Stephen Rich, Ph.D. • Ani Manichaikul, Ph.D. UCLA • Jake Lusis, Ph.D. • Brian Bennett, Ph.D. • Luz Orozco, Ph.D. • Calvin Pan • Anatole Ghazalpour, Ph.D. • Hyun Min Kang, Ph.D. • Eleazar Eskin, Ph.D. University of Rochester • Cheryl Ackert-Bicknell, Ph.D. • Dana Godfrey Maine Medical Center Research Institute • Cliff Rosen, M.D. Johns Hopkins University • Tom Clemens, Ph.D. University of Missouri • Elizabeth Bryda, Ph.D. Vanderbilt University • Guanqing Wu, Ph.D. Harvard • Yi-Hsiang Hsu, Ph.D. USCD • Micheal H. Criqui, M.D. • Matthew Allison, M.D. Harbor-UCLA • Matthew Budoff, M.D. University of Namur, Belgium • Olivier De Backer, Ph.D. • Carlos Dombret, Ph.D. R01-AR057759 R56-AR064790 R01-AR064790
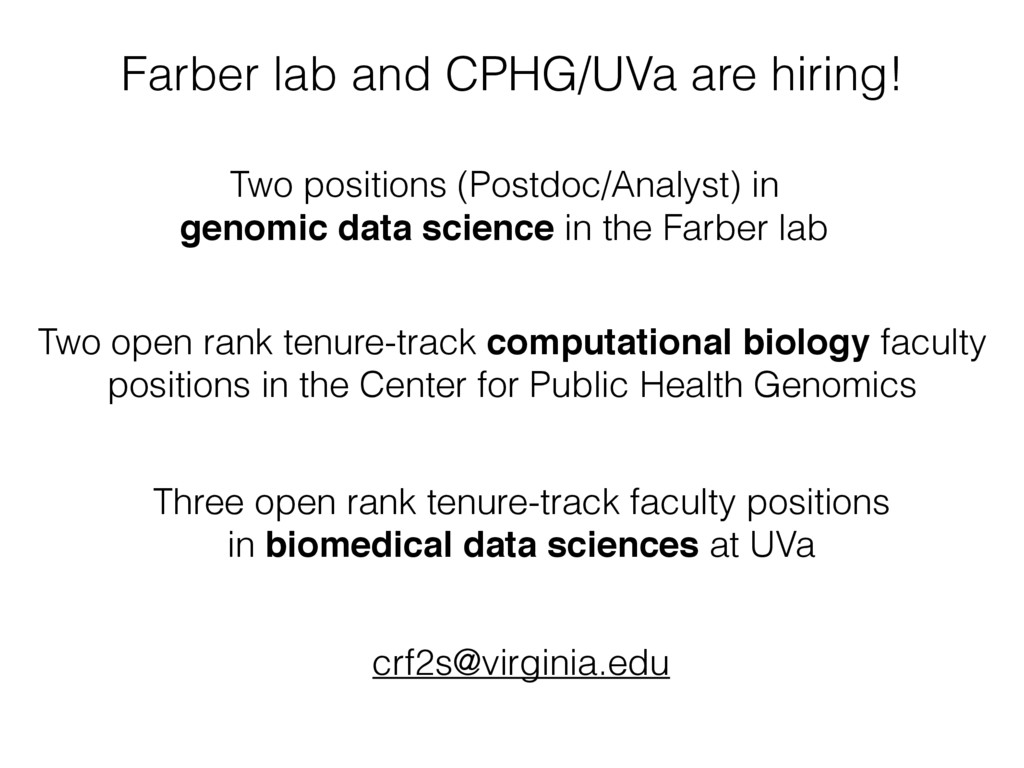
computational biology faculty positions in the Center for Public Health Genomics Three open rank tenure-track faculty positions in biomedical data sciences at UVa [email protected] Two positions (Postdoc/Analyst) in genomic data science in the Farber lab