Talk I gave in "Computing Functional Variants" session at the annual meeting of the American Society for Human Genetics (ASHG) in Baltimore on 10/10/2015.
gene discovery Charles R. Farber, Larry Mesner, Joseph P. Stains, Steven M. Tommasini, Mark C. Horowitz, Clifford J. Rosen, Gina Calabrese American Society of Human Genetics Annual Meeting October 10th, 2015
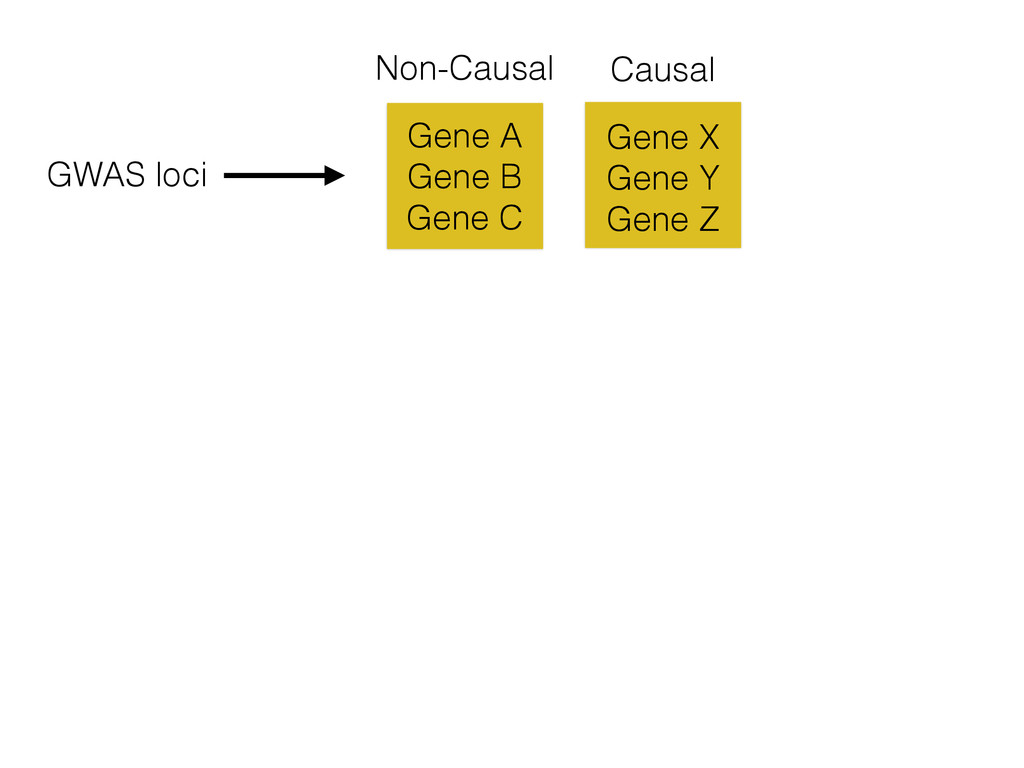
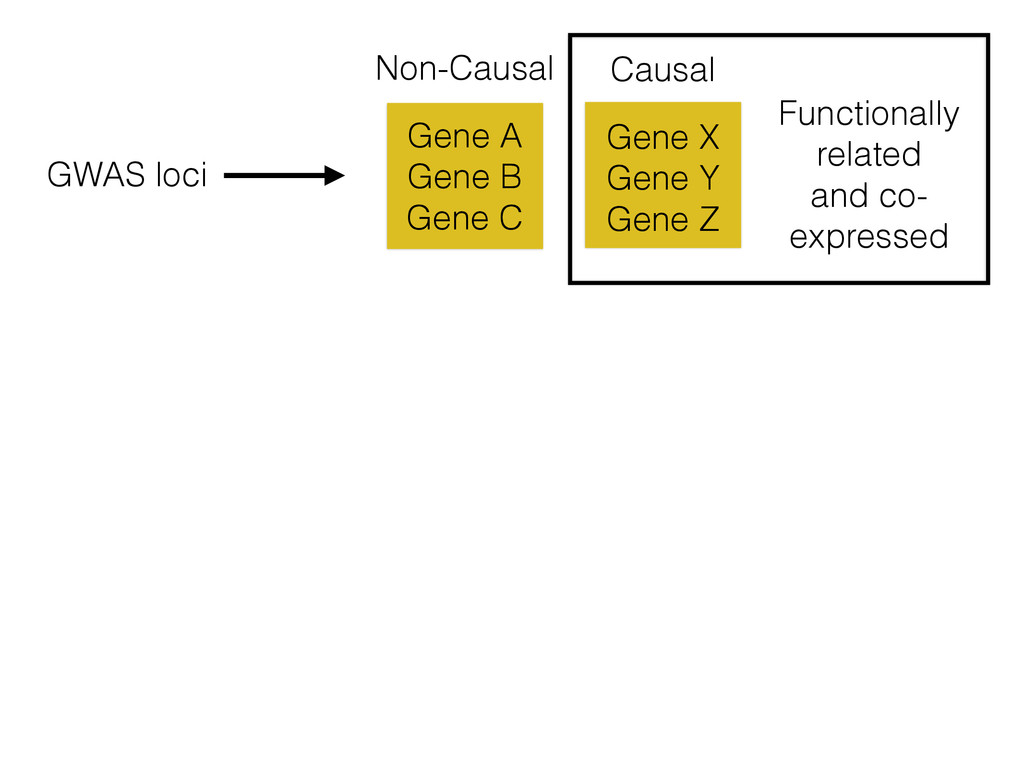
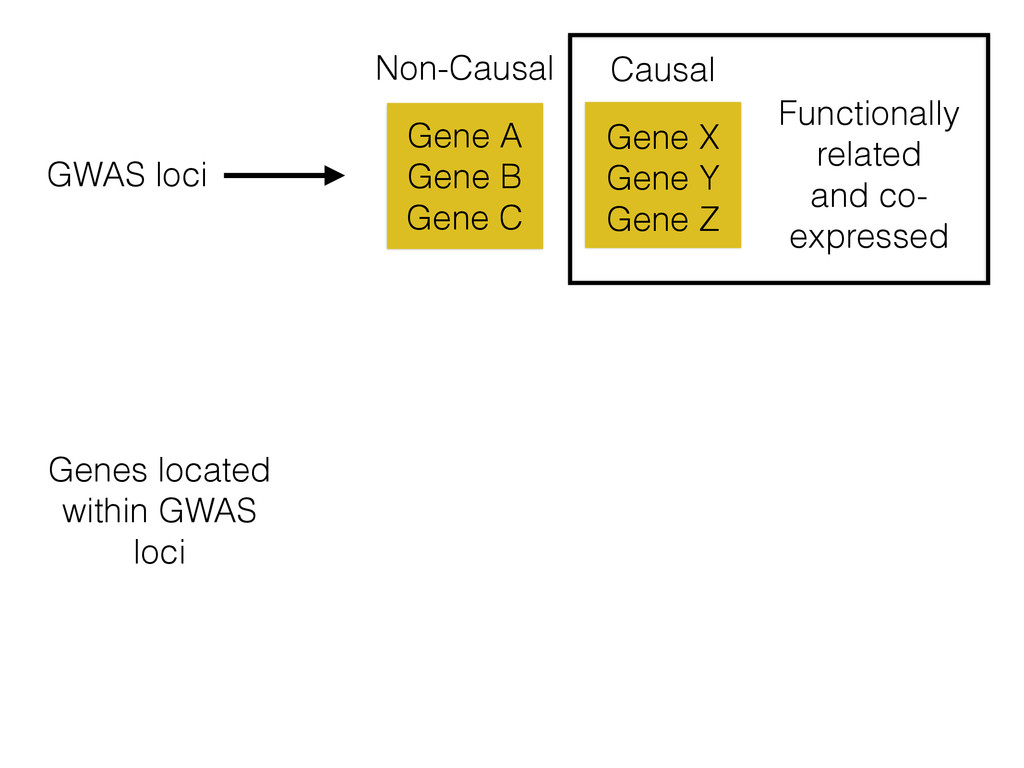
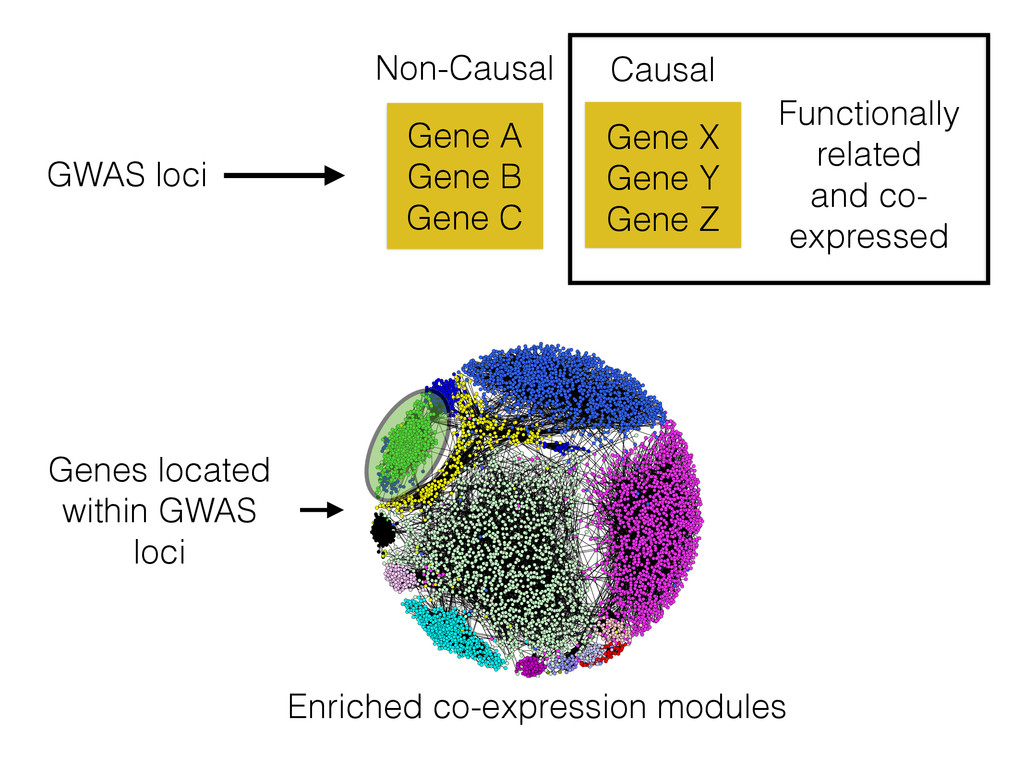
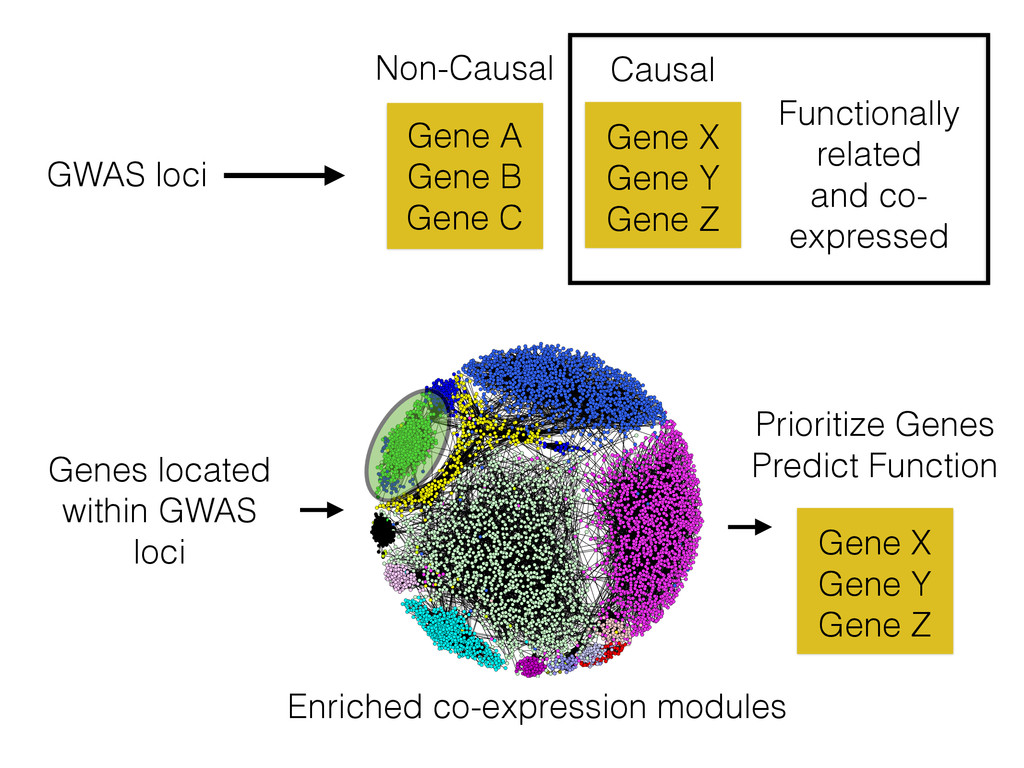
A Gene B Gene C Non-Causal Causal GWAS loci Functionally related and co- expressed Genes located within GWAS loci Gene X Gene Y Gene Z Prioritize Genes Predict Function
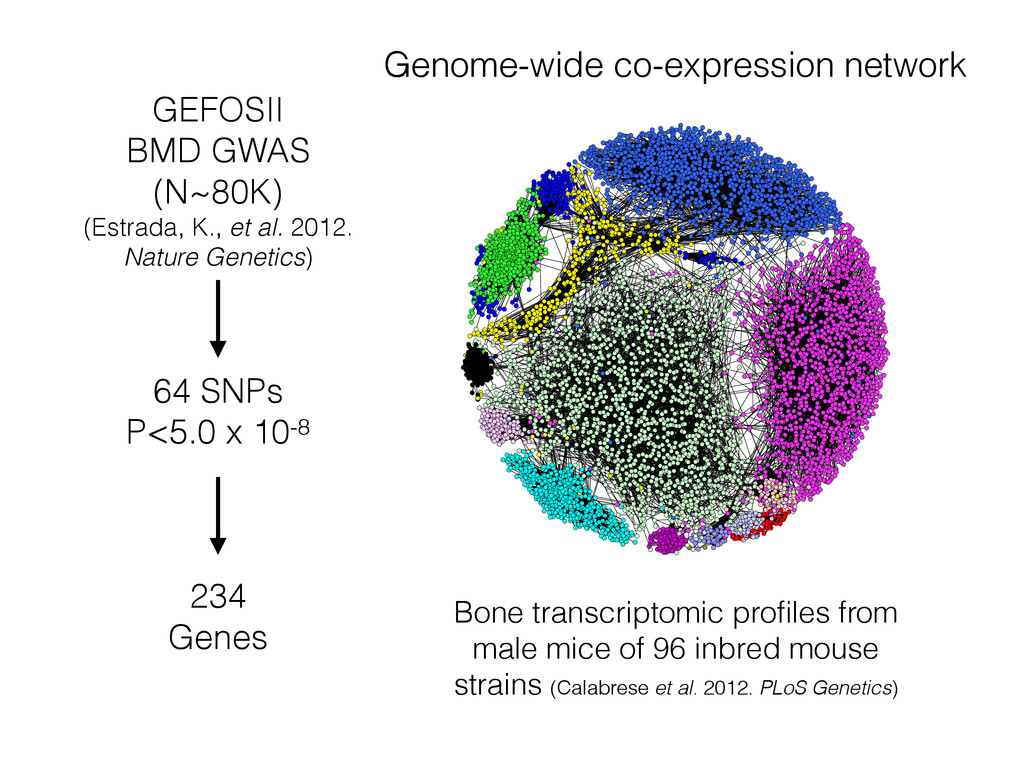
from male mice of 96 inbred mouse strains (Calabrese et al. 2012. PLoS Genetics) Genome-wide co-expression network GEFOSII BMD GWAS (N~80K) (Estrada, K., et al. 2012. Nature Genetics)
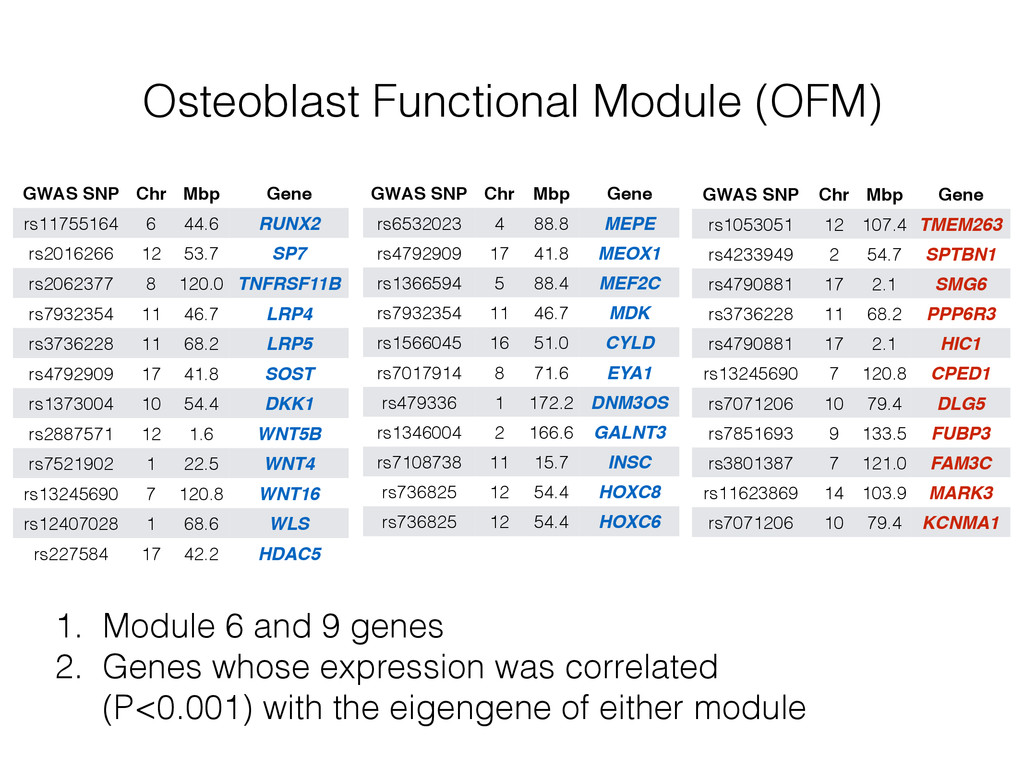
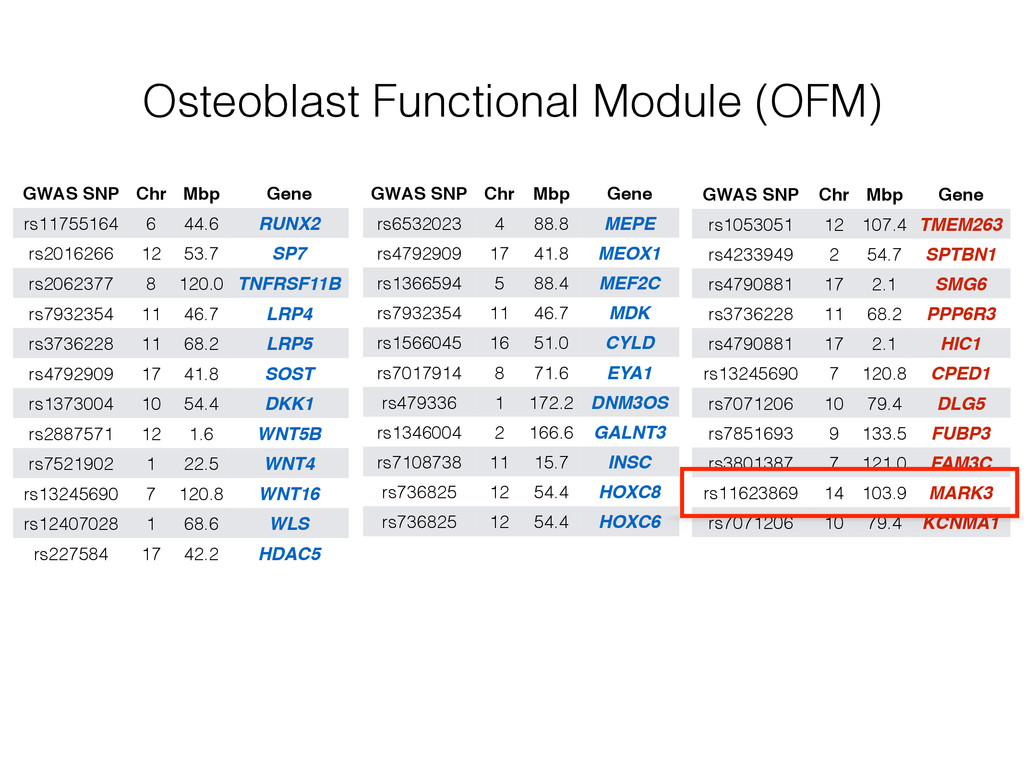
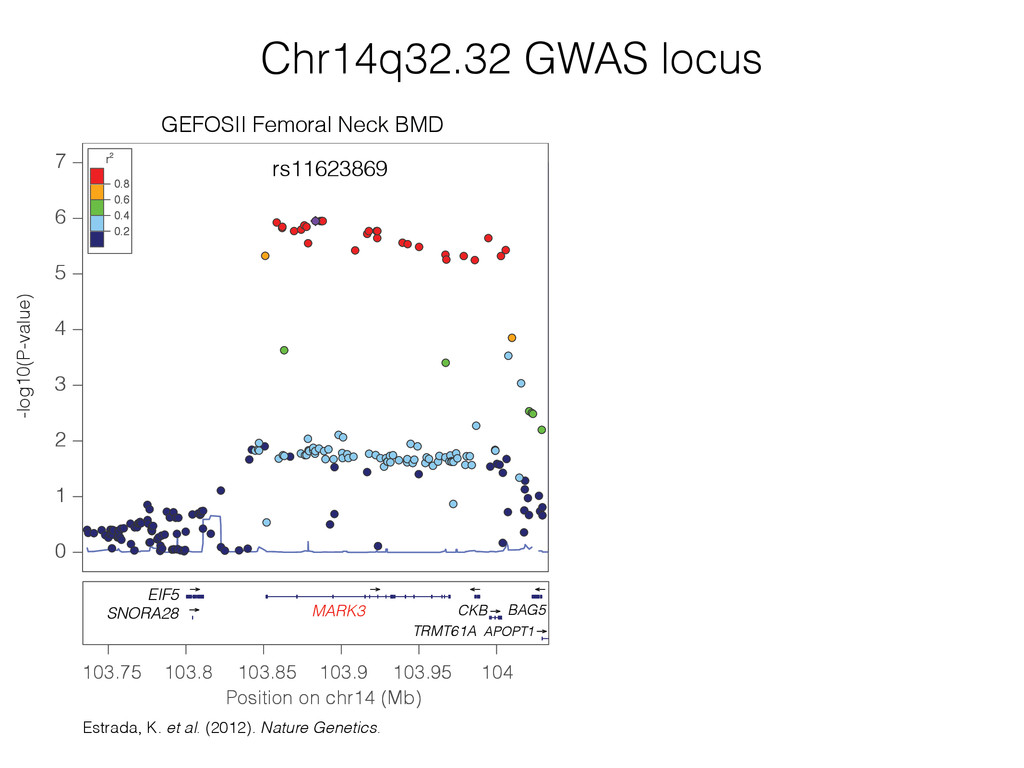
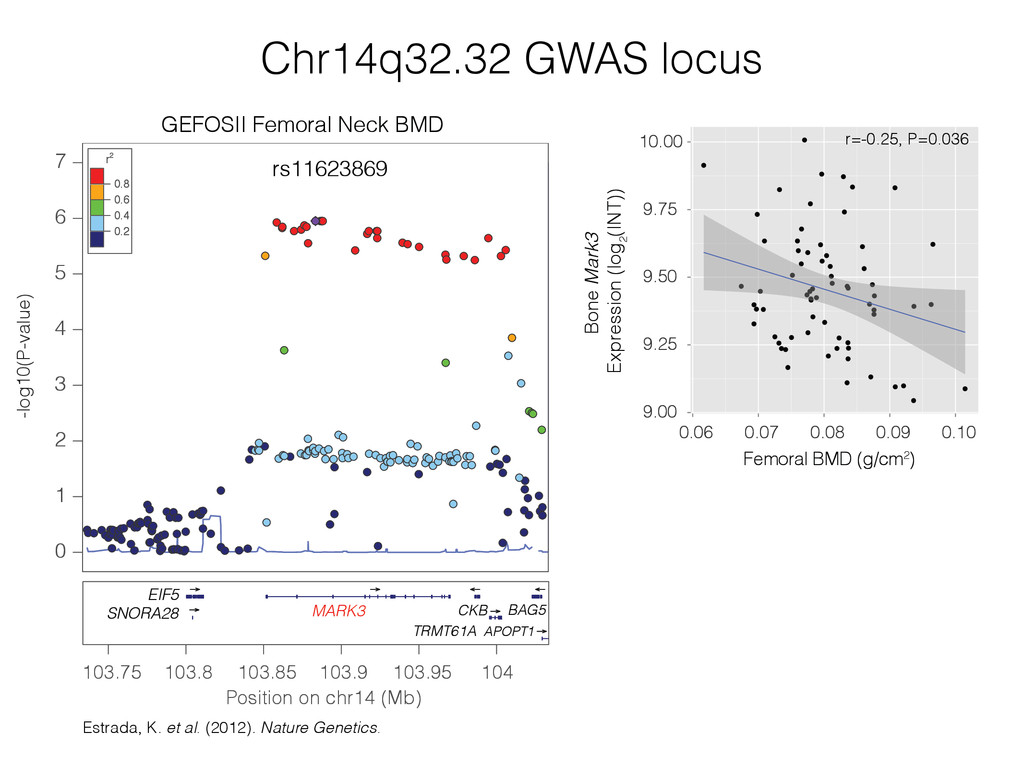
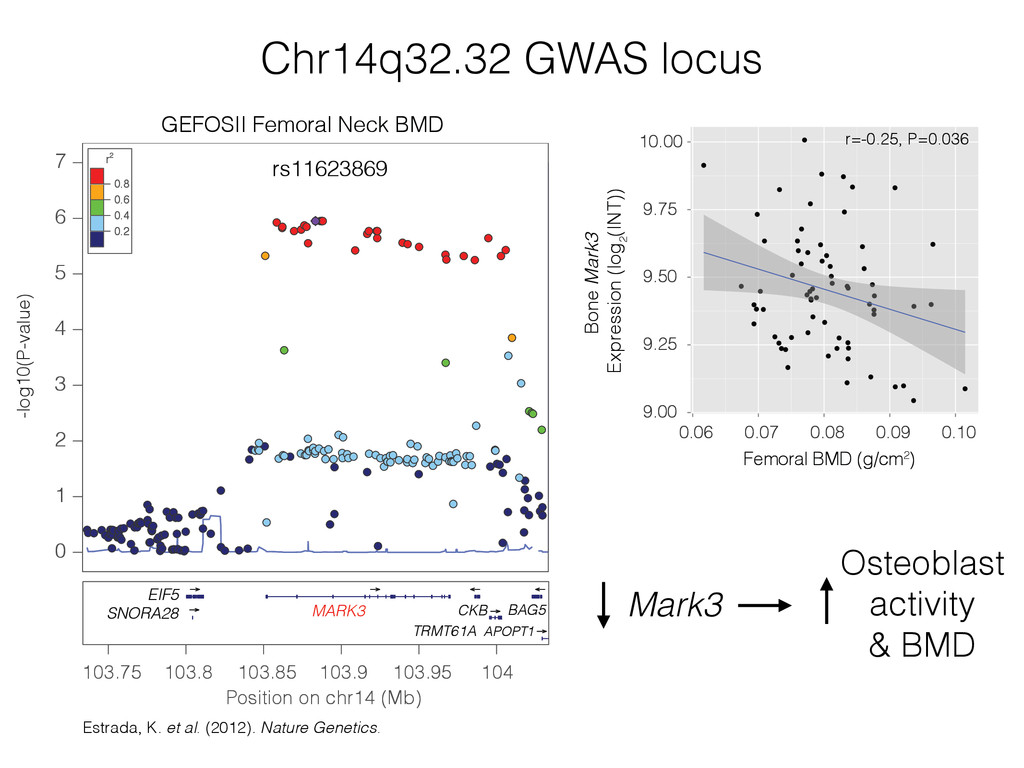
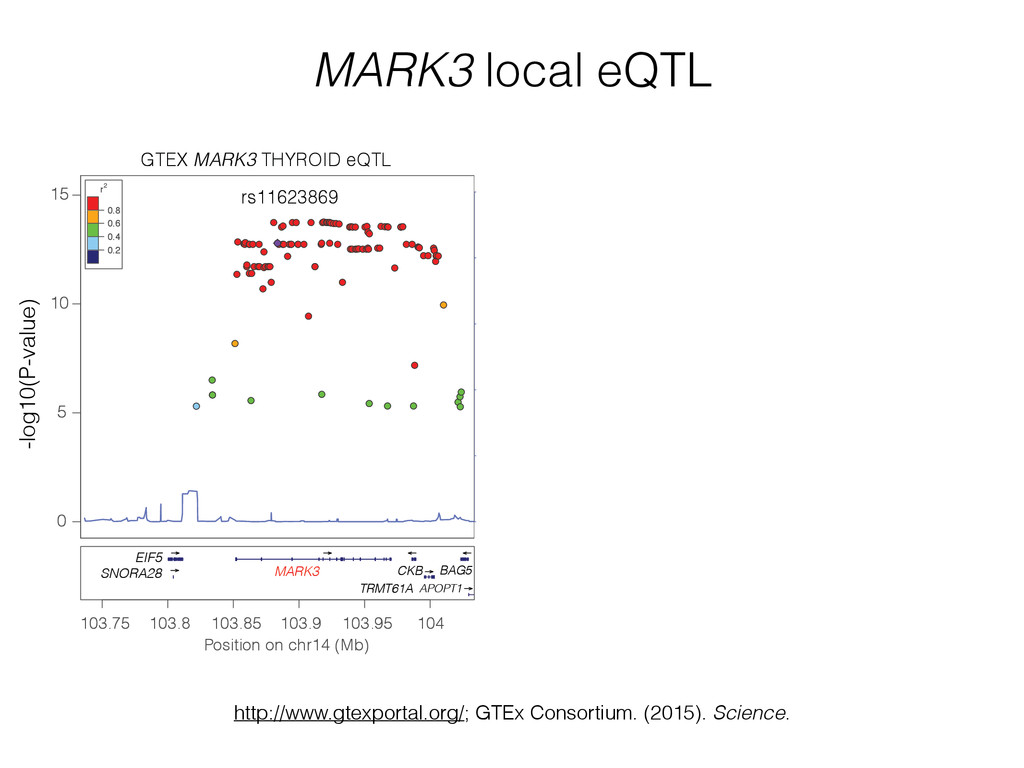
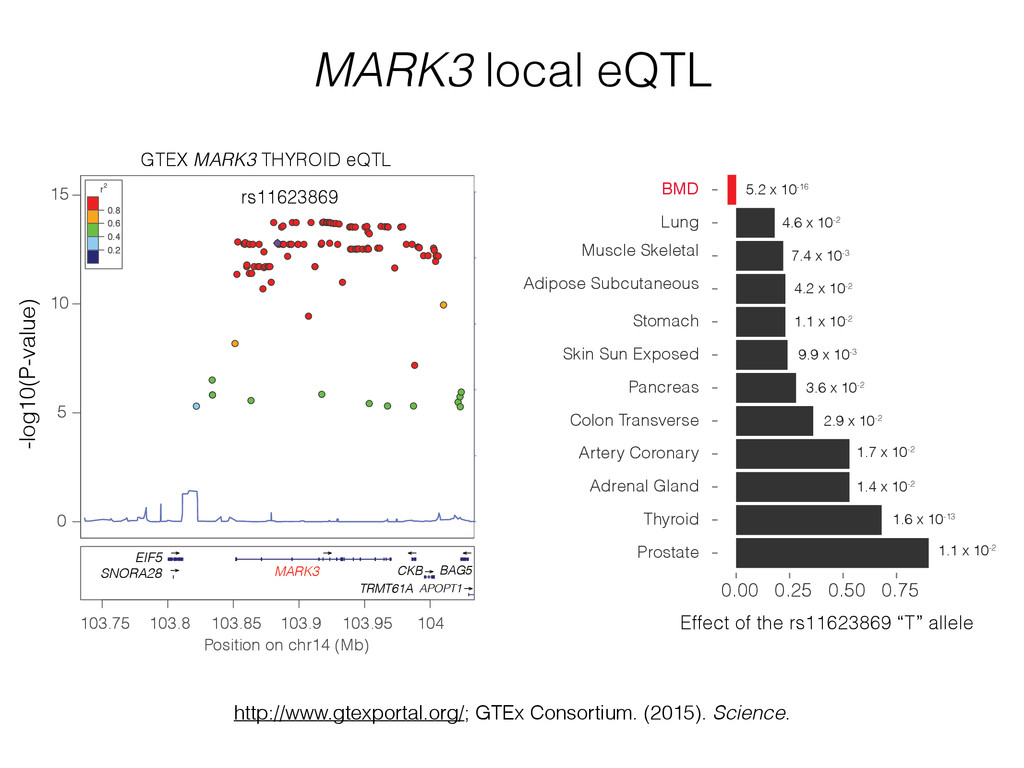
on a disease-relevant co-expression network • We predict that the OFM is enriched for genes responsible for BMD GWAS loci and can be used to guide future experimental work • MARK3 local eQTL likely underlies the BMD association on Chr14q32.32