Upgrade to Pro — share decks privately, control downloads, hide ads and more …

ASBMR 2016 Pre-Meeting Symposium on "Bone Omics"

ASBMR 2016 Pre-Meeting Symposium on "Bone Omics"

Presentation at the ASBMR 2016 Pre-Meeting symposium on "bone -omics" in Atlanta, Georgia on 9/15/16 entitled "Systems Biology: Genes and Networks Underlying the Molecular Basis of Musculoskeletal Disease"

Charles R. Farber

November 22, 2016
Tweet

More Decks by Charles R. Farber

Other Decks in Science

Transcript

  1. Systems Biology: Genes and Networks Underlying the Molecular Basis of

    Musculoskeletal Disease Charles R. Farber, Ph.D. Associate Professor Center for Public Health Genomics University of Virginia @cr_farber [email protected] farberlab.com ASBMR Bone-omics Symposium 9/15/16 Slides available at speakerdeck.com
  2. Variation in Bone Strength and Related Traits Genetic Variation Seeman,

    E., & Delmas, P. D. (2006). The New England Journal of Medicine, 354(21), 2250–2261.
  3. 0 2 4 6 8 10 −log10 (p−value) 0 20

    40 60 80 100 Recombination rate (cM/Mb) • • • • • • • • • • • • • • • • • • • • • • • • • • • • • • • • • • • • • • • • • • • • • • • • • • • • • • • • • • • • • • • • • • • • • • • • • • • • • • • • • • • • • • • • • • • • • • • • • • • • • • • • • • • • • • • • • • • • • • • • • • • • • • • • • • • • • • • •• • • • • • • • • • • • • • • • • • • • • • • • • • • • • • • • • • • • • • • • • • • • • • • • • • • • • • • • • • • • • • • • • • • • • • • • • • • • • • • • • • • • • • • • • • • • • • • • • • • • • • • • • • • • • • • • • • • • • • • • • • • • • • • • • • • • • • • • • • • • • • • • • • • • • • • • • • • • • • • • • • • • • • • • • • • • • • • • • • • • • • • • • • • • • • • • • • • • • • • • • • • • • • • • • • • • • • • • • • • • • • • • • • • • • • • • • • • • • ••• • • • • • • • • • • • • • • • • • • • • • • • • • • • • • • • • • • • • • • • • • • • • • • • rs11228262 0.2 0.4 0.6 0.8 r2 CHKA SUV420H1 C11orf24 LRP5 PPP6R3 GAL MTL5 CPT1A MRPL21 IGHMBP2 68 68.2 68.4 68.6 Position on chr11 (Mb) Plotted SNPs Genome-Wide Association Studies BMD and other bone phenotypes ~100 associations (Rivadeneira, F., & Mäkitie, O. (2016)) Treasure trove of new genes and novel biology Estrada, K. et al. (2012). Nature Genetics.
  4. 0 2 4 6 8 10 −log10 (p−value) 0 20

    40 60 80 100 Recombination rate (cM/Mb) • • • • • • • • • • • • • • • • • • • • • • • • • • • • • • • • • • • • • • • • • • • • • • • • • • • • • • • • • • • • • • • • • • • • • • • • • • • • • • • • • • • • • • • • • • • • • • • • • • • • • • • • • • • • • • • • • • • • • • • • • • • • • • • • • • • • • • • •• • • • • • • • • • • • • • • • • • • • • • • • • • • • • • • • • • • • • • • • • • • • • • • • • • • • • • • • • • • • • • • • • • • • • • • • • • • • • • • • • • • • • • • • • • • • • • • • • • • • • • • • • • • • • • • • • • • • • • • • • • • • • • • • • • • • • • • • • • • • • • • • • • • • • • • • • • • • • • • • • • • • • • • • • • • • • • • • • • • • • • • • • • • • • • • • • • • • • • • • • • • • • • • • • • • • • • • • • • • • • • • • • • • • • • • • • • • • • ••• • • • • • • • • • • • • • • • • • • • • • • • • • • • • • • • • • • • • • • • • • • • • • • • rs11228262 0.2 0.4 0.6 0.8 r2 CHKA SUV420H1 C11orf24 LRP5 PPP6R3 GAL MTL5 CPT1A MRPL21 IGHMBP2 68 68.2 68.4 68.6 Position on chr11 (Mb) Plotted SNPs Genome-Wide Association Studies Identifying causal genes is challenging Most loci implicate regulatory variation
  5. How to go from locus to gene(s) to mechanism? 0

    2 4 6 8 10 −log10 (p−value) 0 20 40 60 80 100 Recombination rate (cM/Mb) • • • • • • • • • • • • • • • • • • • • • • • • • • • • • • • • • • • • • • • • • • • • • • • • • • • • • • • • • • • • • • • • • • • • • • • • • • • • • • • • • • • • • • • • • • • • • • • • • • • • • • • • • • • • • • • • • • • • • • • • • • • • • • • • • • • • • • • •• • • • • • • • • • • • • • • • • • • • • • • • • • • • • • • • • • • • • • • • • • • • • • • • • • • • • • • • • • • • • • • • • • • • • • • • • • • • • • • • • • • • • • • • • • • • • • • • • • • • • • • • • • • • • • • • • • • • • • • • • • • • • • • • • • • • • • • • • • • • • • • • • • • • • • • • • • • • • • • • • • • • • • • • • • • • • • • • • • • • • • • • • • • • • • • • • • • • • • • • • • • • • • • • • • • • • • • • • • • • • • • • • • • • • • • • • • • • • ••• • • • • • • • • • • • • • • • • • • • • • • • • • • • • • • • • • • • • • • • • • • • • • • • rs11228262 0.2 0.4 0.6 0.8 r2 CHKA SUV420H1 C11orf24 LRP5 PPP6R3 GAL MTL5 CPT1A MRPL21 IGHMBP2 68 68.2 68.4 68.6 Position on chr11 (Mb) Plotted SNPs
  6. How to go from locus to gene(s) to mechanism? Basel

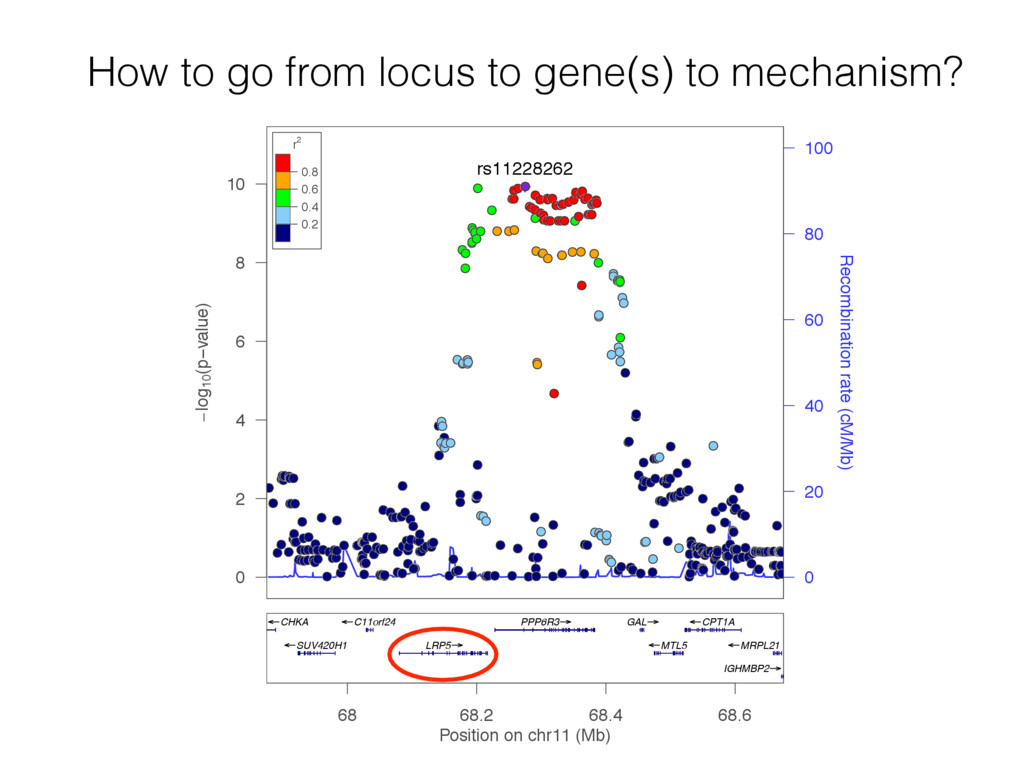
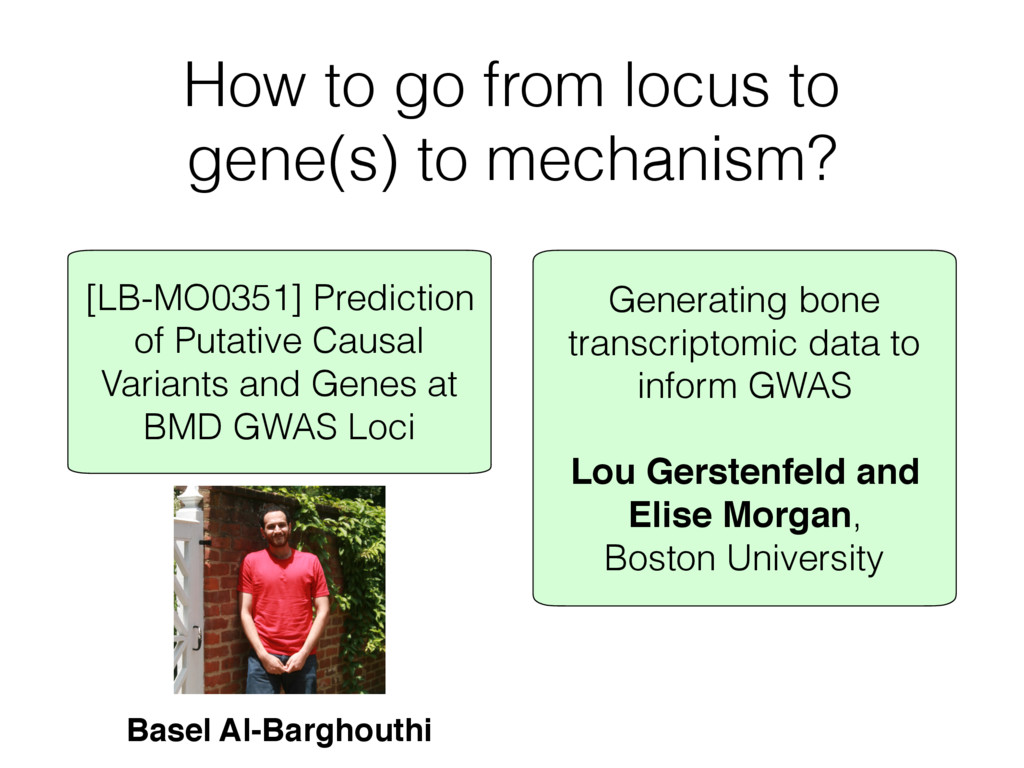
    Al-Barghouthi [LB-MO0351] Prediction of Putative Causal Variants and Genes at BMD GWAS Loci Generating bone transcriptomic data to inform GWAS Lou Gerstenfeld and Elise Morgan, Boston University
  7. Using Networks to Inform GWAS MacLellan, W. R., Wang, Y.,

    & Lusis, A. J. (2012). Systems-based approaches to cardiovascular disease. Nature Reviews Cardiology, 9(3), 172–184.
  8. Osteoblast activity Osteoclast activity Genes that influence a disease are

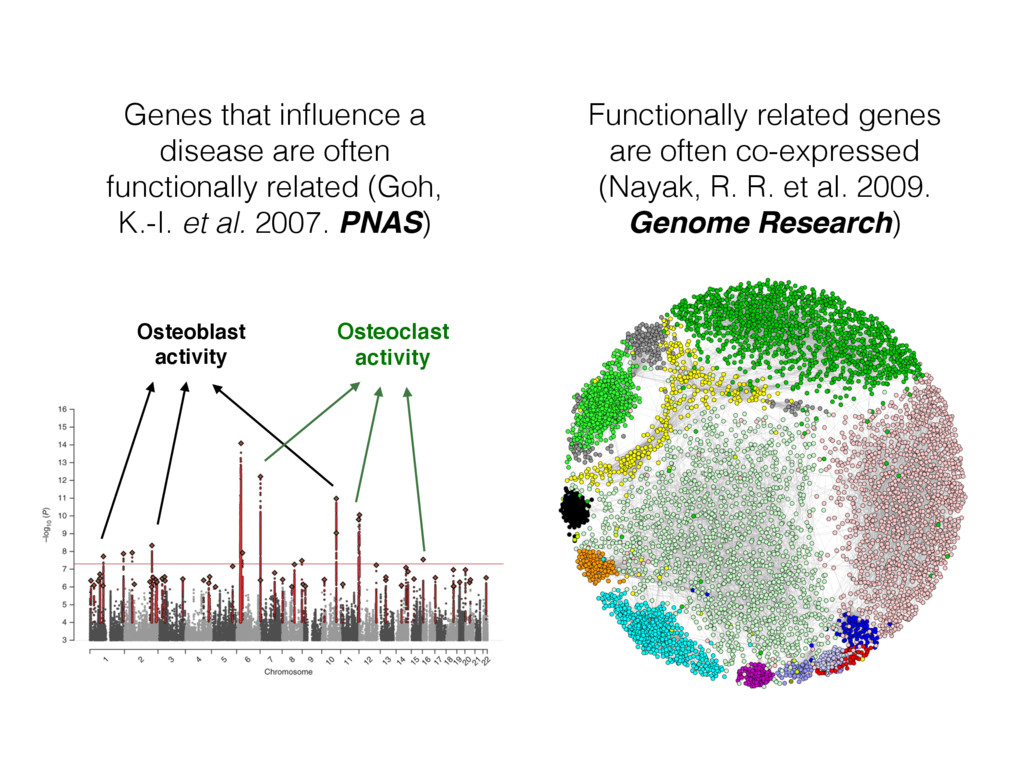
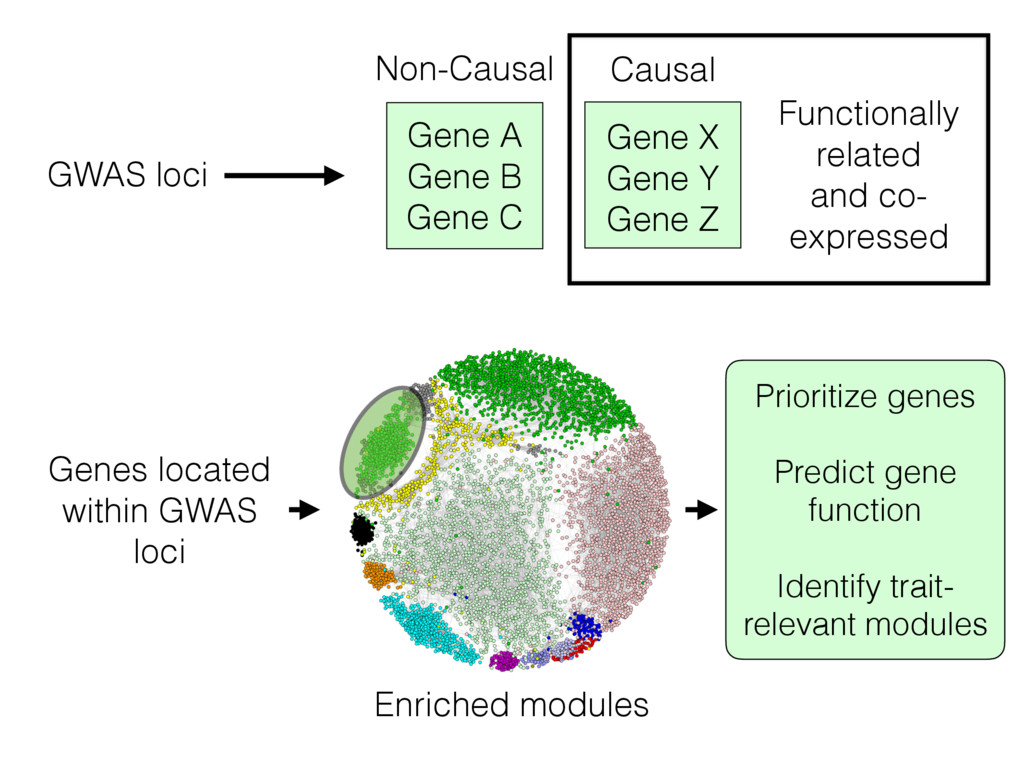
    often functionally related (Goh, K.-I. et al. 2007. PNAS) Functionally related genes are often co-expressed (Nayak, R. R. et al. 2009. Genome Research)
  9. Gene X Gene Y Gene Z Gene A Gene B

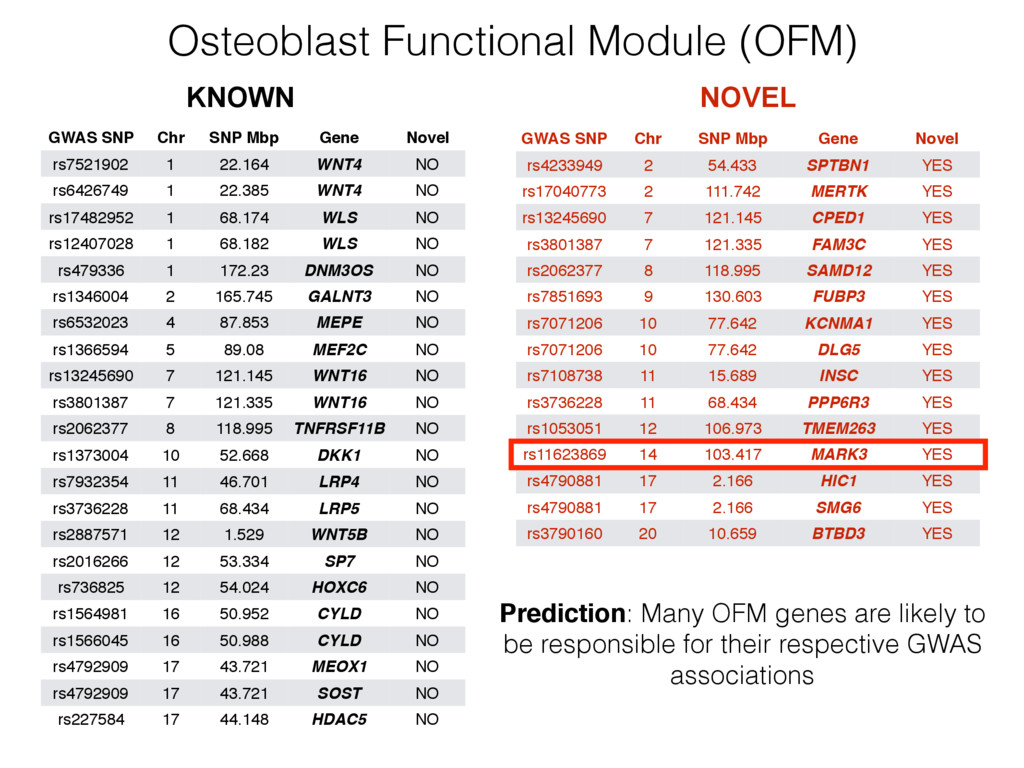
    Gene C Non-Causal Causal GWAS loci Functionally related and co- expressed Genes located within GWAS loci Enriched modules Prioritize genes Predict gene function Identify trait- relevant modules
  10. 64 SNPs P<5.0 x 10⁻⁸ 234 Genes GEFOSII BMD GWAS

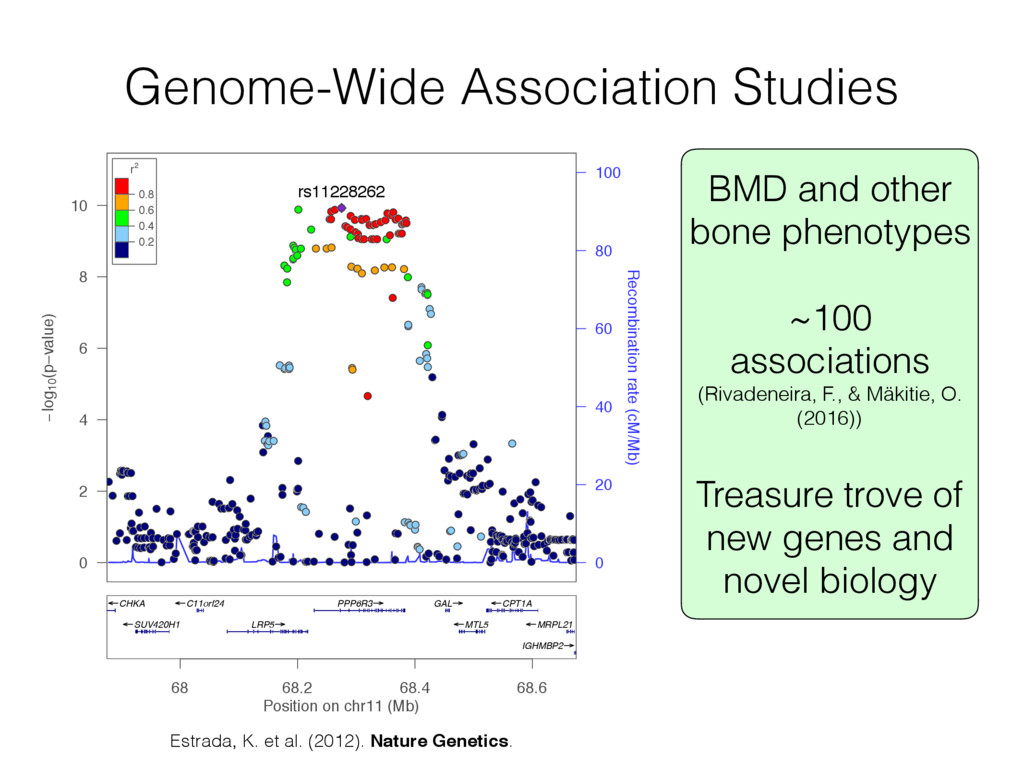
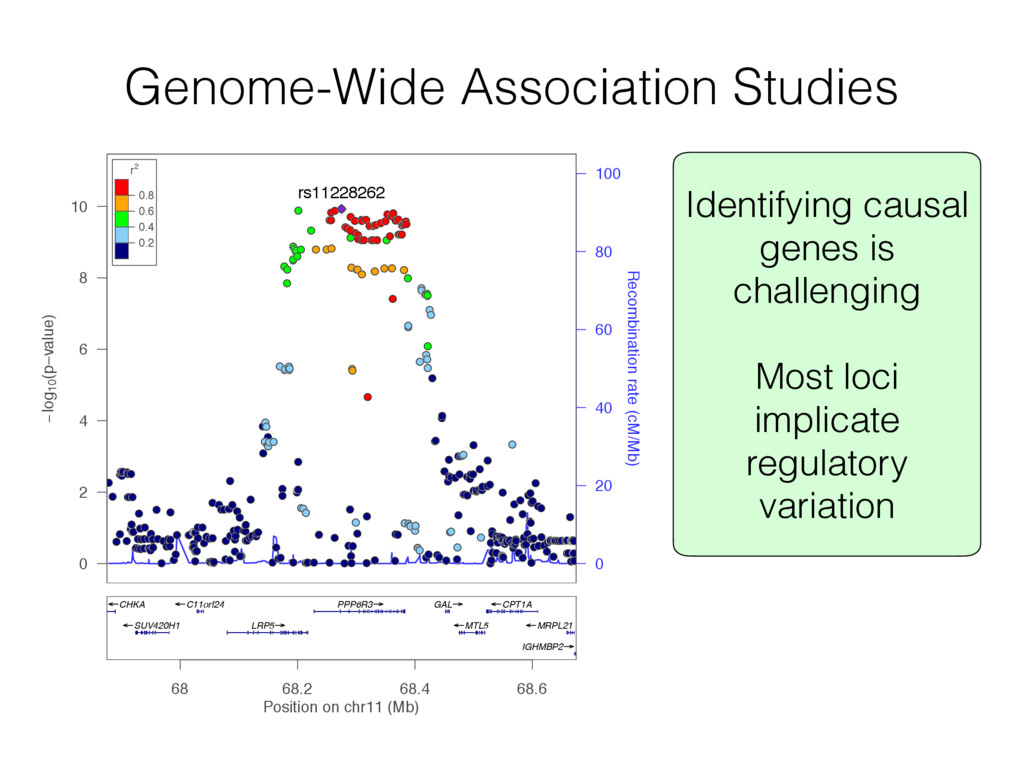
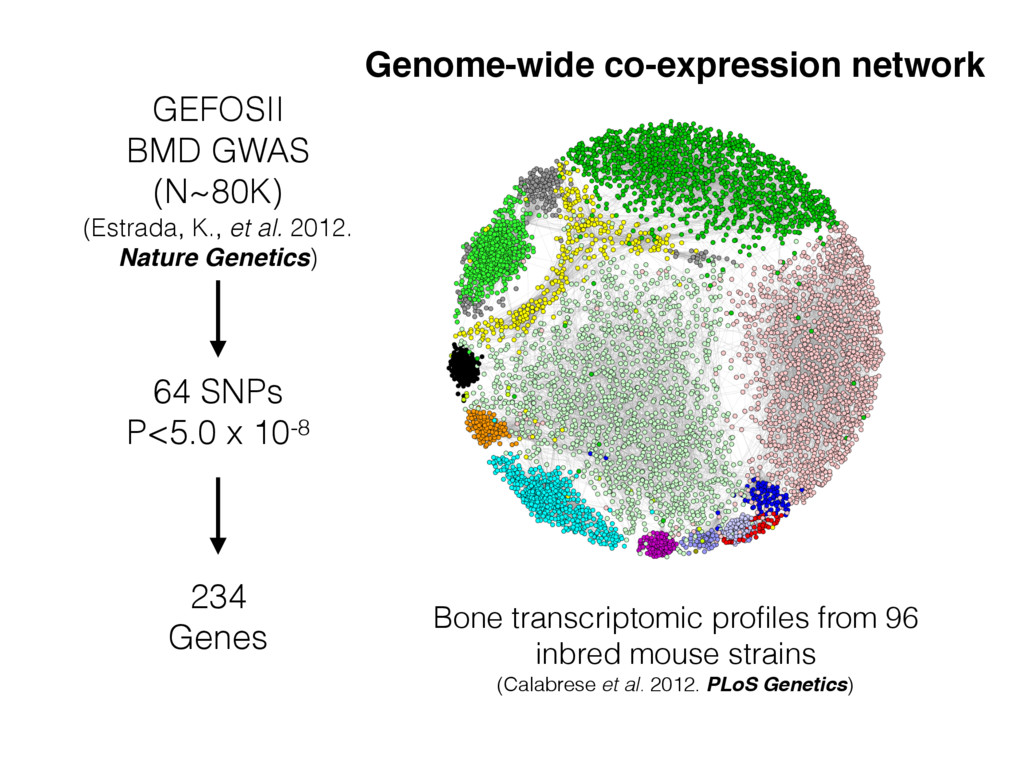
    (N~80K) (Estrada, K., et al. 2012. Nature Genetics) Bone transcriptomic profiles from 96 inbred mouse strains (Calabrese et al. 2012. PLoS Genetics) Genome-wide co-expression network
  11. GWAS gene enrichment in modules 6 and 9 0 1

    2 3 1 2 3 4 5 6 7 8 9 10 11 12 13 14 15 16 17 18 19 20 21 −log10(FIsher’s P-value) Module −0.2 0.0 0.2 −0.3 −0.2 −0.1 0.0 0.1 0.2 Module 9 Eigengene Module 6 Eigengene r=0.63, P=6.4 x 10⁻¹² Modules 6 and 9 are enriched for genes known to regulate osteoblast activity and BMD
  12. GWAS SNP Chr SNP Mbp Gene Novel rs7521902 1 22.164

    WNT4 NO rs6426749 1 22.385 WNT4 NO rs17482952 1 68.174 WLS NO rs12407028 1 68.182 WLS NO rs479336 1 172.23 DNM3OS NO rs1346004 2 165.745 GALNT3 NO rs6532023 4 87.853 MEPE NO rs1366594 5 89.08 MEF2C NO rs13245690 7 121.145 WNT16 NO rs3801387 7 121.335 WNT16 NO rs2062377 8 118.995 TNFRSF11B NO rs1373004 10 52.668 DKK1 NO rs7932354 11 46.701 LRP4 NO rs3736228 11 68.434 LRP5 NO rs2887571 12 1.529 WNT5B NO rs2016266 12 53.334 SP7 NO rs736825 12 54.024 HOXC6 NO rs1564981 16 50.952 CYLD NO rs1566045 16 50.988 CYLD NO rs4792909 17 43.721 MEOX1 NO rs4792909 17 43.721 SOST NO rs227584 17 44.148 HDAC5 NO GWAS SNP Chr SNP Mbp Gene Novel rs4233949 2 54.433 SPTBN1 YES rs17040773 2 111.742 MERTK YES rs13245690 7 121.145 CPED1 YES rs3801387 7 121.335 FAM3C YES rs2062377 8 118.995 SAMD12 YES rs7851693 9 130.603 FUBP3 YES rs7071206 10 77.642 KCNMA1 YES rs7071206 10 77.642 DLG5 YES rs7108738 11 15.689 INSC YES rs3736228 11 68.434 PPP6R3 YES rs1053051 12 106.973 TMEM263 YES rs11623869 14 103.417 MARK3 YES rs4790881 17 2.166 HIC1 YES rs4790881 17 2.166 SMG6 YES rs3790160 20 10.659 BTBD3 YES Osteoblast Functional Module (OFM) KNOWN NOVEL Prediction: Many OFM genes are likely to be responsible for their respective GWAS associations
  13. Non-OFM loci OFM gene Genes SNPs Regulatory Element OFM loci

    OFM gene Genes SNPs Regulatory Element
  14. SNP Group OFM Lead SNPs (N=30) NOFM Lead SNPs (N=34)

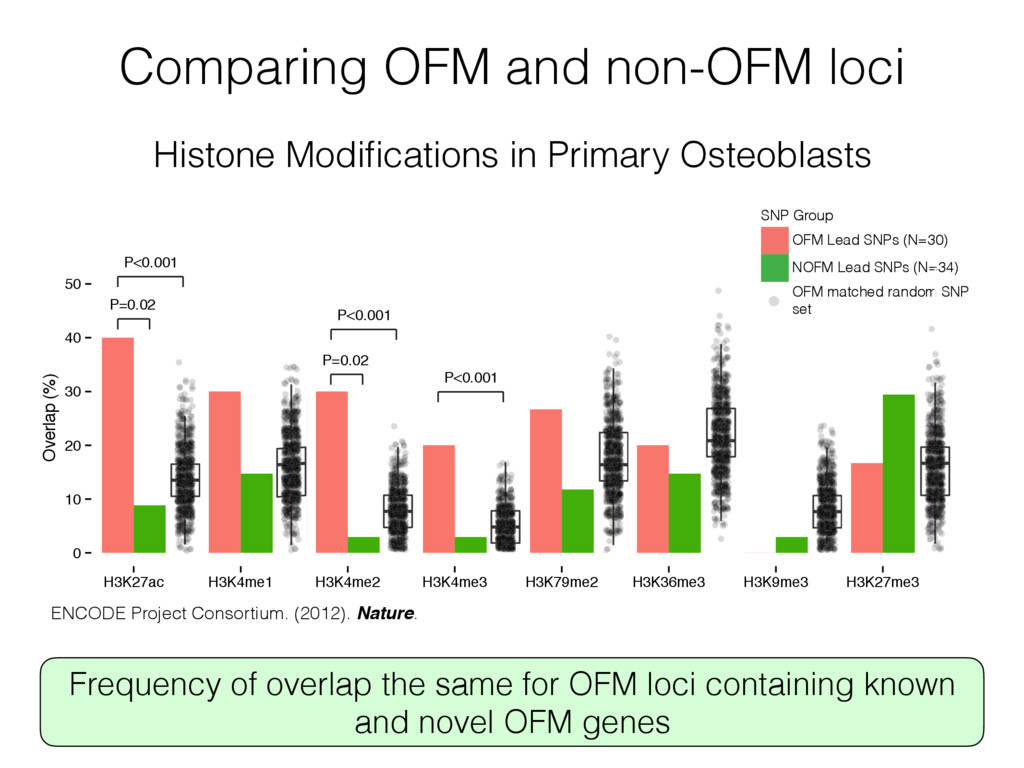
    OFM matched random SNP set 0 10 20 30 40 50 H3K27ac H3K4me1 H3K4me2 H3K4me3 H3K79me2 H3K36me3 H3K9me3 H3K27me3 Overlap (%) P=0.02 P=0.02 P<0.001 P<0.001 P<0.001 Comparing OFM and non-OFM loci Histone Modifications in Primary Osteoblasts ENCODE Project Consortium. (2012). Nature. Frequency of overlap the same for OFM loci containing known and novel OFM genes
  15. OFM locus OFM gene OFM locus NOFM gene NOFM locus

    NOFM gene Expression (log 2 (AU)) P=0.02 P=0.009 2.5 5.0 7.5 10.0 12.5 Comparing OFM vs non-OFM loci OSTEOBLASTS CHONDROCYTES MESENCHYMAL STEM CELLS CD184+ ENDODERM CELLS PREFRONTAL CORTEX FORESKIN FIBROBLAST 10 20 30 40 −0.1 0.0 0.1 0.2 0.3 Difference (% OFM overlap - % NOFM overlap) Overlap (%) H3K27ac OFM Overlap (%) Roadmap Epigenomics Consortium (2015). Nature, 518(7539), 317–330 These data link OFM loci to gene regulation in osteoblasts supporting an involvement for OFM genes
  16. GWAS SNP Chr SNP Mbp Gene Novel rs7521902 1 22.164

    WNT4 NO rs6426749 1 22.385 WNT4 NO rs17482952 1 68.174 WLS NO rs12407028 1 68.182 WLS NO rs479336 1 172.23 DNM3OS NO rs1346004 2 165.745 GALNT3 NO rs6532023 4 87.853 MEPE NO rs1366594 5 89.08 MEF2C NO rs13245690 7 121.145 WNT16 NO rs3801387 7 121.335 WNT16 NO rs2062377 8 118.995 TNFRSF11B NO rs1373004 10 52.668 DKK1 NO rs7932354 11 46.701 LRP4 NO rs3736228 11 68.434 LRP5 NO rs2887571 12 1.529 WNT5B NO rs2016266 12 53.334 SP7 NO rs736825 12 54.024 HOXC6 NO rs1564981 16 50.952 CYLD NO rs1566045 16 50.988 CYLD NO rs4792909 17 43.721 MEOX1 NO rs4792909 17 43.721 SOST NO rs227584 17 44.148 HDAC5 NO GWAS SNP Chr SNP Mbp Gene Novel rs4233949 2 54.433 SPTBN1 YES rs17040773 2 111.742 MERTK YES rs13245690 7 121.145 CPED1 YES rs3801387 7 121.335 FAM3C YES rs2062377 8 118.995 SAMD12 YES rs7851693 9 130.603 FUBP3 YES rs7071206 10 77.642 KCNMA1 YES rs7071206 10 77.642 DLG5 YES rs7108738 11 15.689 INSC YES rs3736228 11 68.434 PPP6R3 YES rs1053051 12 106.973 TMEM263 YES rs11623869 14 103.417 MARK3 YES rs4790881 17 2.166 HIC1 YES rs4790881 17 2.166 SMG6 YES rs3790160 20 10.659 BTBD3 YES Osteoblast Functional Module (OFM) KNOWN NOVEL Prediction: Many OFM genes are likely to be responsible for their respective GWAS associations
  17. GWAS SNP Chr SNP Mbp Gene Novel rs7521902 1 22.164

    WNT4 NO rs6426749 1 22.385 WNT4 NO rs17482952 1 68.174 WLS NO rs12407028 1 68.182 WLS NO rs479336 1 172.23 DNM3OS NO rs1346004 2 165.745 GALNT3 NO rs6532023 4 87.853 MEPE NO rs1366594 5 89.08 MEF2C NO rs13245690 7 121.145 WNT16 NO rs3801387 7 121.335 WNT16 NO rs2062377 8 118.995 TNFRSF11B NO rs1373004 10 52.668 DKK1 NO rs7932354 11 46.701 LRP4 NO rs3736228 11 68.434 LRP5 NO rs2887571 12 1.529 WNT5B NO rs2016266 12 53.334 SP7 NO rs736825 12 54.024 HOXC6 NO rs1564981 16 50.952 CYLD NO rs1566045 16 50.988 CYLD NO rs4792909 17 43.721 MEOX1 NO rs4792909 17 43.721 SOST NO rs227584 17 44.148 HDAC5 NO GWAS SNP Chr SNP Mbp Gene Novel rs4233949 2 54.433 SPTBN1 YES rs17040773 2 111.742 MERTK YES rs13245690 7 121.145 CPED1 YES rs3801387 7 121.335 FAM3C YES rs2062377 8 118.995 SAMD12 YES rs7851693 9 130.603 FUBP3 YES rs7071206 10 77.642 KCNMA1 YES rs7071206 10 77.642 DLG5 YES rs7108738 11 15.689 INSC YES rs3736228 11 68.434 PPP6R3 YES rs1053051 12 106.973 TMEM263 YES rs11623869 14 103.417 MARK3 YES rs4790881 17 2.166 HIC1 YES rs4790881 17 2.166 SMG6 YES rs3790160 20 10.659 BTBD3 YES Osteoblast Functional Module (OFM) KNOWN NOVEL Prediction: Many OFM genes are likely to be responsible for their respective GWAS associations
  18. Chr. 14q32.32 GWAS locus Estrada, K. et al. (2012). Nature

    Genetics. 0 1 2 3 4 5 6 7 rs11623869 • • •• • • • • • • • • • • • • • • • • •• • • • • • • • • • • • • • • • • • • • • • • • • • • • • • • • • • • • • • • • • • • • • • • • • • • • • • • • •• • • • • • • • • • • •• • • • • • • • • • • • • • • • • • • • • • • • • • • • • • • • • • • • • • • • • • • • • • •• • • • • • • • • •• • • • • • • • • • • • • • • • • • • • • • • • • • • • • • • • • • • • • • • • • • • •• • • • • • • • • • •• • • • • • • • • • • • • • 0.2 0.4 0.6 0.8 r2 GEFOSII Femoral Neck BMD EIF5 SNORA28 MARK3 CKB TRMT61A BAG5 APOPT1 103.75 103.8 103.85 103.9 103.95 104 Position on chr14 (Mb) -log10(P-value) 9.00 9.25 9.50 9.75 10.00 0.06 0.07 0.08 0.09 0.10 Femoral BMD (g/cm2) Bone Mark3 Expression (log 2 (INT)) r=-0.25, P=0.036 Mark3 BMD Chang, E.-J. et al. (2008). Nature Medicine.
  19. Lennerz JK et al. (2010) Loss of Par-1a/MARK3/C-TAK1 kinase leads

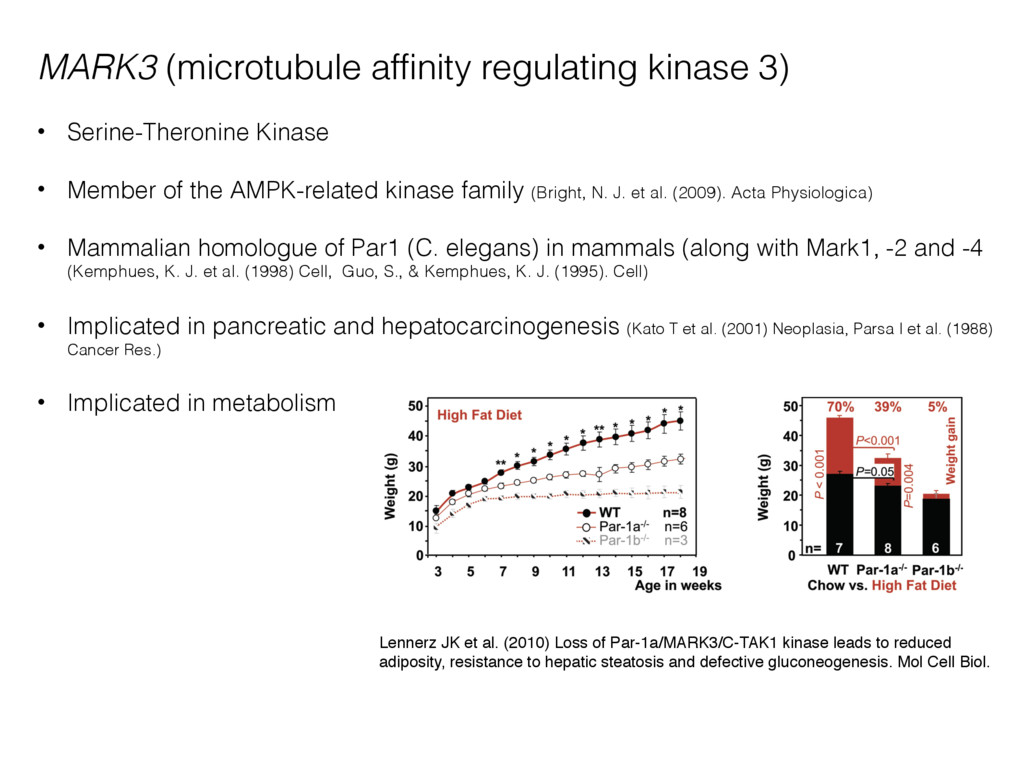
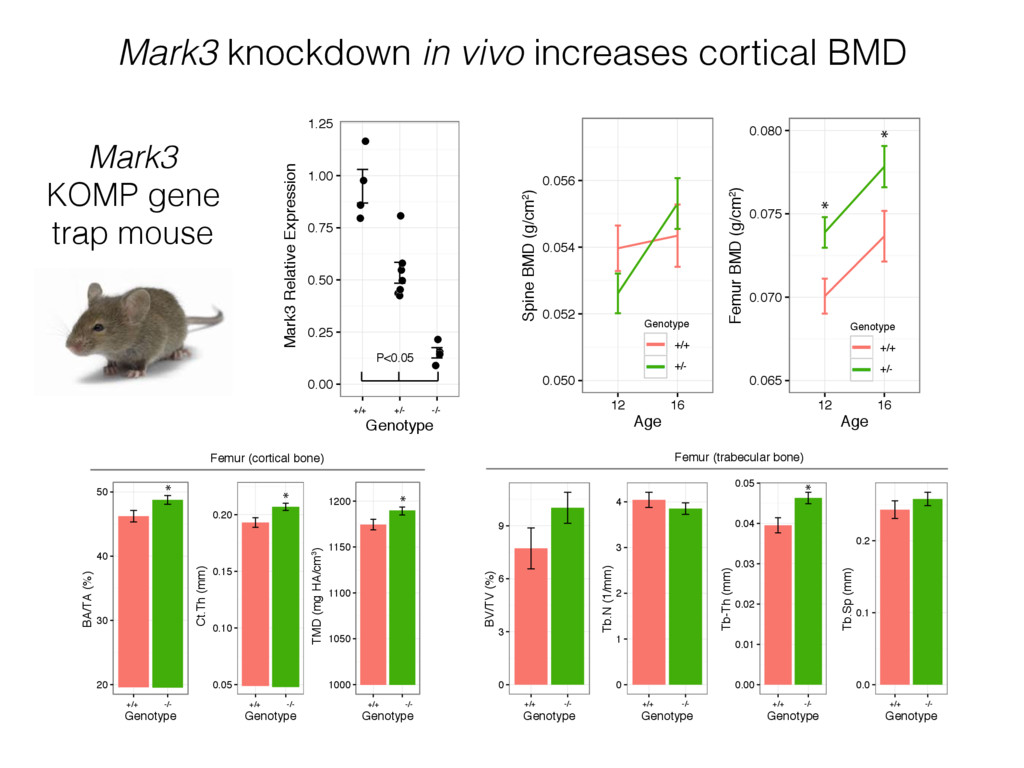
    to reduced adiposity, resistance to hepatic steatosis and defective gluconeogenesis. Mol Cell Biol. MARK3 (microtubule affinity regulating kinase 3) • Serine-Theronine Kinase • Member of the AMPK-related kinase family (Bright, N. J. et al. (2009). Acta Physiologica) • Mammalian homologue of Par1 (C. elegans) in mammals (along with Mark1, -2 and -4 (Kemphues, K. J. et al. (1998) Cell, Guo, S., & Kemphues, K. J. (1995). Cell) • Implicated in pancreatic and hepatocarcinogenesis (Kato T et al. (2001) Neoplasia, Parsa I et al. (1988) Cancer Res.) • Implicated in metabolism
  20. Primary calvarial osteoblasts Mark3 siRNAs Differentiate Quantify Mineralization SC Mark3_1

    Mark3_2 0.09 0.12 0.15 0.18 0.21 Alizarin Red (mM) SC Mark3 1 Mark3 2 P<0.05 0.00 0.25 0.50 0.75 1.00 SC Mark3 1 Mark3 2 Mark3 Relative Expression P<0.01
  21. 0.050 0.052 0.054 0.056 12 16 Age Spine BMD (g/cm2)

    0.065 0.070 0.075 0.080 12 16 Age Femur BMD (g/cm2) * * 0.00 0.25 0.50 0.75 1.00 1.25 +/+ +/- -/- Genotype Mark3 Relative Expression Genotype +/+ +/- Genotype +/+ +/- P<0.05 20 30 40 50 +/+ -/- Genotype BA/TA (%) 0.05 0.10 0.15 0.20 Genotype Ct.Th (mm) 1000 1050 1100 1150 1200 Genotype TMD (mg HA/cm3) * * * Femur (cortical bone) +/+ -/- +/+ -/- 0 3 6 9 Genotype BV/TV (%) 0 1 2 3 4 Genotype Tb.N (1/mm) 0.00 0.01 0.02 0.03 0.04 0.05 Genotype Tb-Th (mm) 0.0 0.1 0.2 Genotype Tb.Sp (mm) * Femur (trabecular bone) +/+ -/- +/+ -/- +/+ -/- +/+ -/- Mark3 knockdown in vivo increases cortical BMD 0.00 0.25 0.50 0.75 1.00 1.25 +/+ +/- -/- Genotype Mark3 Relative Expression P<0.05 Mark3 KOMP gene trap mouse
  22. GTEx Consortium. (2015). Science. MARK3 local eQTL Thyroid Prostate Pituitary

    Breast − Mammary Tissue Skin − Sun Exposed Skin − Not Sun Exposed Pancreas Adipose − Subcutaneous Nerve − Tibial BMD −0.05 0.00 0.25 0.50 Tissue rs11623869 “T” (standardized allele effect) MARK3 GTEX Thyroid 0 10 20 30 40 −log10 (p−value) • • • • • • • • • • • • • • • • • • • • • • • • • •• • • • • • • • • • • • • • • • • • • • • • • • • • • • • • • • • • • • • • • • • • • • • • • • • • • • • • • • • • • • • • • • • • • • • • • • • • • • • • • • • • • • • • • • • • • • • • • • • • • • • • • • • • • • • • • • • • • • • • •• • • • • • • • • • • • • • • • • • • • • • • • • • • • • • • • • • • • • • • • • • • • • • • • • • • • • • • • • • • • • • • • • • • • • • • • • • • • • • • • • • • • • • • • • • • • • • • • • • • • • • • • • • • • • • • • • • • • • • • • • • • • • • • • • • • • • • • • • • •• • • • •• • • • • • • • • • • • • • • • • • • • • • • • • • • • • • • • • • • • • • • • • • • • • • • • • • • • • • • • • • rs11623869 0.2 0.4 0.6 0.8 r2 EIF5 SNORA28 MARK3 CKB TRMT61A BAG5 APOPT1 103.75 103.8 103.85 103.9 103.95 104 Position on chr14 (Mb)
  23. Summary • Co-expression networks can be used to predict the

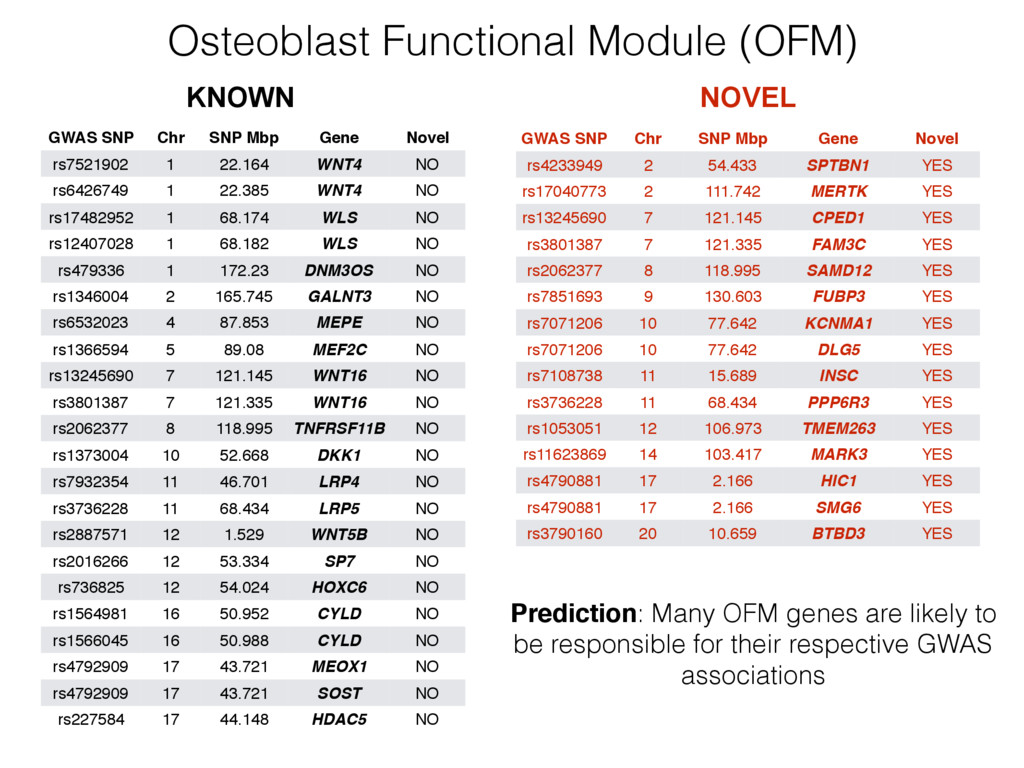
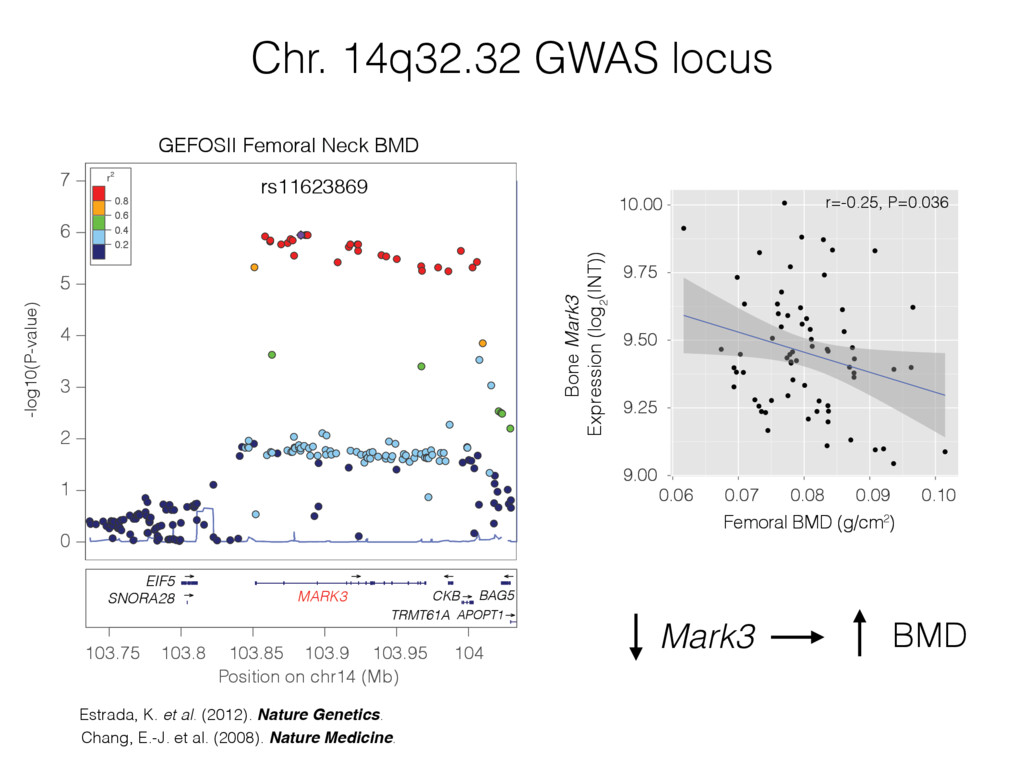
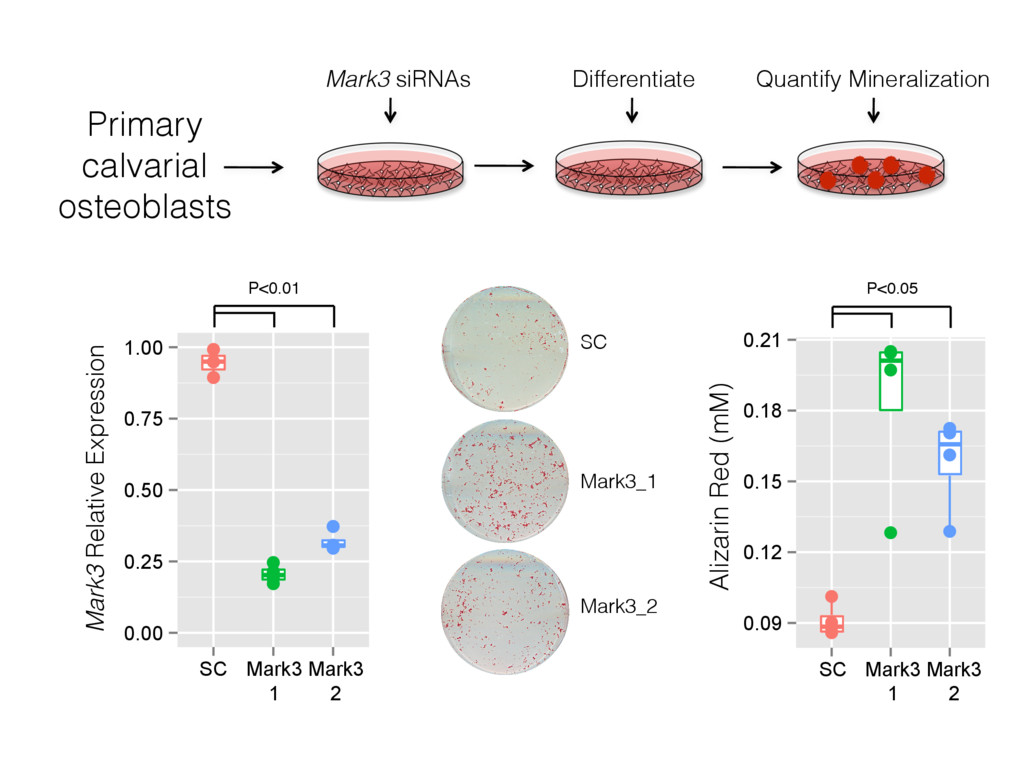
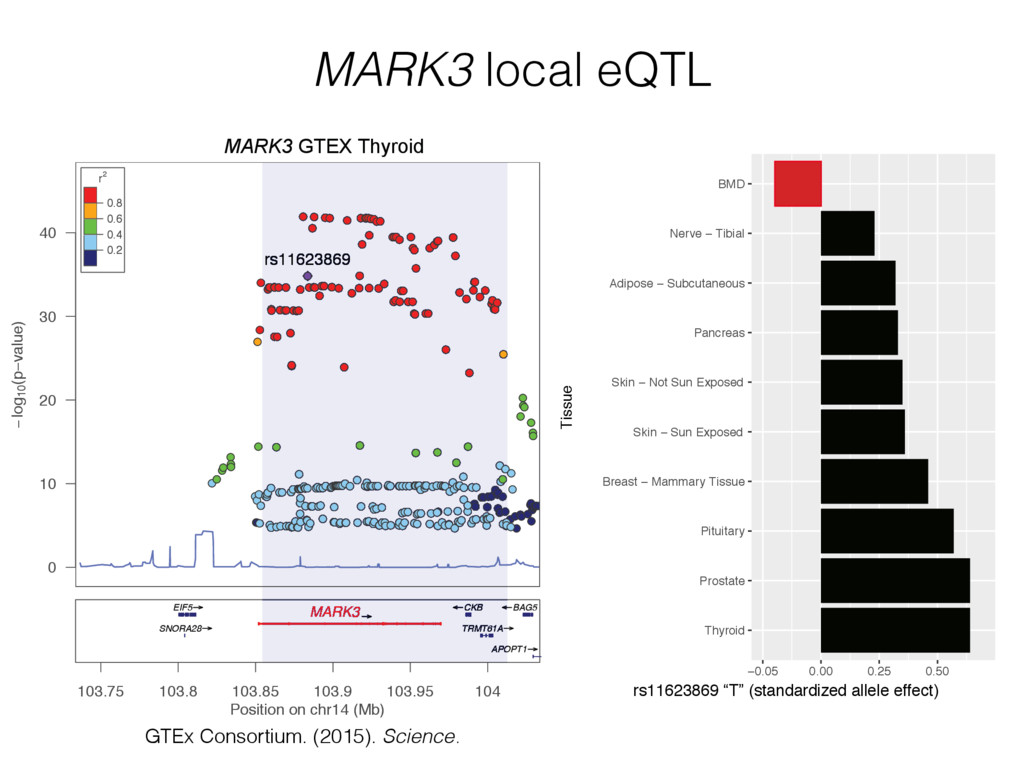
    identity and function of genes potentially responsible for BMD GWAS associations • Our data suggest that MARK3 is at least partially responsible for a BMD GWAS locus on Chr. 14.
  24. Future Directions • Continue to use predictions to develop and

    test new hypotheses • Expand to other bone-related GWAS data • Better ways to integrate (more sophisticated and more refined) networks with GWAS • Using these approaches to understand how genetic variation impacts network structure/function and how changes relate to disease
  25. Farber Lab • Gina Calabrese • Larry Mesner, Ph.D. •

    Olivia Sabik • Basel Al-Barghouthi • Ingrid Braenne, Ph.D. • Robert Rotzin Maine Medical Center Research Institute • Cliff Rosen, M.D. Yale • Mark C. Horowitz, Ph.D. • Steve Tommasini, Ph.D. University of Maryland • Joe Stains, Ph.D. John Hopkins • Tom Clemens, Ph.D.