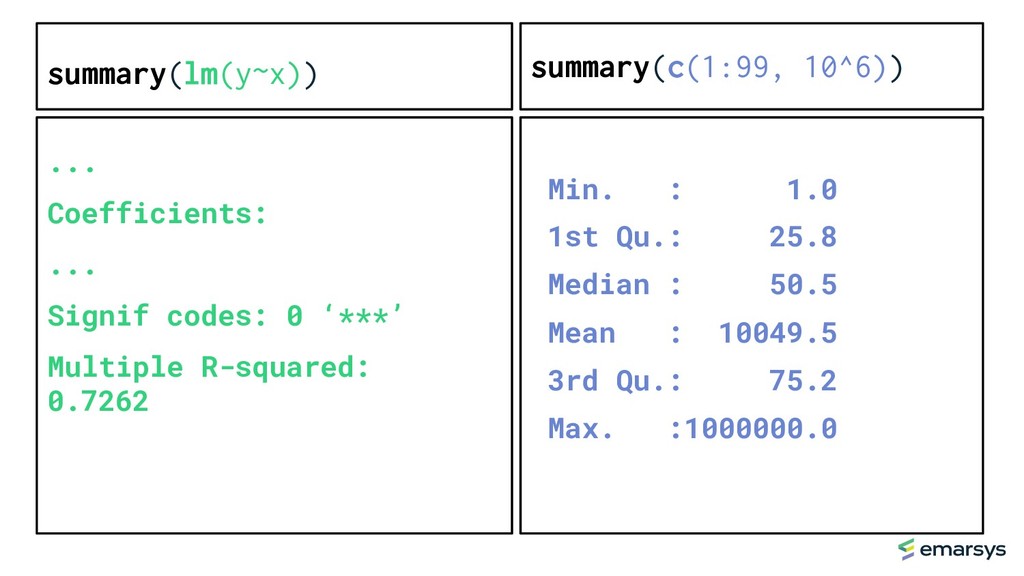
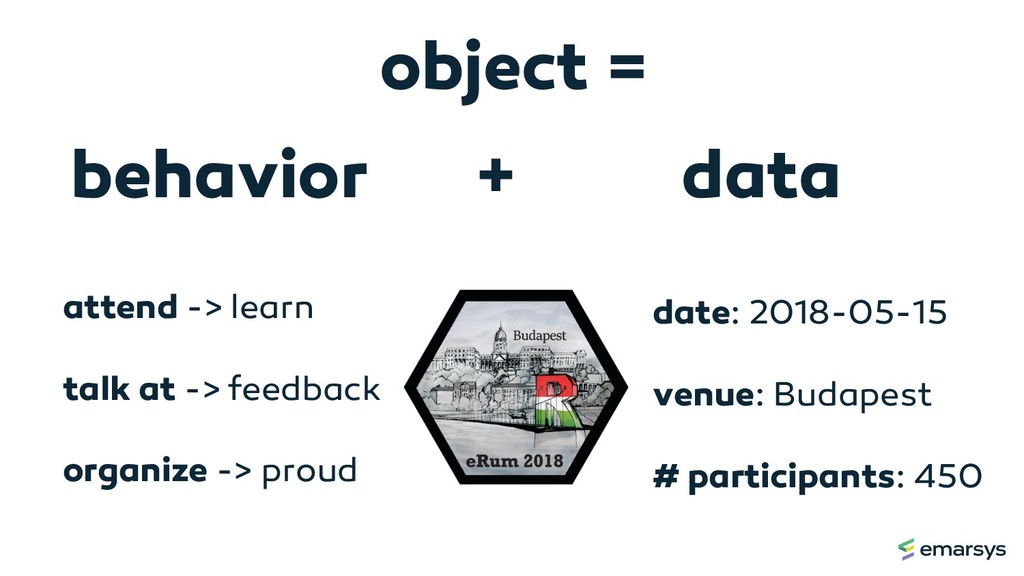
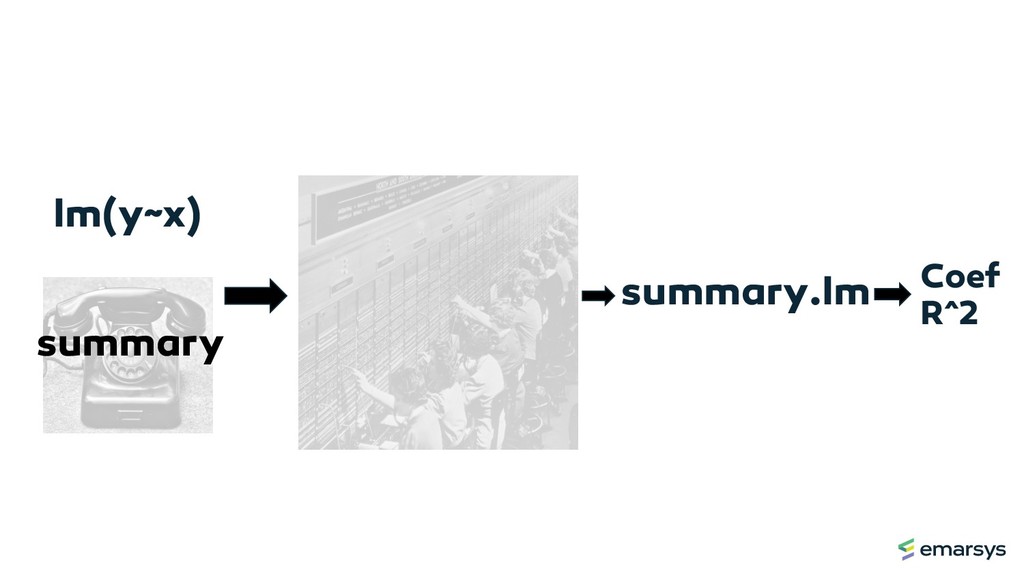
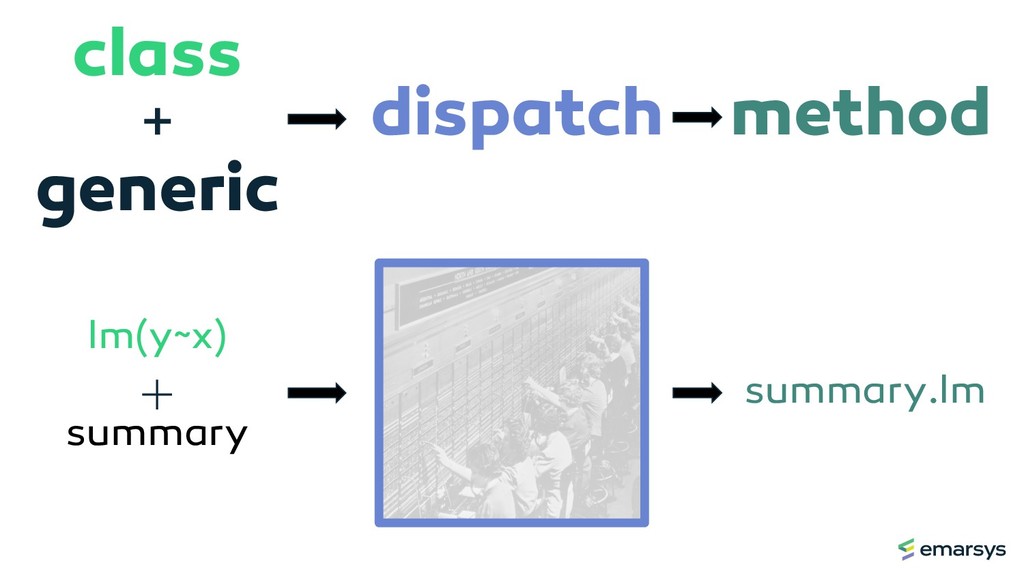
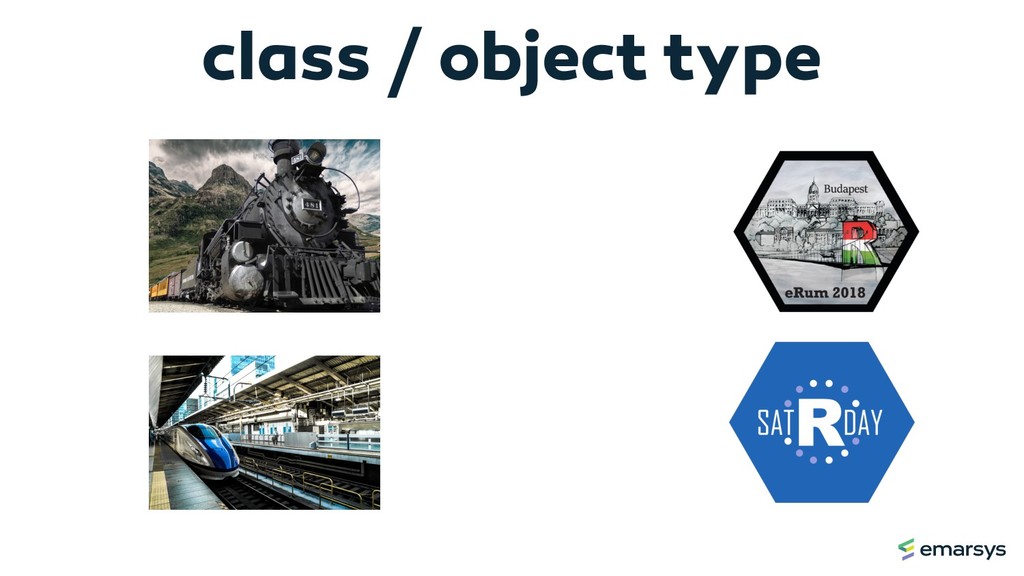
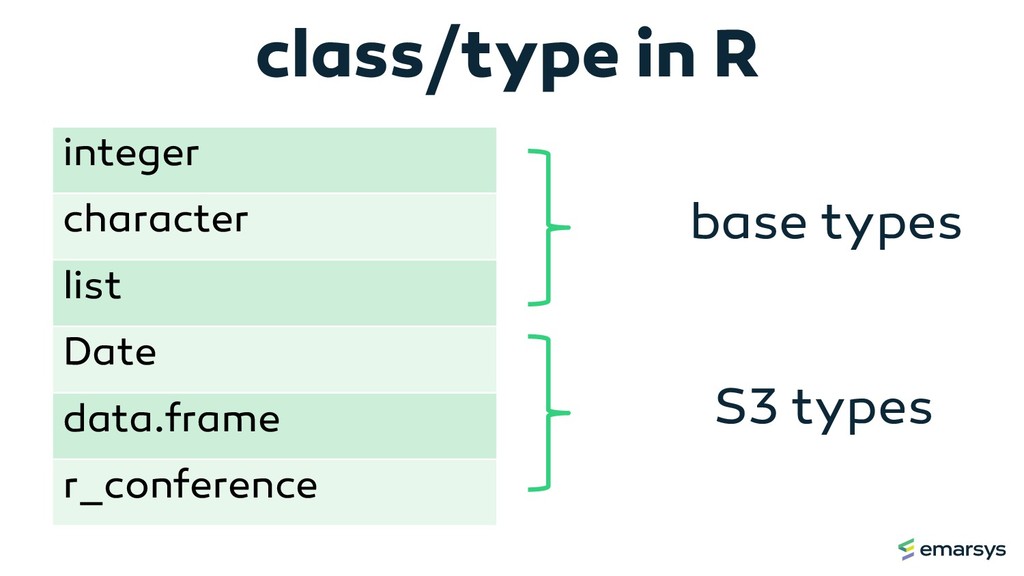
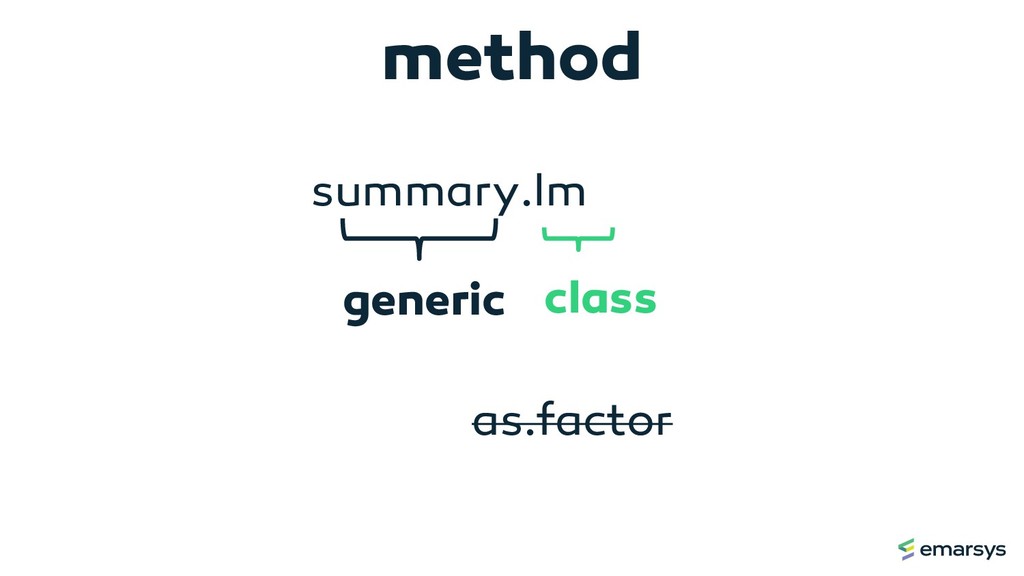
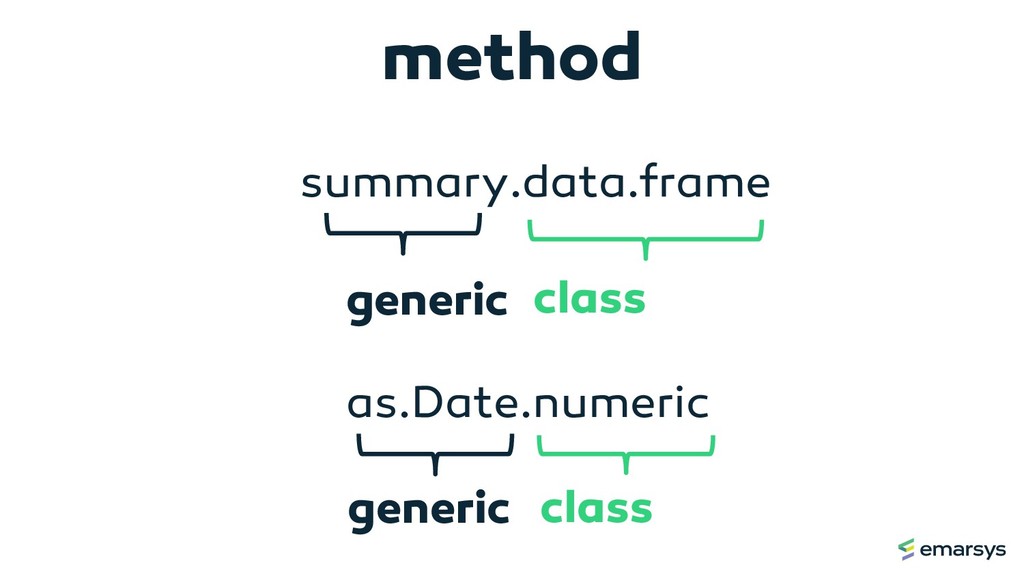
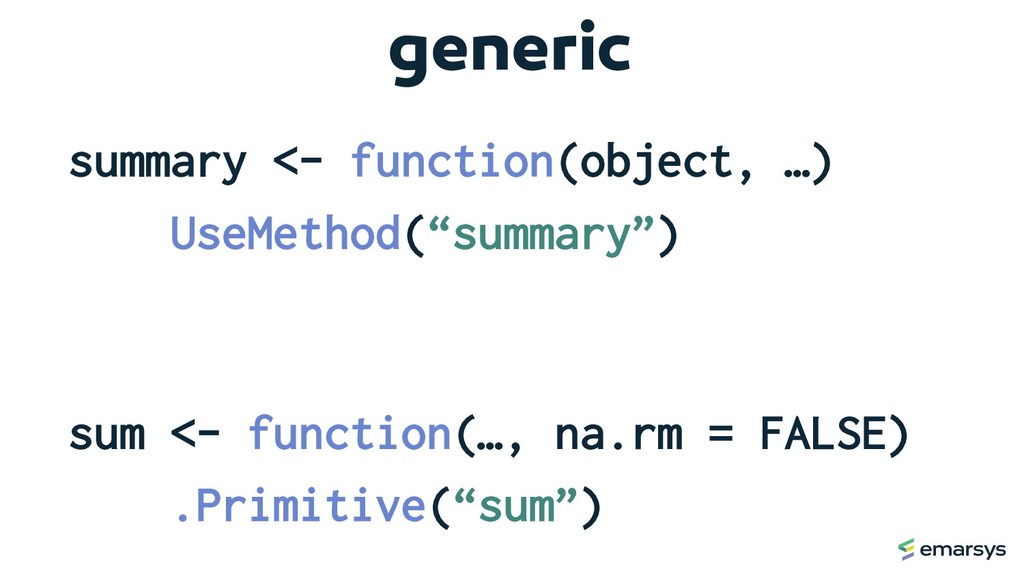
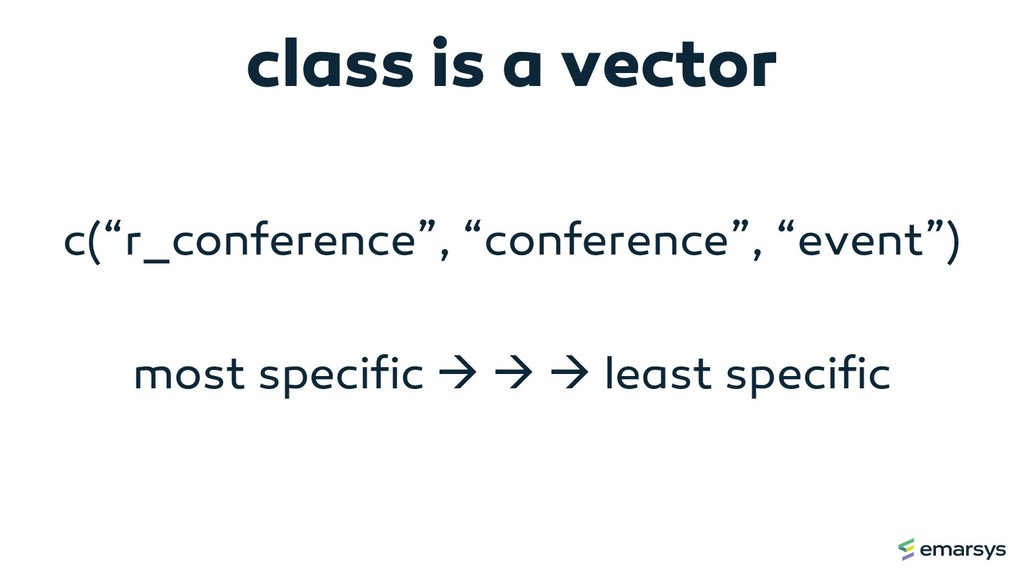
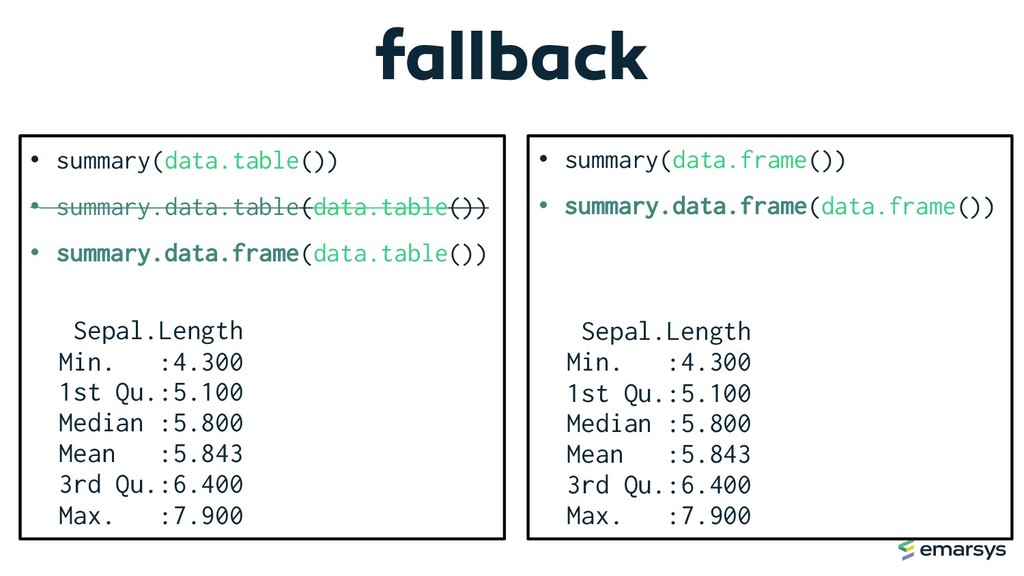
All R users have used S3, the oldest and most prominent object-oriented system in R even if they were unaware of it, for example by using the summary function both for data frames and for linear models. The two main building blocks of an object-oriented system are objects with specific type (class) and functions (methods) which behave differently depending on the class of their parameters. Most R users probably also had an experience where they got unexpected results which would have been easier to understand with a foundation in object-oriented systems in R. This talk aims to fill some of the gaps so that you can work confidently with existing code utilizing S3 or S4.
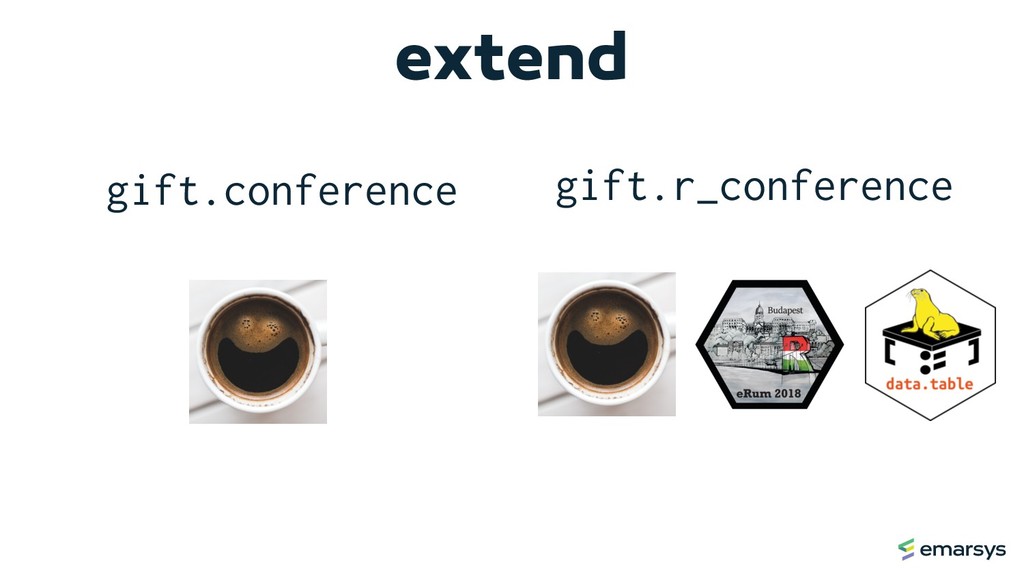
The three widely used object-oriented systems are S3, S4 and R6. This talk will focus on S3 which is the most widely used and assume no prior knowledge of object-oriented systems. I will start with a visual explanation of the most important concepts and then I will show you how understanding the basics can help you in your day-to-day work. I will guide you with examples and show hands-on tricks to understand, debug and get the documentation of existing code utilizing S3 or S4.