Upgrade to Pro — share decks privately, control downloads, hide ads and more …

Bringing back the excitement to data analysis

Bringing back the excitement to data analysis

MC Brown VP TechPubs & Education @Couchbase, talk at Data Science London @ds_ldn 19/09/12

Data Science London

September 24, 2012
Tweet

More Decks by Data Science London

Other Decks in Technology

Transcript

  1. 1   Bringing  the  excitement  back  to   data  analysis

      MC  Brown   VP,  TechPubs  and  Educa?on  
  2. 2   In  the  year  1992….   •  Freetext  Database

     =  Document/NoSQL  Database   •  Massive  Datasets   –  19043  records!!!   –  Approx.  8k  per  record  
  3. 3   The  Drug   •  Data  Analysis  was  ‘Exci?ng’

      •  2-­‐3  days  to  write  the  analysis  program   •  Processing  would  occur  overnight   •  Sta?s?cs  required  ‘whole  set’  processing  
  4. 4   The  Hit   •  Mornings  were  ‘the  hit’

          •  The  joy  of  real  data  analysis  is  the   output  of  a  good  report   •  Get  good  stats   –  I  know  how  many  teachers  teach  Geography  in  Scotland!   –  I  know  400  people  have  purchased  our  History  so]ware!   •  The  wait  and  the  results  kept  us  working  
  5. 5   In  the  year  2002   •  Grid  compu?ng

     was  the  drug   •  Building  200-­‐2000  node  grid  systems   •  Analysis  could  happen  the  same  day   •  Datasets  could  be  huge   –  They  just  took  more  hours   •  S?ll  working  on  en?re  datasets   –  Sta?s?cs  s?ll  required  whole  set  process   •  Jobs  became  monotonous   •  More  about  construc?on  and  technology  than  stats    
  6. 6   In  the  year  2012   •  Need  info

     and  sta?s?cs  quicker  than  ever   •  Database  clusters  provide  the  backbone   –  Grids  without  the  headache   •  Build  a  query  in  seconds;  Get  the  result  in  seconds   •  Need  sta?s?cs  in  different  ways:   –  Live   –  Online  (and  some?mes  user  visible)   –  Whole  of  set  and  par?al  set,  but  based  on  Big  Data   •  Slice  and  dice  in  more  ways  without  effort    
  7. 7   Couchbase  Background  Stats   •  Couchbase  1.8  already

     hits  interes?ng  numbers   •  Draw  Something  (OMGPOP),  within  6  weeks:   –  15  million  daily  ac?ve  users     –  3000  drawings  generated  every  two  seconds   –  Over  two  billion  stored  drawings   –  90  nodes   –  3  clusters   –  No  stops!  
  8. 8   The  new  drug   •  Couchbase  Server  2.0

      •  Cluster-­‐based  database   •  Fast,  Scalable,  Predictable   •  Map/Reduce  based  querying   •  JavaScript/Web-­‐based  interface   –  Type  in  your  query,  get  your  results   •  Instant  Gra?fica?on!  
  9. 9   The  Data  End   •  Store  data  however

     you  want   •  The  Map  will  sort  it  out  for  us  
  10. 11   Map/Reduce  Creates  Indexes   •  Not  Hadoop  

    •  Map/Reduce  creates  an  index   •  Map  *AND*  Reduce  output  are  stored   •  Index  is  used  for  queries   •  Makes  queries  faster  (obviously!)   •  Index  is  ‘materialized’  at  query  ?me   –  Updated,  not  recreated   •  Incremental  map/reduce  
  11. 13   Reduce   •  Reduce  summarizes  data   • 

    Built-­‐in  func?ons   –  _sum   –  _count   –  _stats   {! "value" : {! "count" : 3,! "min" : 5000,! "sumsqr" : 594000000,! "max" : 20000,! "sum" : 38000! },! "key" : [! "James"! ]! },!
  12. 15   Incremental  Reduce   •  Required  at  two  levels

      –  During  cluster-­‐based  queries     –  During  index  updates   •  Incremental  reduce  requires  prepara?on   •  Reduce  func?ons  must  be  able  to  consume  their  own   output   •  Roll-­‐your-­‐own  only   –  No  external  libraries  
  13. 16   Tips  for  incremental   •  Use  simple  values

     when  possible   •  Use  complex  (JSON)  structures   –  Allows  for  more  incremental  structure   –  Store  the  ‘current’  result   –  Store  the  informa?on  needed  for  the  incremental  result   •  Iden?fy  rereduce:   –  func?on(key,  value,  rereduce)  {}  
  14. 17   Simple  reduce  (incremental  average)   function(key, values, rereduce)

    {! var result = {total: 0, count: 0};! for(i=0; i < values.length; i++) {! if(rereduce) { result.total = result.total + values[i].total; result.count = result.count + values[i].count; } else { result.total = sum(values); result.count = values.length; } } return(result); ! }!
  15. 18   Combining  Reduce  with  Complex  Keys   •  Example:

     logging  data  with  date?me   •  Explode  the  date:   –  [  year  ,  month,  day,  hour,  minute]   •  Now  you  can  query:   –  Single  Date:  [2012,  9,  19]   –  Mul?ple  Dates:  [  [  2012,  9,  19],  [2012,  9,  10]  ]     –  Range  (hours)  [2012,  9,  0,  9,  0]  –  [2012,  9,  30,  21,  0]   –  Range  (days)  [  2012,  1,  1]  –  [2012,  9,  19]   –  Range  (months)  [  2009,  9]  –  [2012,3]   •  And  you  can  calculate  aggregate  sta?s?cs  
  16. 19   Complex  reduce   function(key, data, rereduce) {! var

    response = {"warning" : 0, "error": 0, "fatal" : 0 };! for(i=0; i<data.length; i++) {! if (rereduce) {! response.warning = response.warning + data.warning;! response.error = response.error + data.error;! response.fatal = response.fatal + data.fatal;! } else {! if (data[i] == "warning") {! response.warning++;! }! if (data[i] == "error" ) {! response.error++;! }! if (data[i] == "fatal" ) {! response.error++;! }! }! }! return response;! }!
  17. 20   Complex  reduce  output   {"rows":[ {"key":[2010,7], "value":{"warning":4,"error":2,"fatal":0}}, {"key":[2010,8],

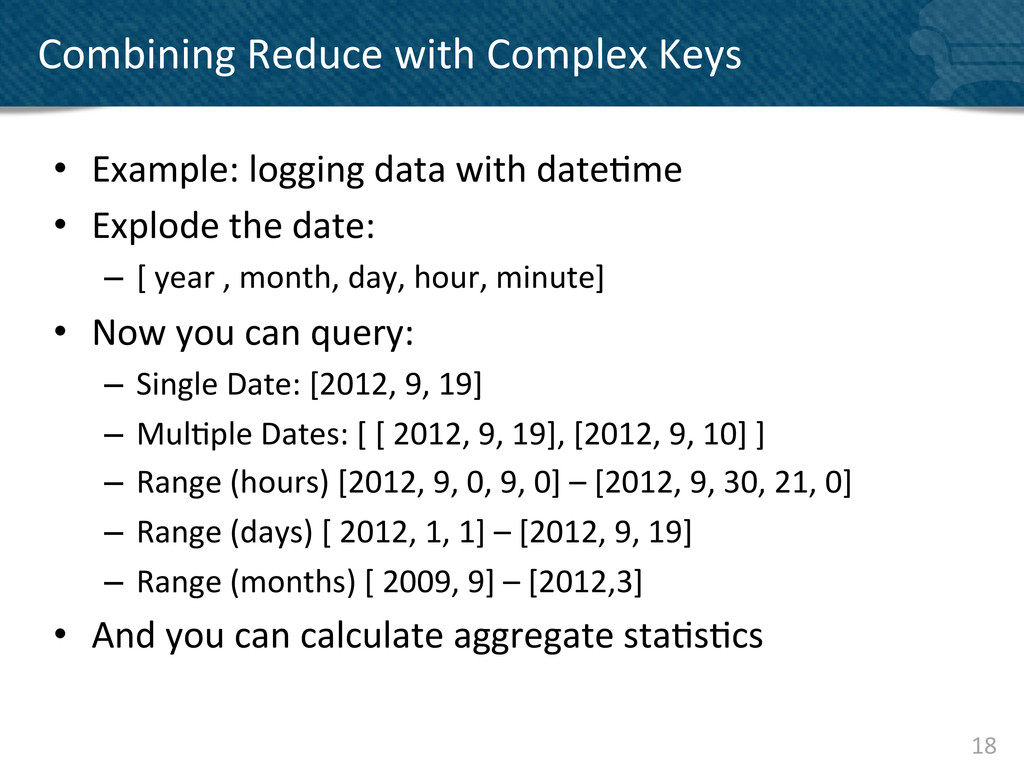
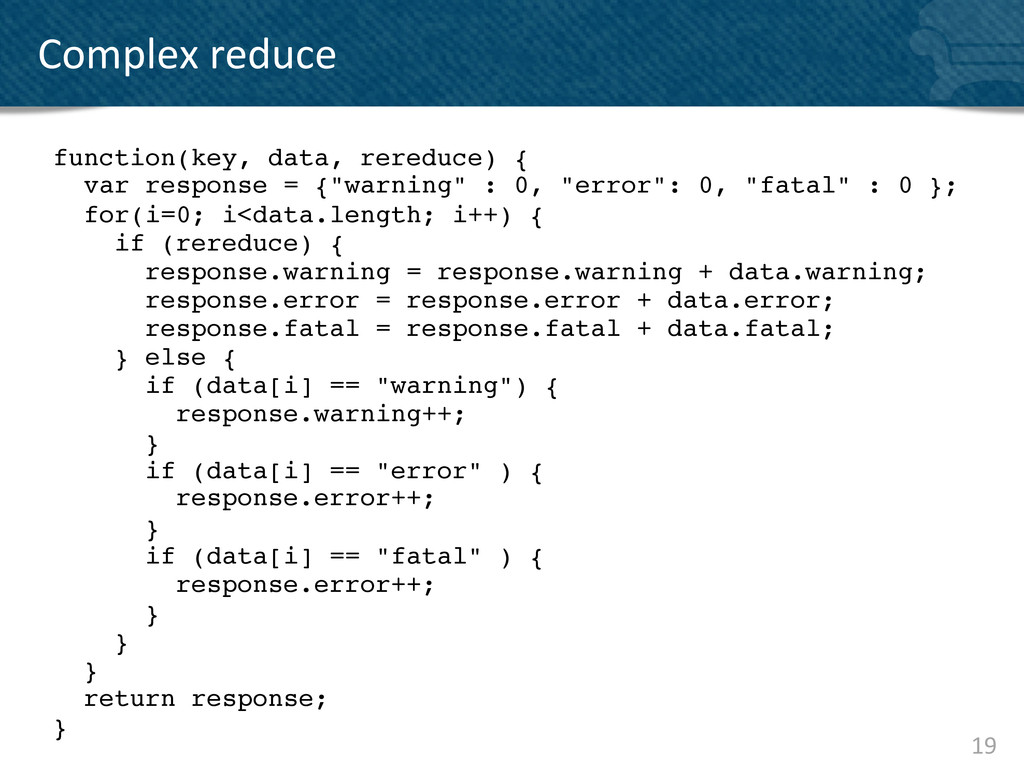
    "value":{"warning":4,"error":3,"fatal":0}}, {"key":[2010,9], "value":{"warning":4,"error":6,"fatal":0}}, {"key":[2010,10],"value":{"warning":7,"error":6,"fatal":0}}, {"key":[2010,11],"value":{"warning":5,"error":8,"fatal":0}}, {"key":[2010,12],"value":{"warning":2,"error":2,"fatal":0}}, {"key":[2011,1], "value":{"warning":5,"error":1,"fatal":0}}, {"key":[2011,2], "value":{"warning":3,"error":5,"fatal":0}}, {"key":[2011,3], "value":{"warning":4,"error":4,"fatal":0}}, {"key":[2011,4], "value":{"warning":3,"error":6,"fatal":0}} ] } !
  18. 21   Why  is  the  excitement  back?   •  Data

     in  is  easy;  no  schema,  no  formavng,  no  updates   •  Data  out  is  about  the  stats   –  Not  how  we  are  going  to  produce  them   •  Queries  are  live   •  Tweaks  and  updates  and  extensions  are  live   •  Mul?ple  views,  mul?ple  queries   •  Reduce  is  op?onal  (raw  data)   •  Massive  datasets  are  not  a  problem