Dmytro Karamshuk King's College London Based on the paper: D. Karamshuk, A. Noulas, S. Scellato, V. Nicosia, C. Mascolo. Geo-Spotting: Mining Online Location-based Services for Optimal Retail Store Placement. ACM SIGKDD Conference on Knowledge Discovery and Data Mining (KDD), Chicago, 2013
the case of retail service development in a closed population. In Academy of Marketing Studies, volume 15, page 13, 2010. • O. Berman and D. Krass. The generalized maximal covering location problem. Computers & Operations Research, 29(6):563–581, 2002. • A. Kubis and M. Hartmann. Analysis of location of large-area shopping centres. a probabilistic gravity model for the halle-leipzig area. Jahrbuch für Regionalwissenschaft, 27(1):43–57, 2007. • Pablo Jensen. Network-based predictions of retail store commercial categories and optimal locations. Phys. Rev. E, 74:035101, Sep 2006. The problem is not new Our approach: explore fine-grained and cheap data from LBSN
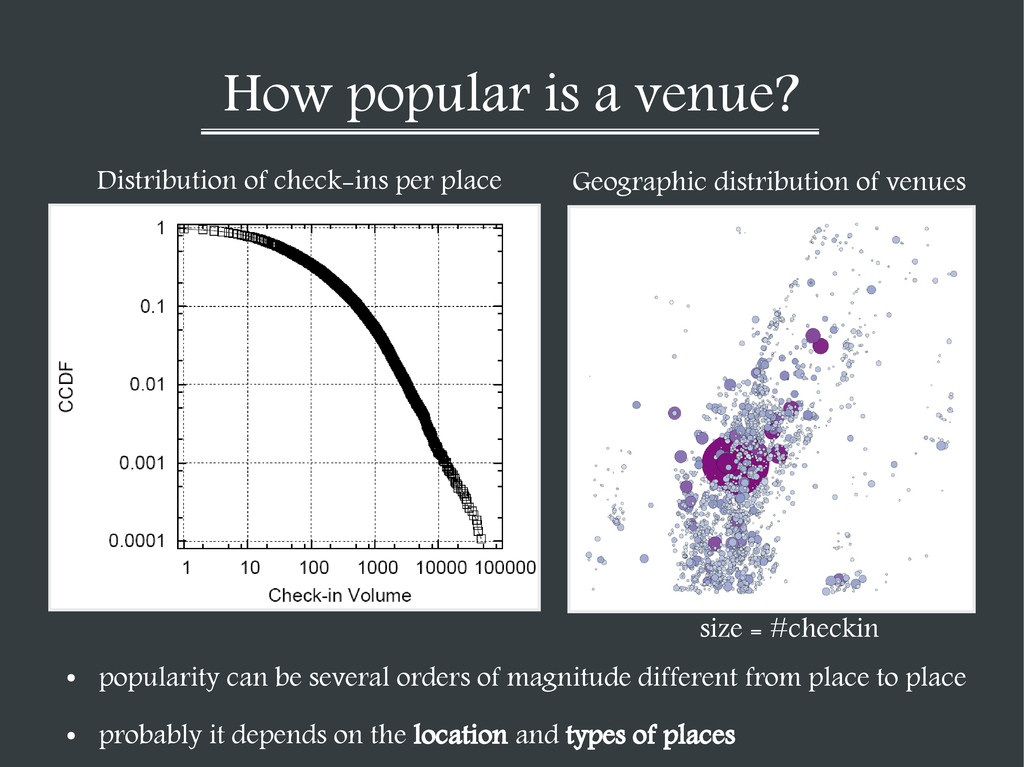
orders of magnitude different from place to place Distribution of check-ins per place Geographic distribution of venues size = #checkin • probably it depends on the location and types of places
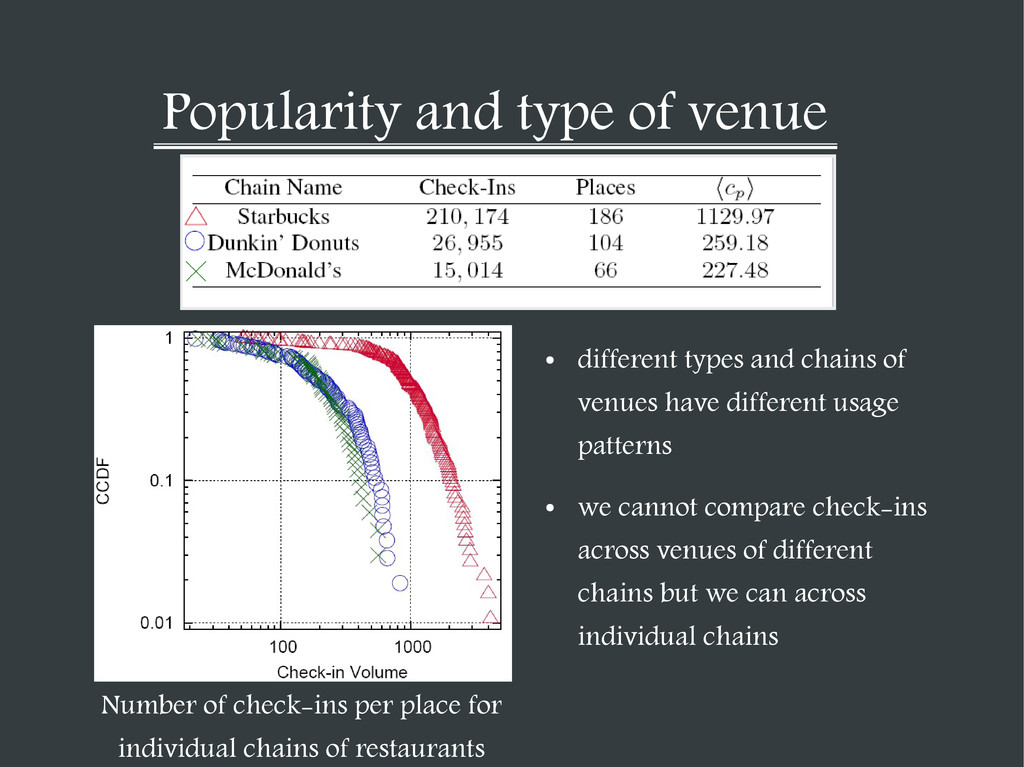
of venues have different usage patterns • we cannot compare check-ins across venues of different chains but we can across individual chains Number of check-ins per place for individual chains of restaurants
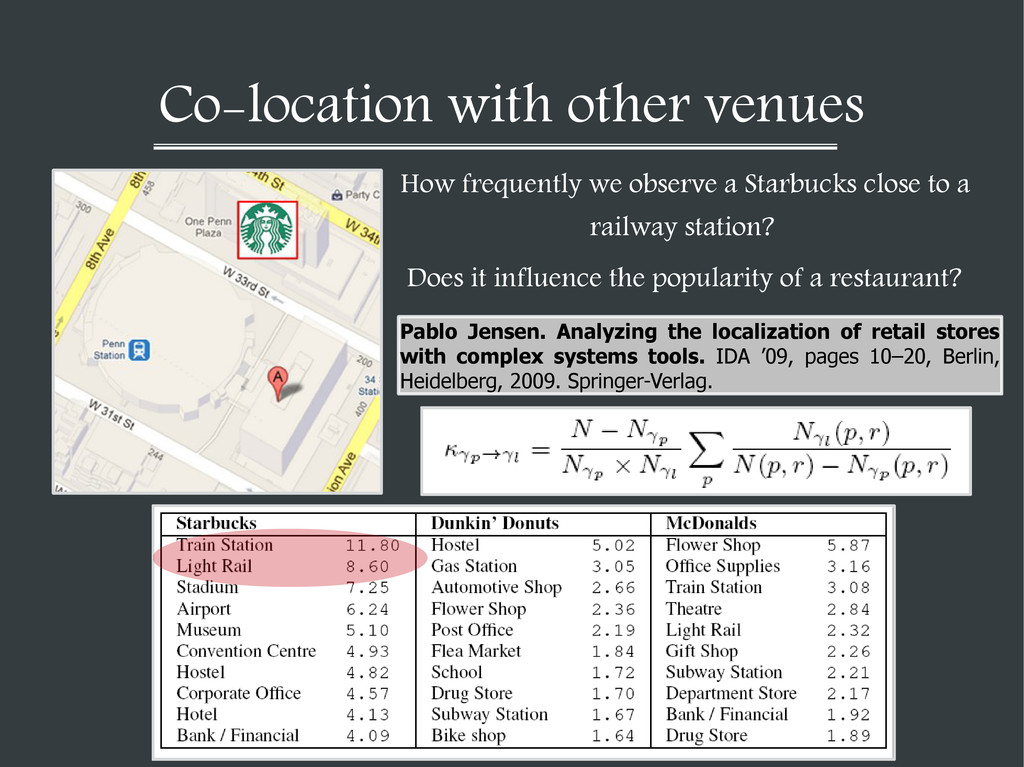
close to a railway station? Does it influence the popularity of a restaurant? Pablo Jensen. Analyzing the localization of retail stores with complex systems tools. IDA ’09, pages 10–20, Berlin, Heidelberg, 2009. Springer-Verlag.
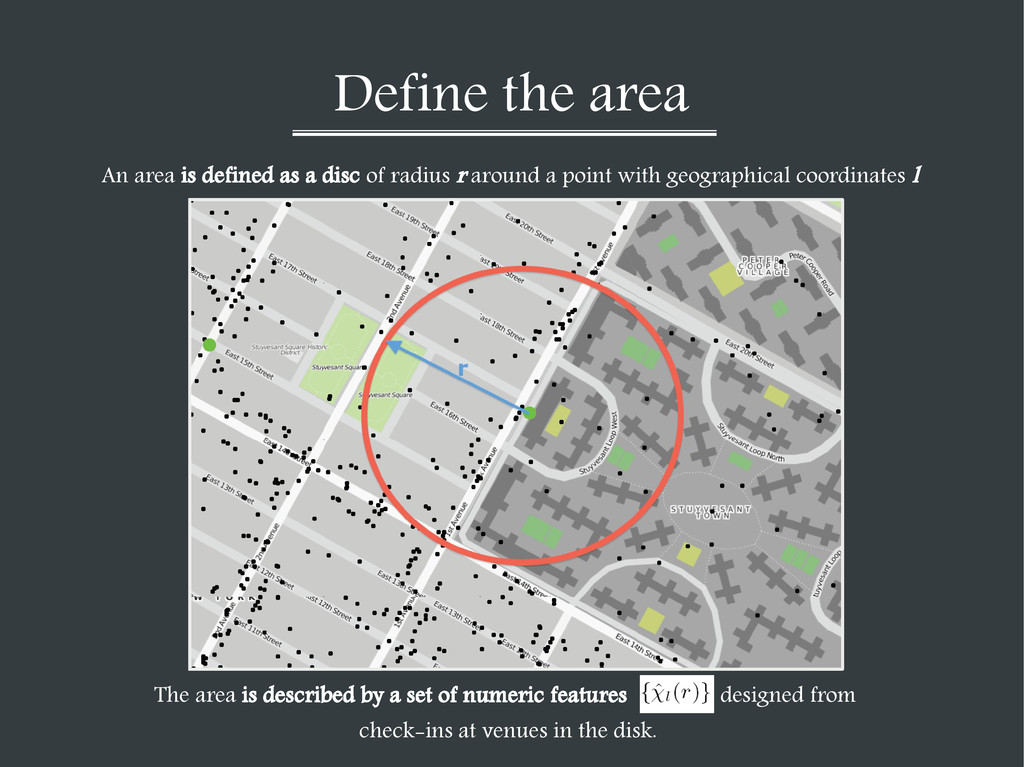
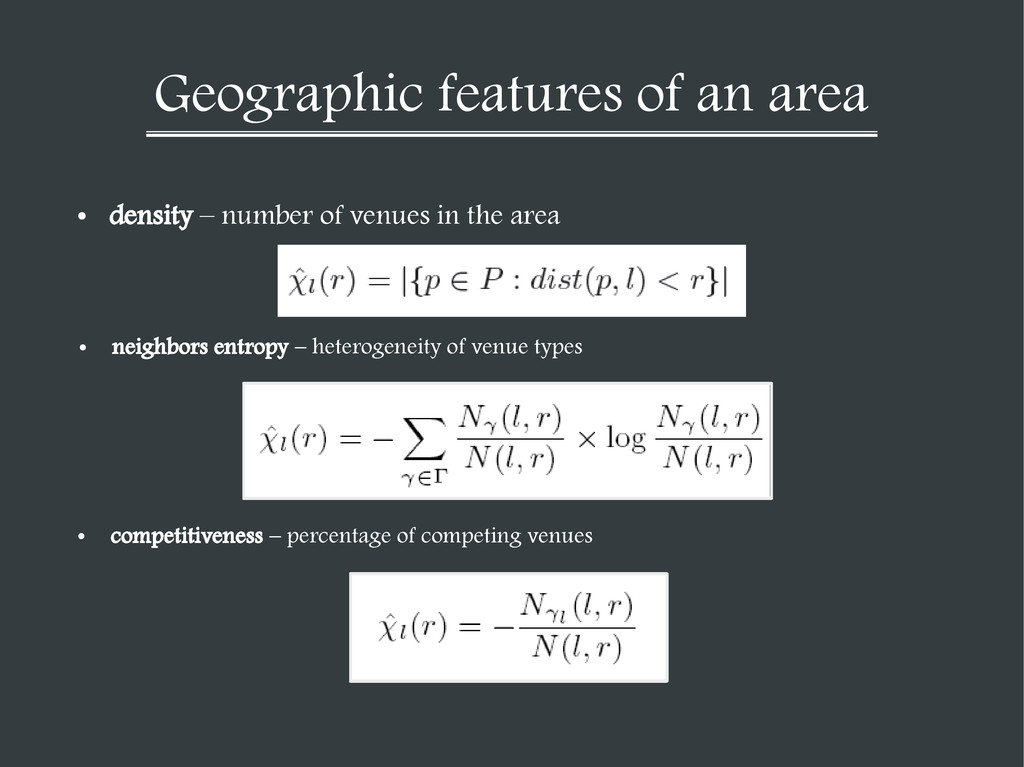
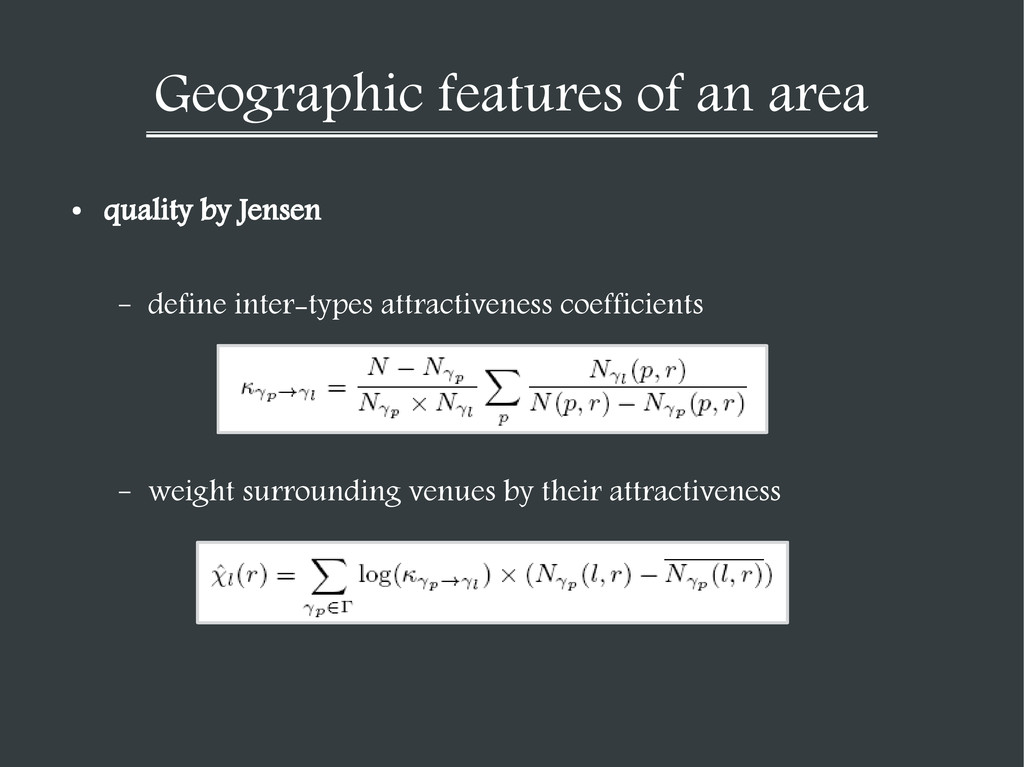
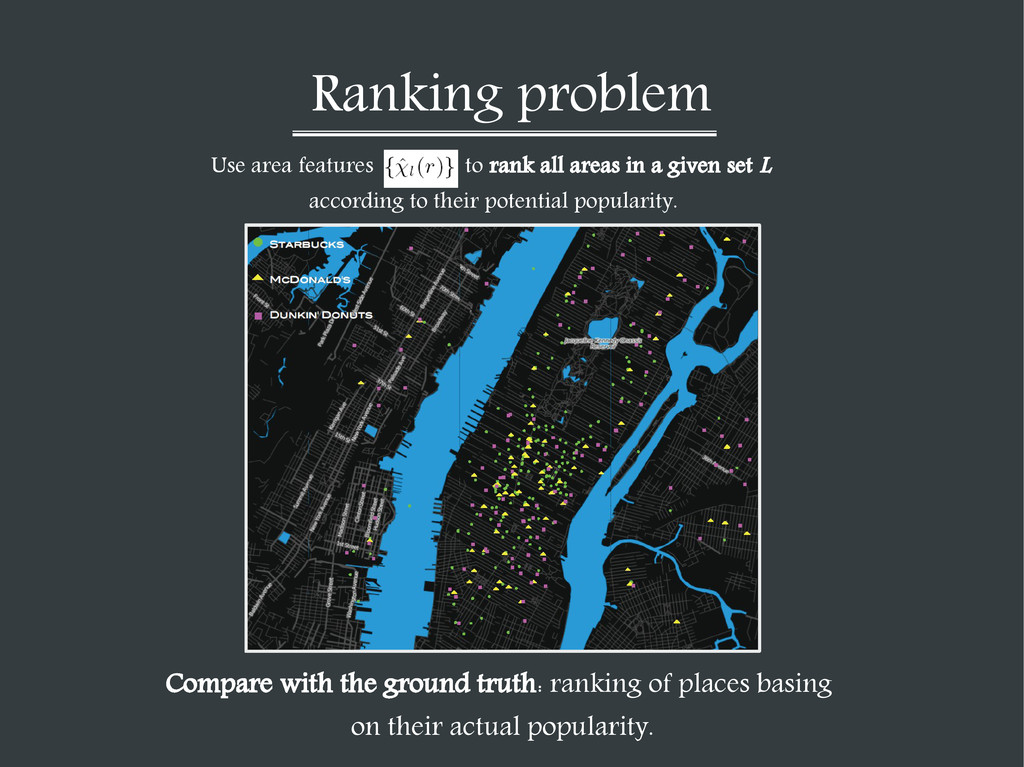
of radius r around a point with geographical coordinates l The area is described by a set of numeric features designed from check-ins at venues in the disk.
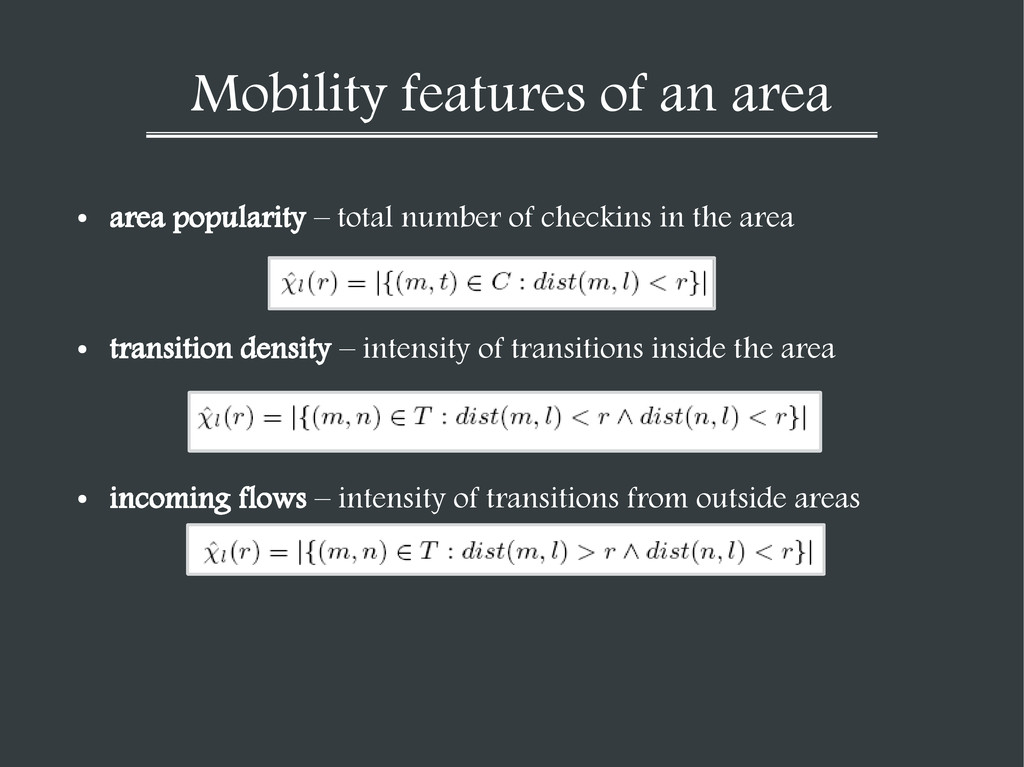
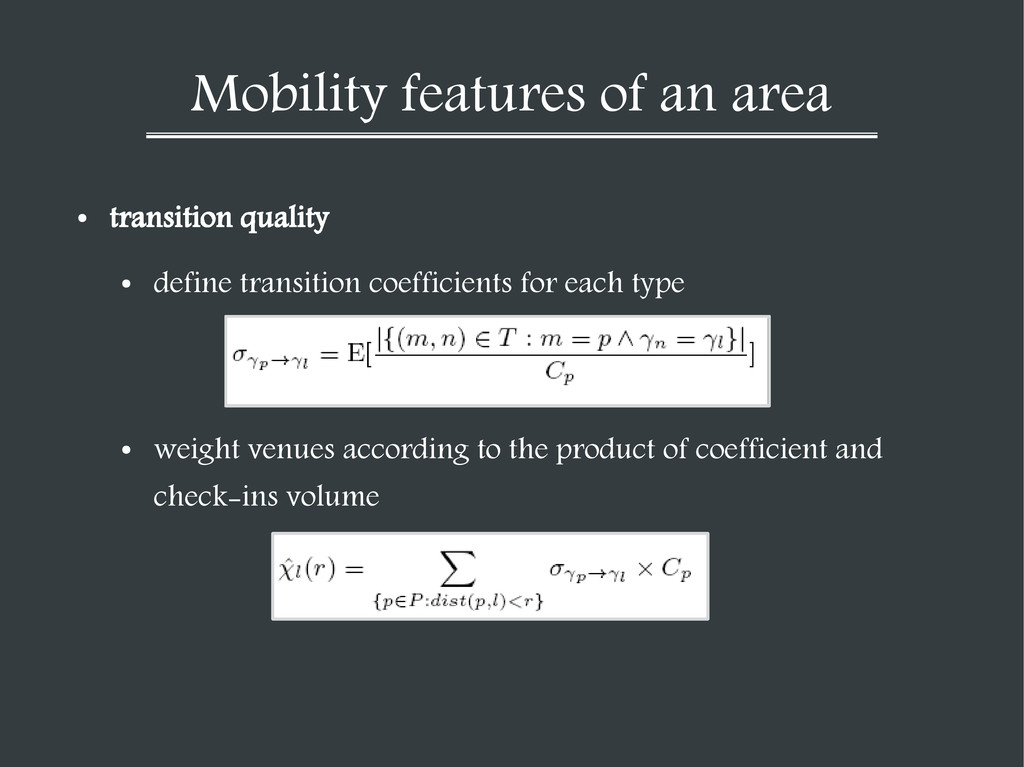
number of checkins in the area • transition density – intensity of transitions inside the area • incoming flows – intensity of transitions from outside areas
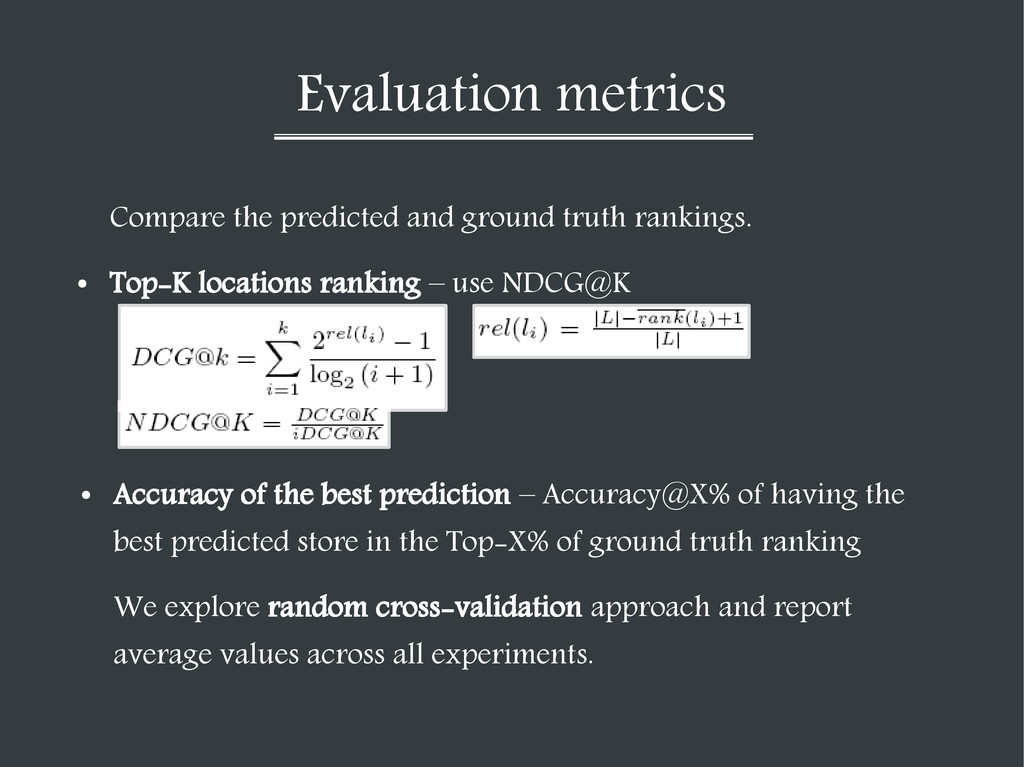
Top-K locations ranking – use NDCG@K • Accuracy of the best prediction – Accuracy@X% of having the best predicted store in the Top-X% of ground truth ranking We explore random cross-validation approach and report average values across all experiments.
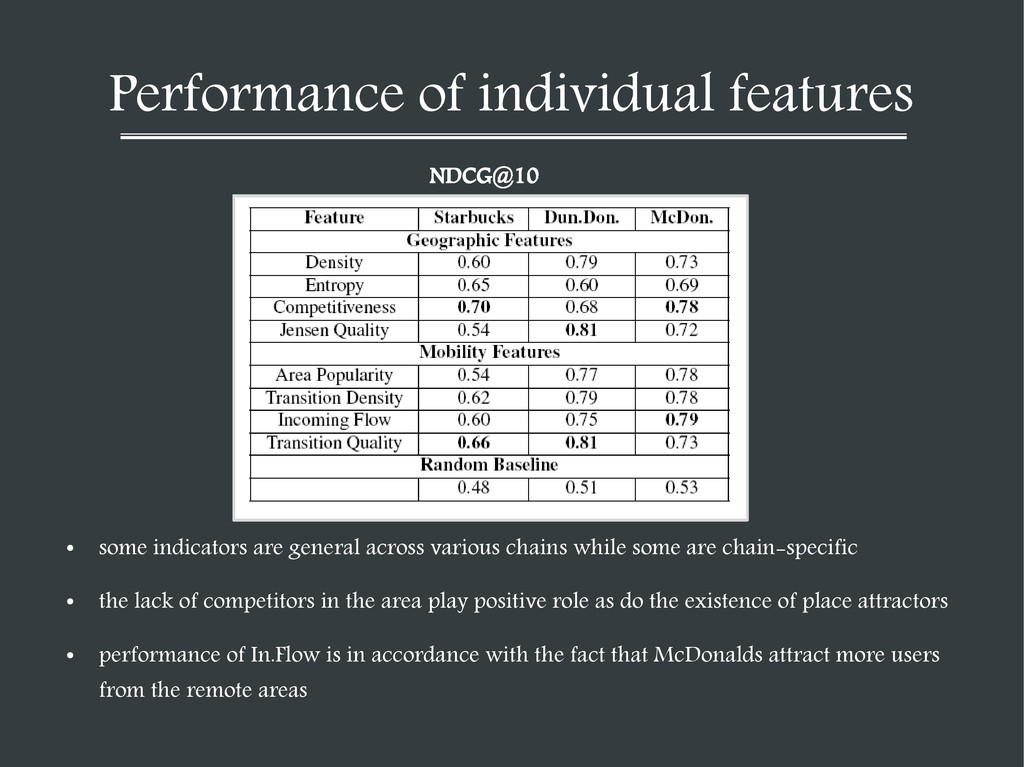
various chains while some are chain-specific • the lack of competitors in the area play positive role as do the existence of place attractors • performance of In.Flow is in accordance with the fact that McDonalds attract more users from the remote areas NDCG@10
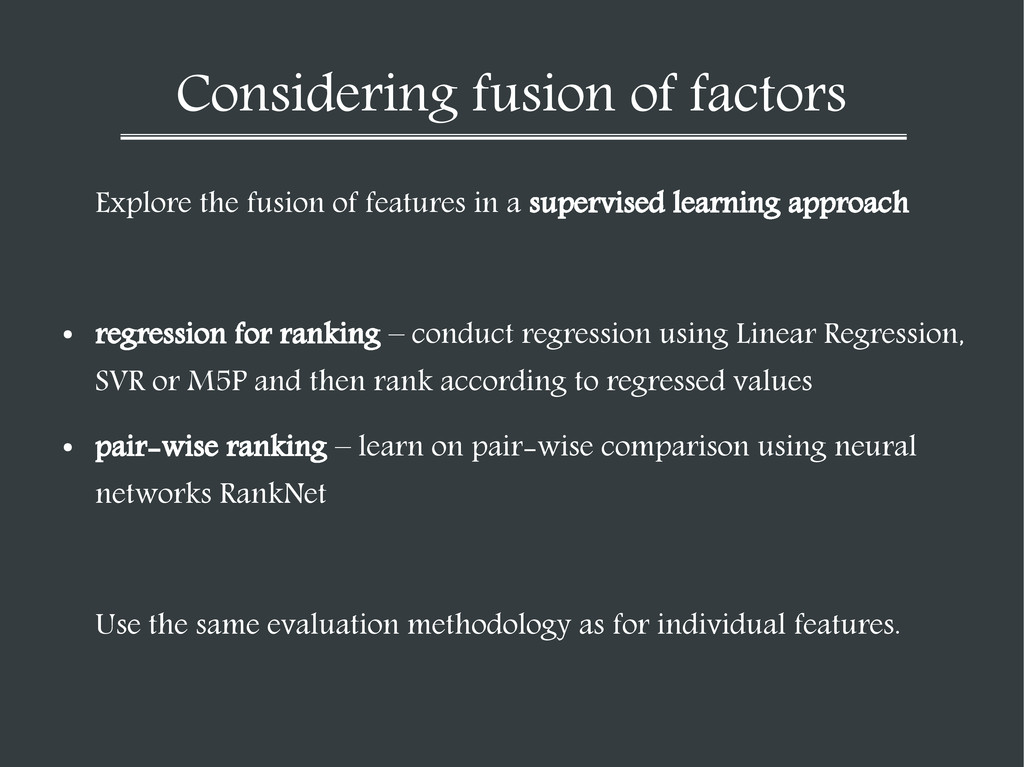
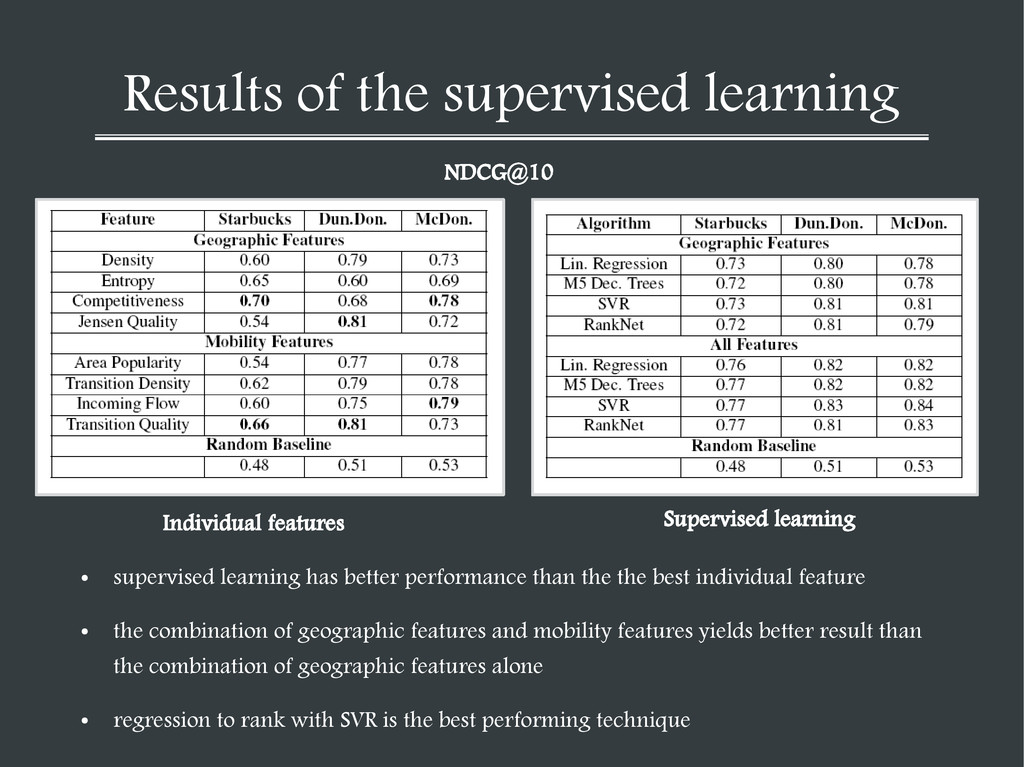
a supervised learning approach • regression for ranking – conduct regression using Linear Regression, SVR or M5P and then rank according to regressed values • pair-wise ranking – learn on pair-wise comparison using neural networks RankNet Use the same evaluation methodology as for individual features.
performance than the the best individual feature • the combination of geographic features and mobility features yields better result than the combination of geographic features alone • regression to rank with SVR is the best performing technique NDCG@10 Individual features Supervised learning
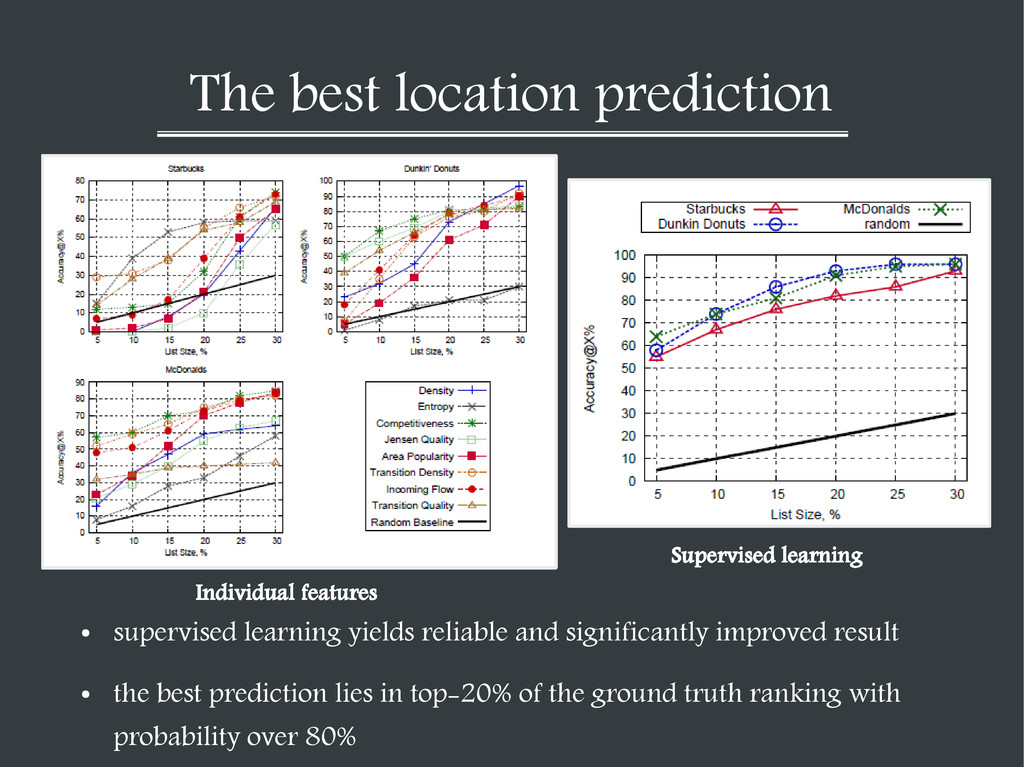
significantly improved result • the best prediction lies in top-20% of the ground truth ranking with probability over 80% Individual features Supervised learning
networks can be effectively explored in geographic retail analysis • this can inspire further works in location-based advertising, developing indexes of urban areas, provision of location-based services etc. etc. • particularly we see a lot of potential in the approach of measuring user flows from check-ins in various applications • we also faced some challenges when scaling this approach to other chains and cities