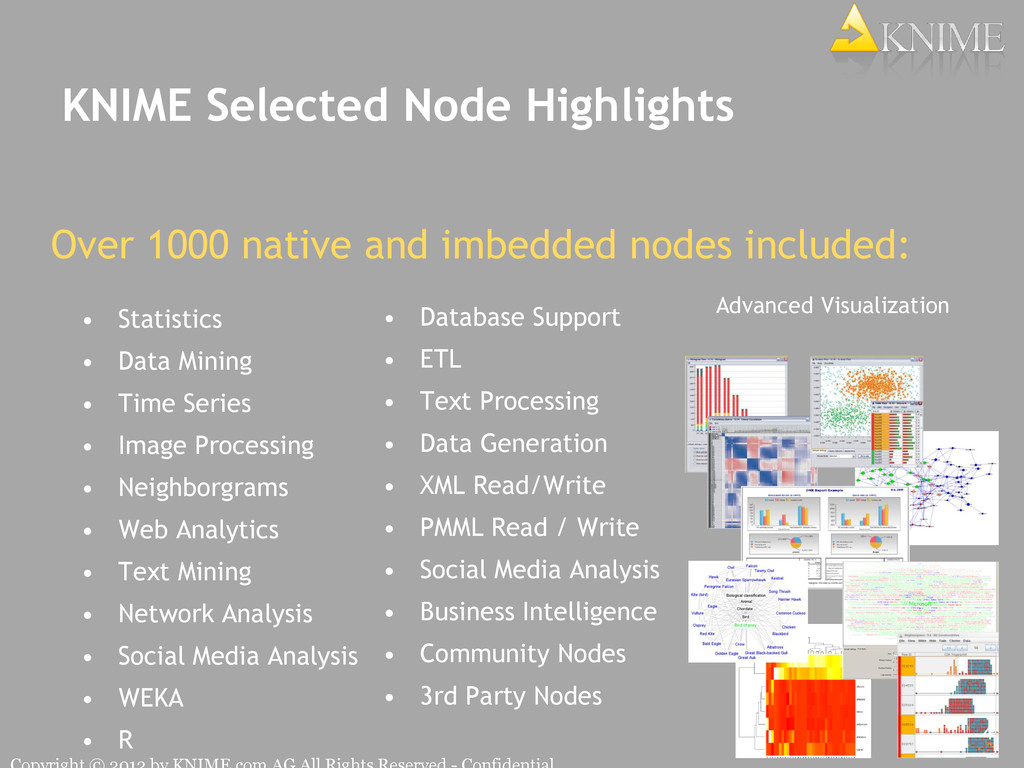
Time Series • Image Processing • Neighborgrams • Web Analytics • Text Mining • Network Analysis • Social Media Analysis • WEKA • R Over 1000 native and imbedded nodes included: • Database Support • ETL • Text Processing • Data Generation • XML Read/Write • PMML Read / Write • Social Media Analysis • Business Intelligence • Community Nodes • 3rd Party Nodes Advanced Visualization 4
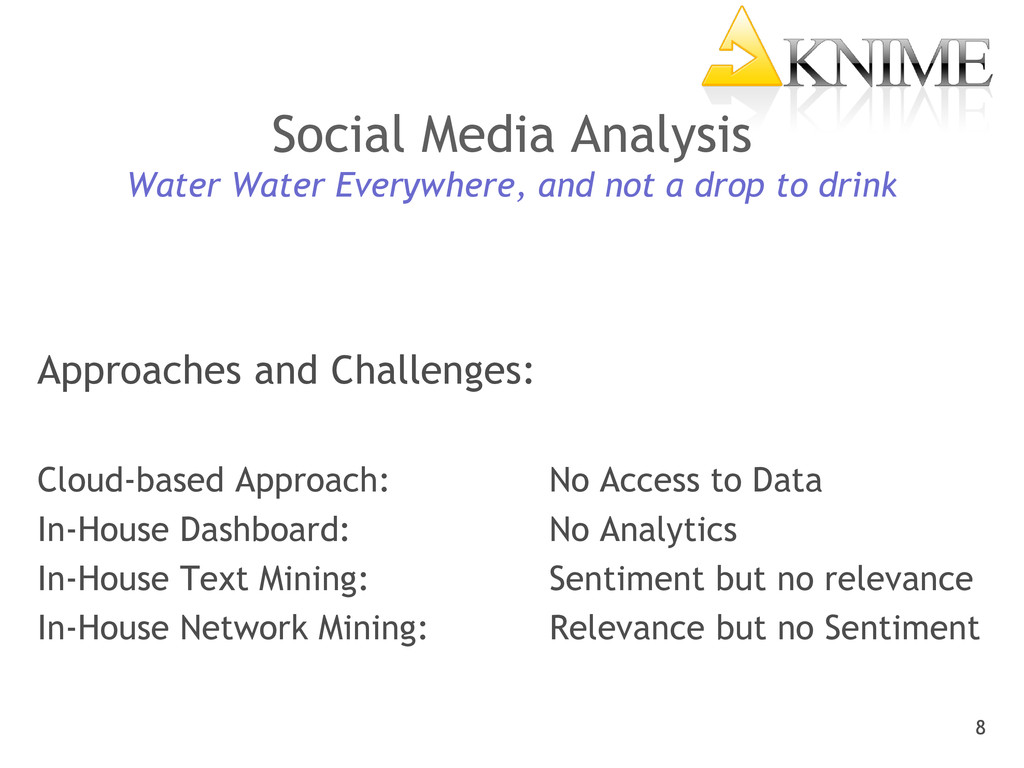
to drink Approaches and Challenges: Cloud-based Approach: No Access to Data In-House Dashboard: No Analytics In-House Text Mining: Sentiment but no relevance In-House Network Mining: Relevance but no Sentiment 8
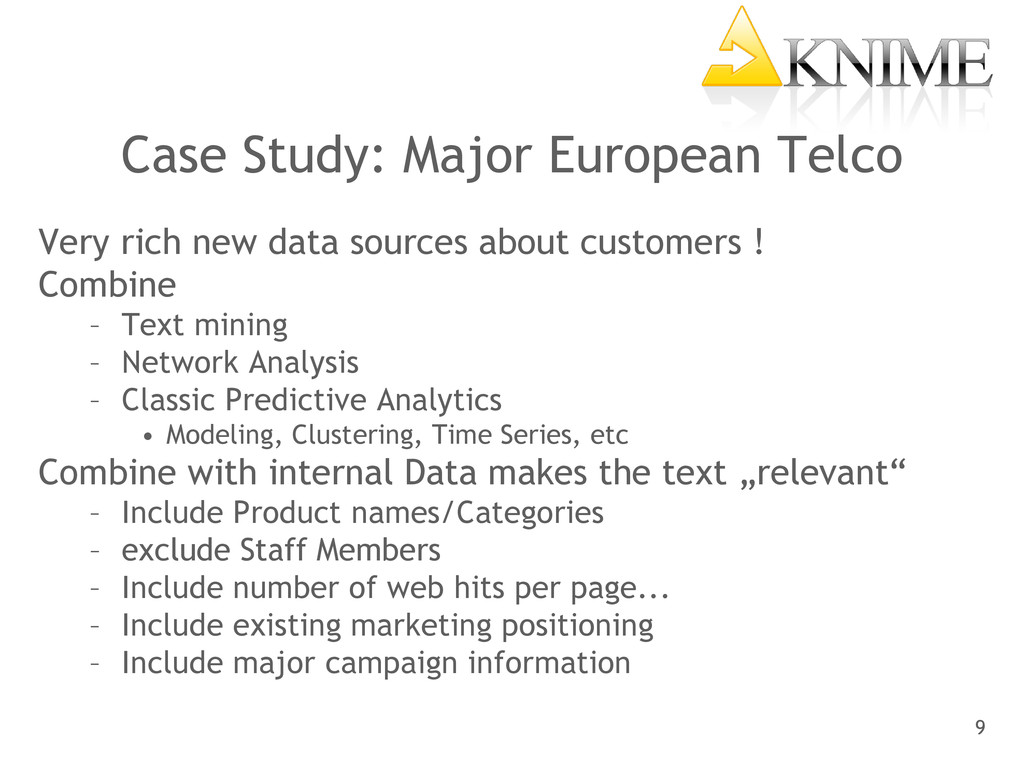
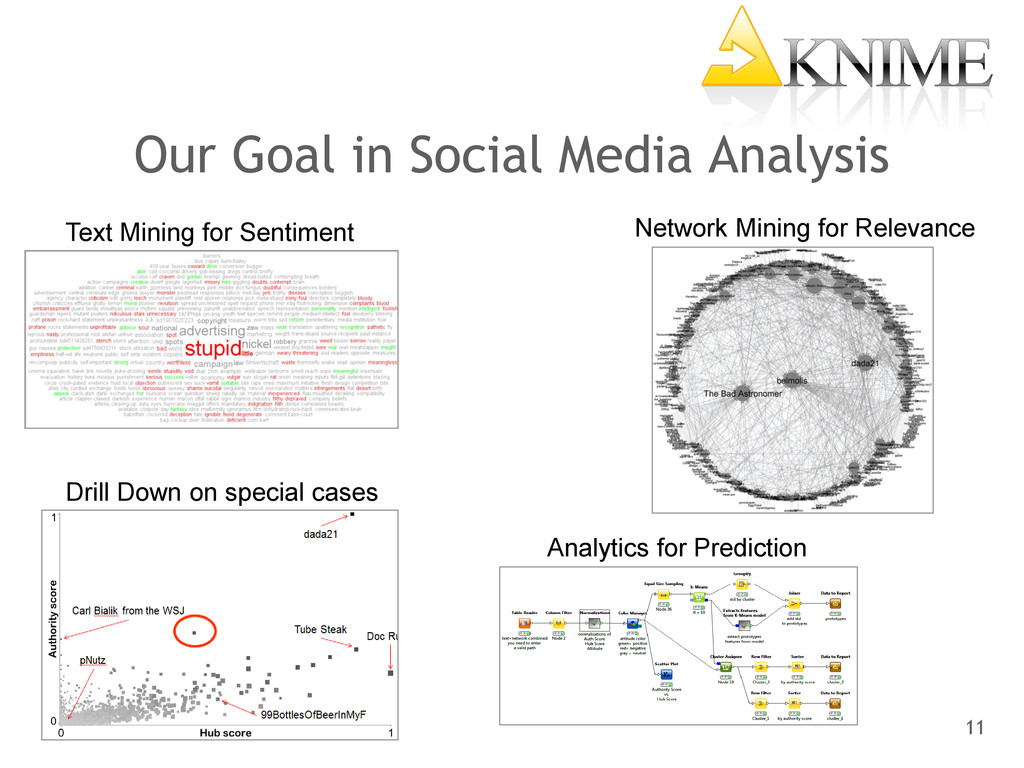
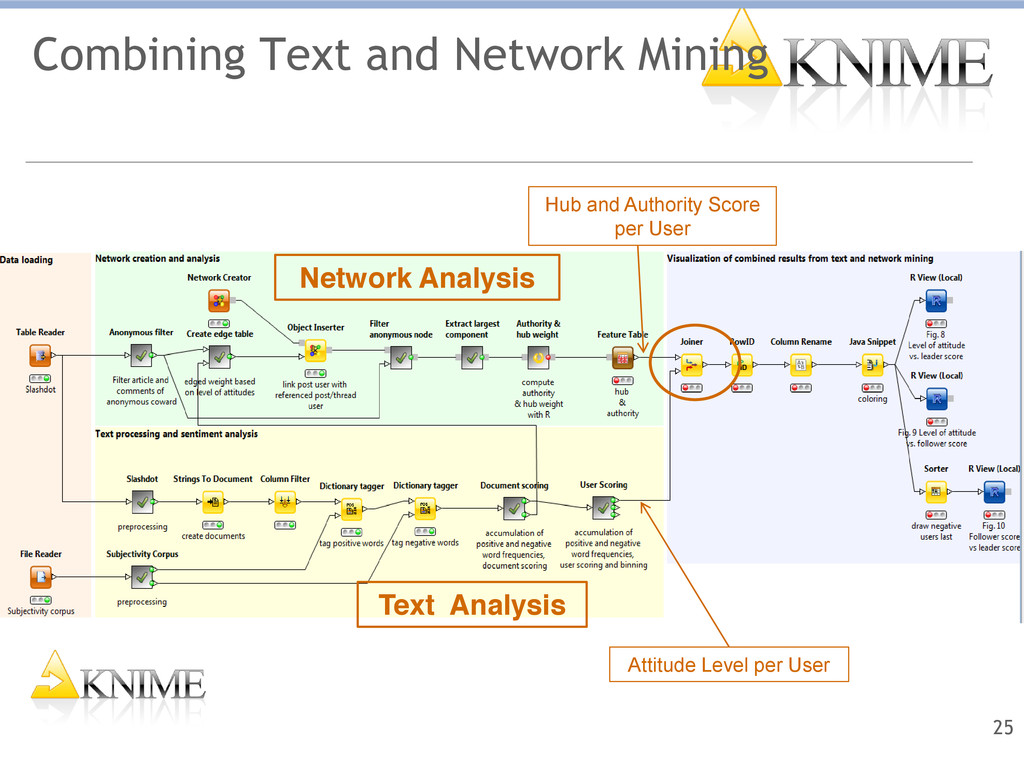
about customers ! Combine – Text mining – Network Analysis – Classic Predictive Analytics • Modeling, Clustering, Time Series, etc Combine with internal Data makes the text „relevant“ – Include Product names/Categories – exclude Staff Members – Include number of web hits per page... – Include existing marketing positioning – Include major campaign information 9
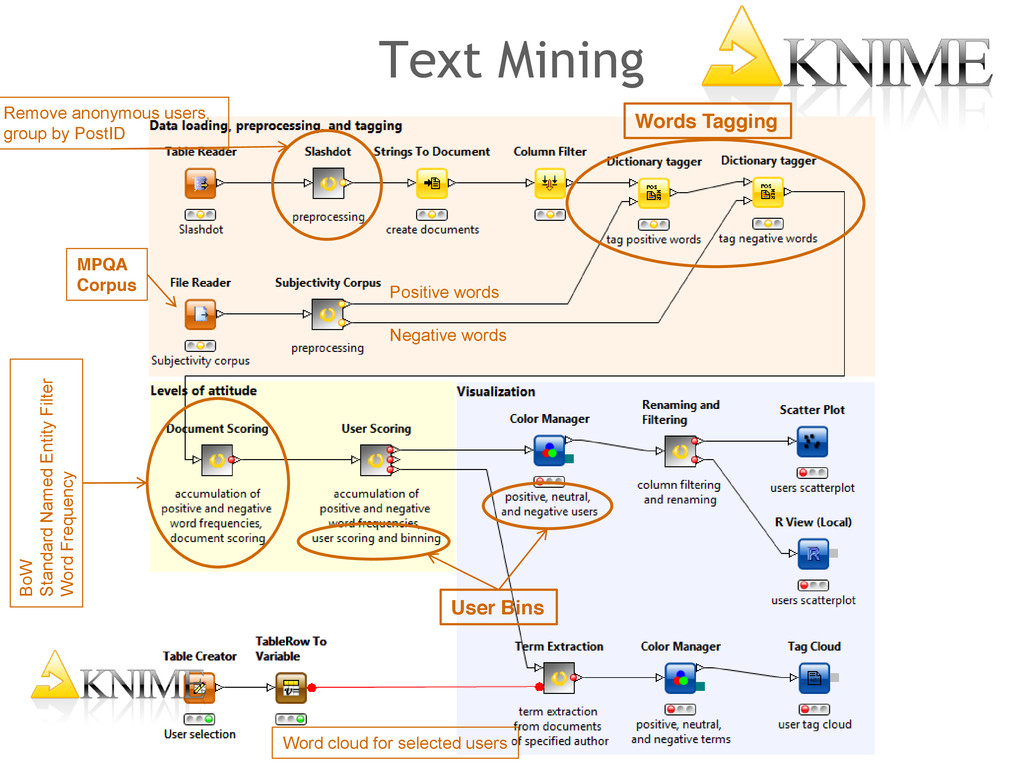
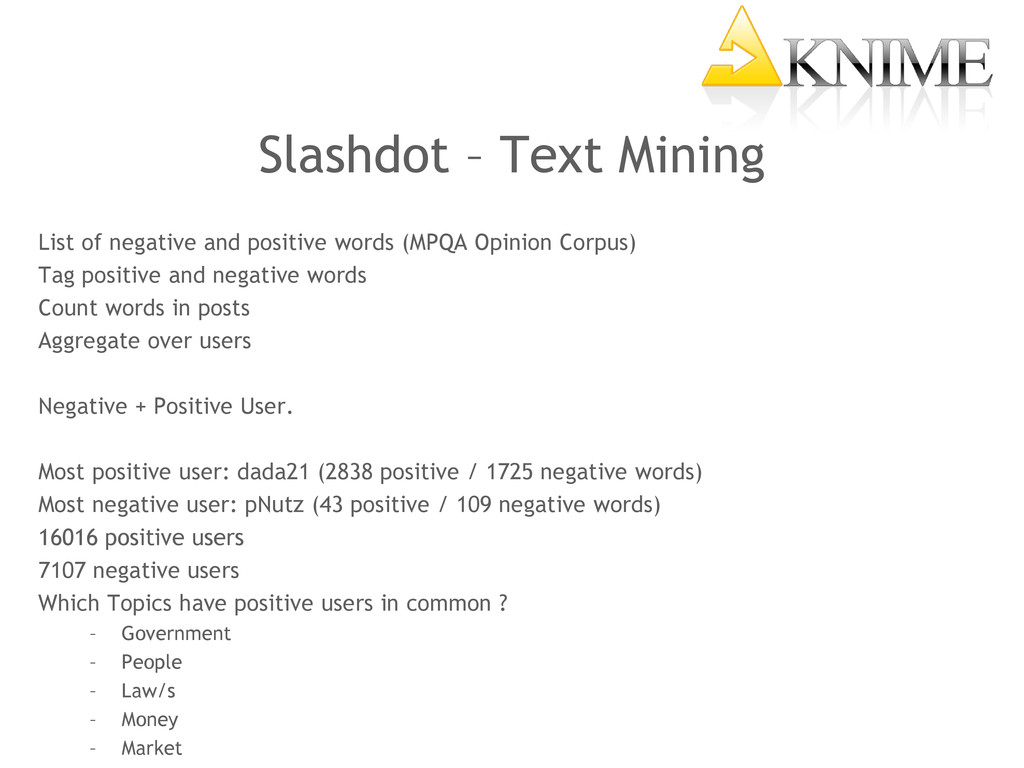
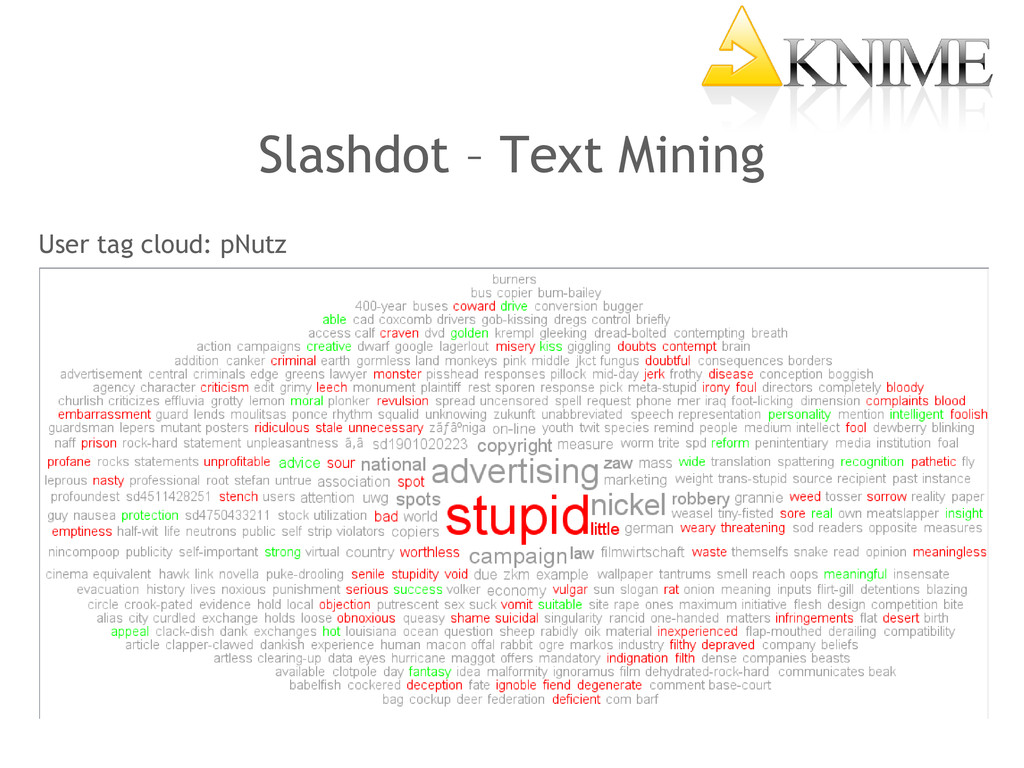
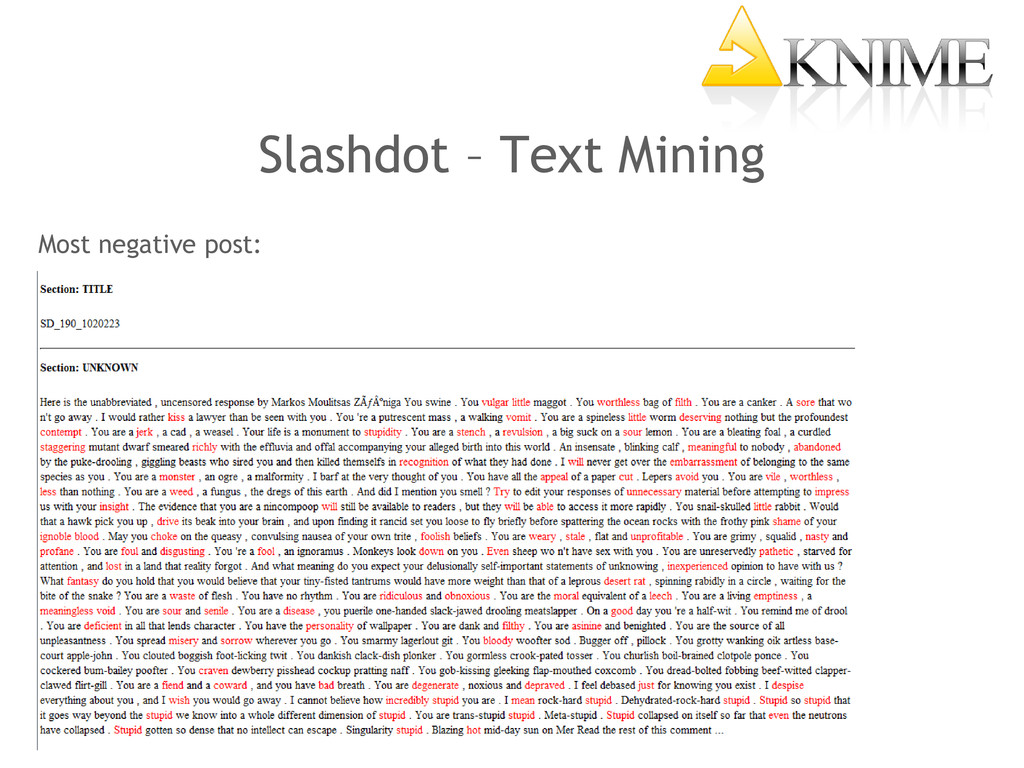
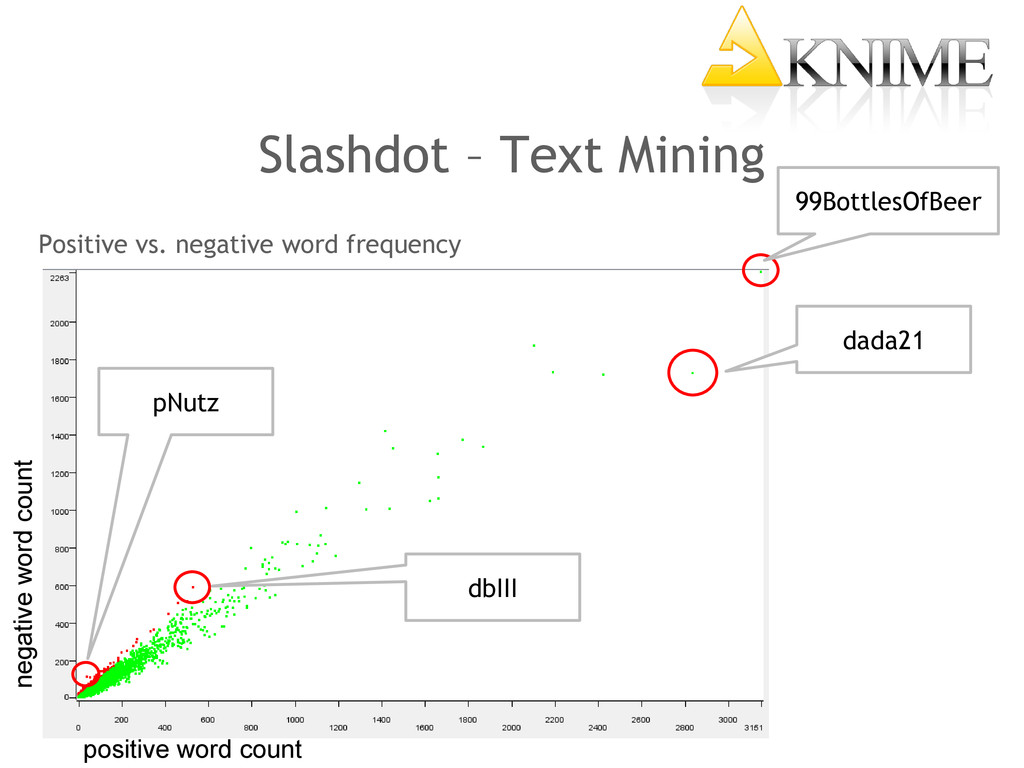
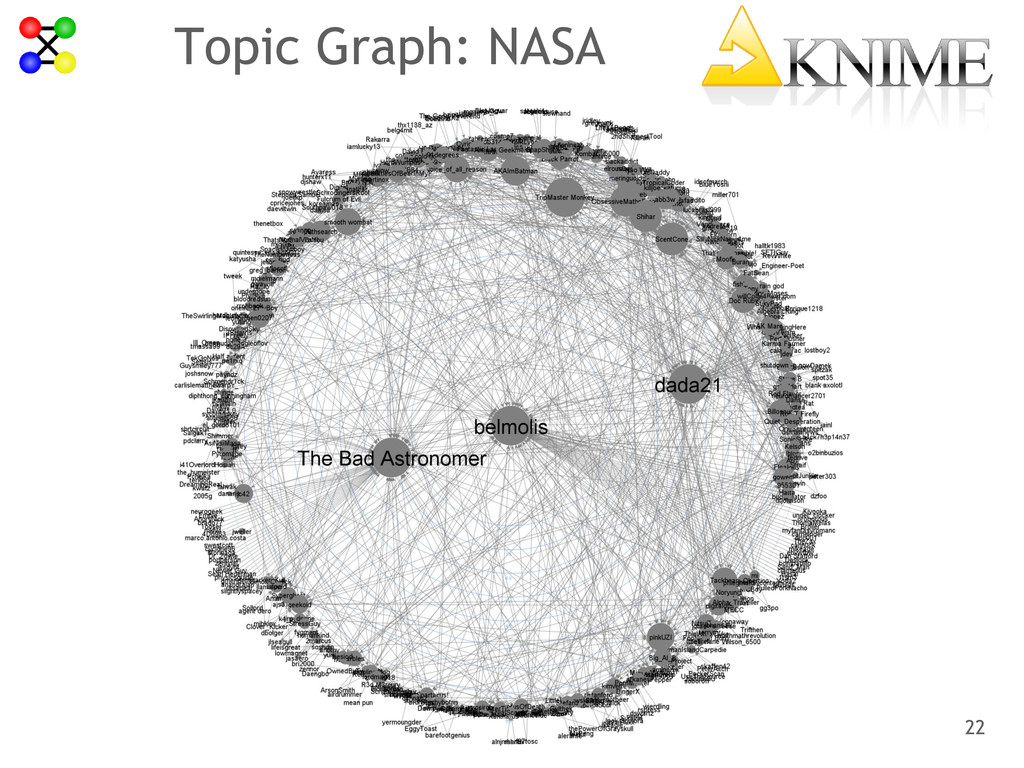
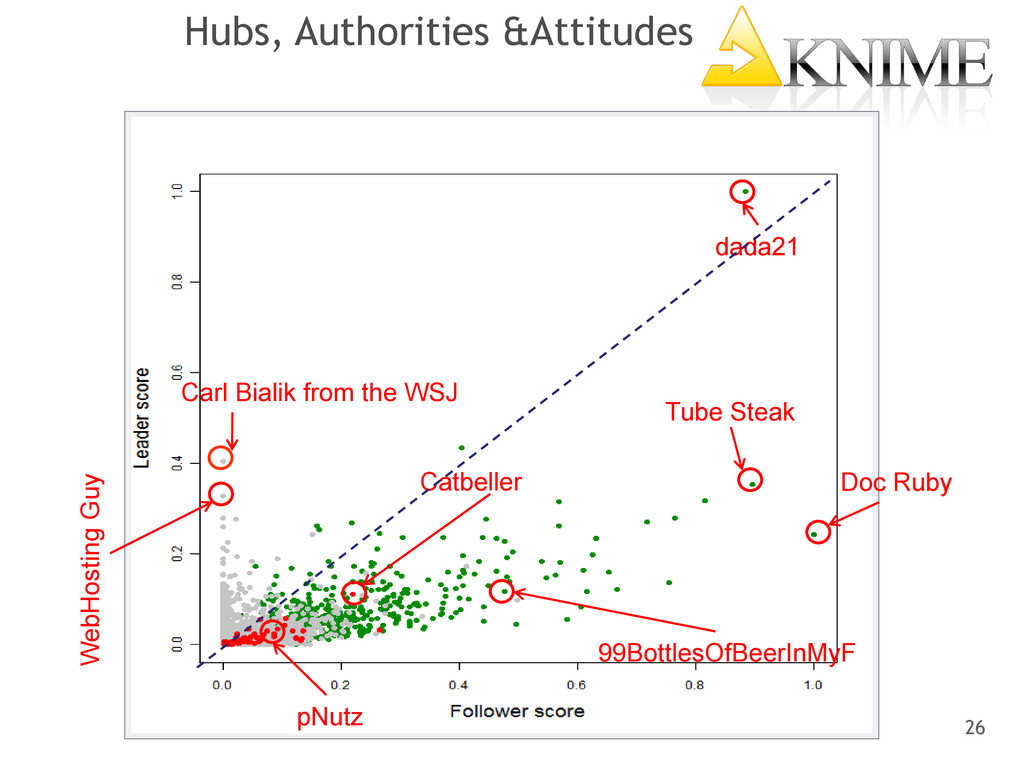
(MPQA Opinion Corpus) Tag positive and negative words Count words in posts Aggregate over users Negative + Positive User. Most positive user: dada21 (2838 positive / 1725 negative words) Most negative user: pNutz (43 positive / 109 negative words) 16016 positive users 7107 negative users Which Topics have positive users in common ? – Government – People – Law/s – Money – Market
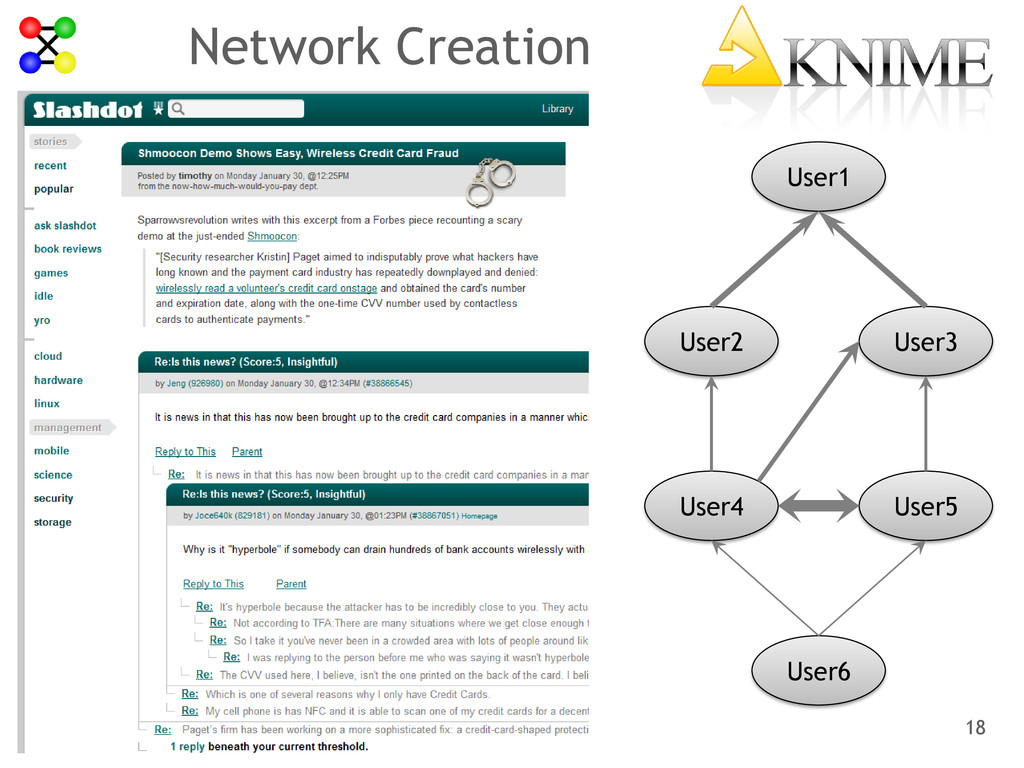
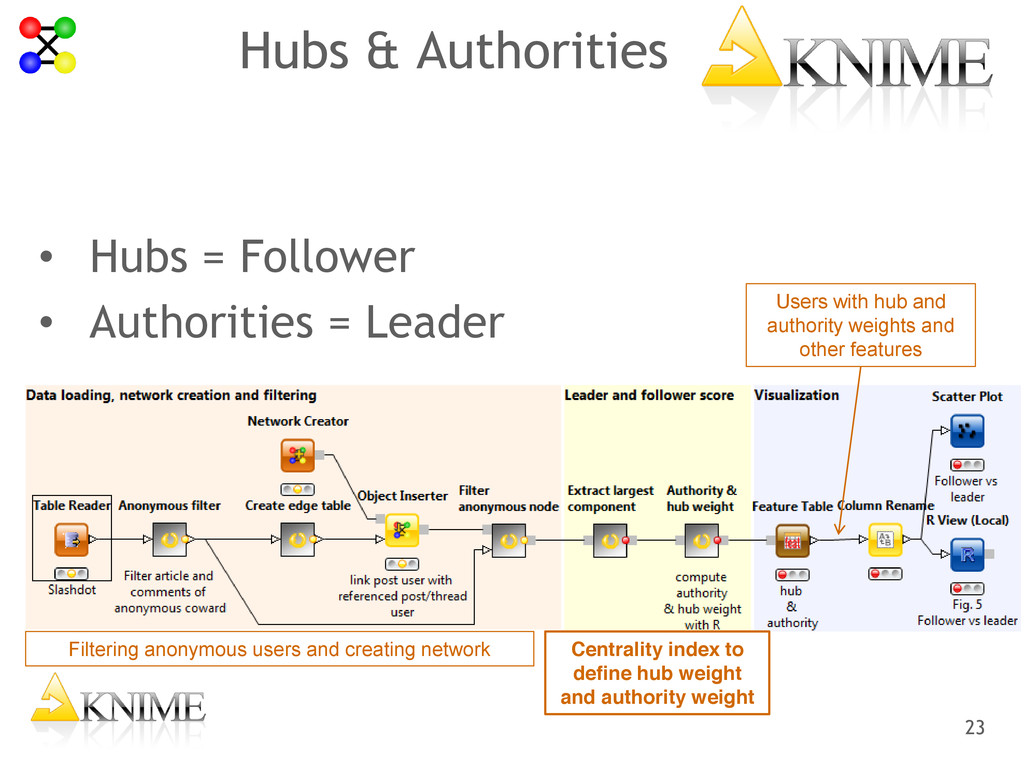
= Leader Filtering anonymous users and creating network Centrality index to define hub weight and authority weight Users with hub and authority weights and other features
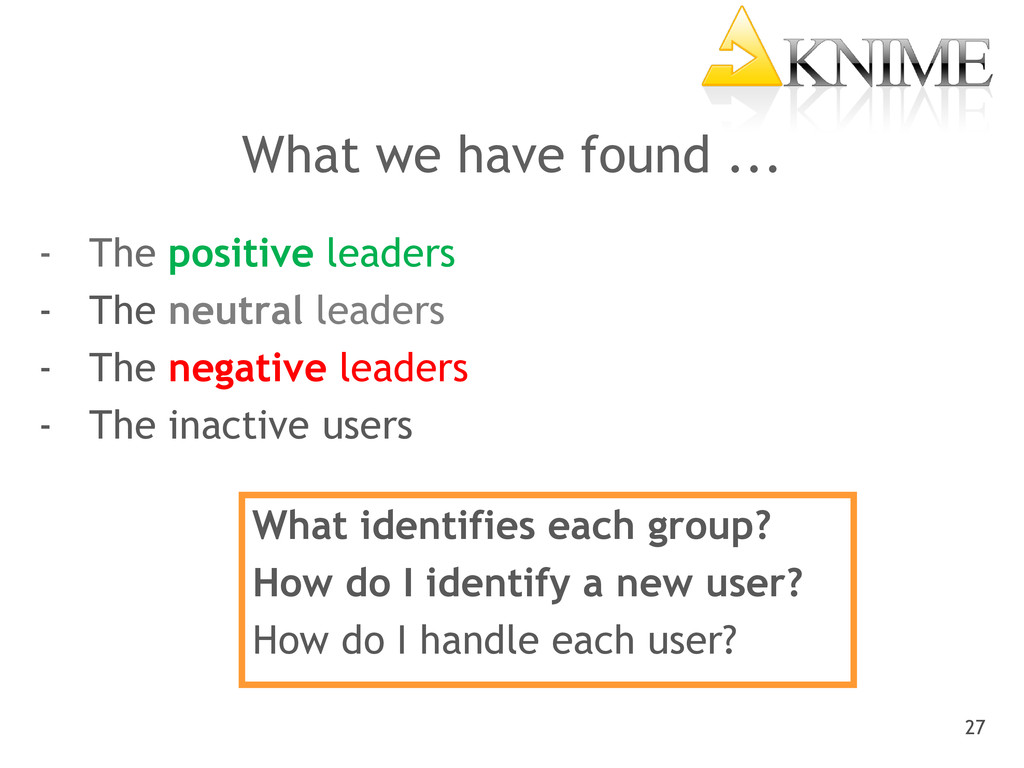
The neutral leaders - The negative leaders - The inactive users 27 What identifies each group? How do I identify a new user? How do I handle each user?
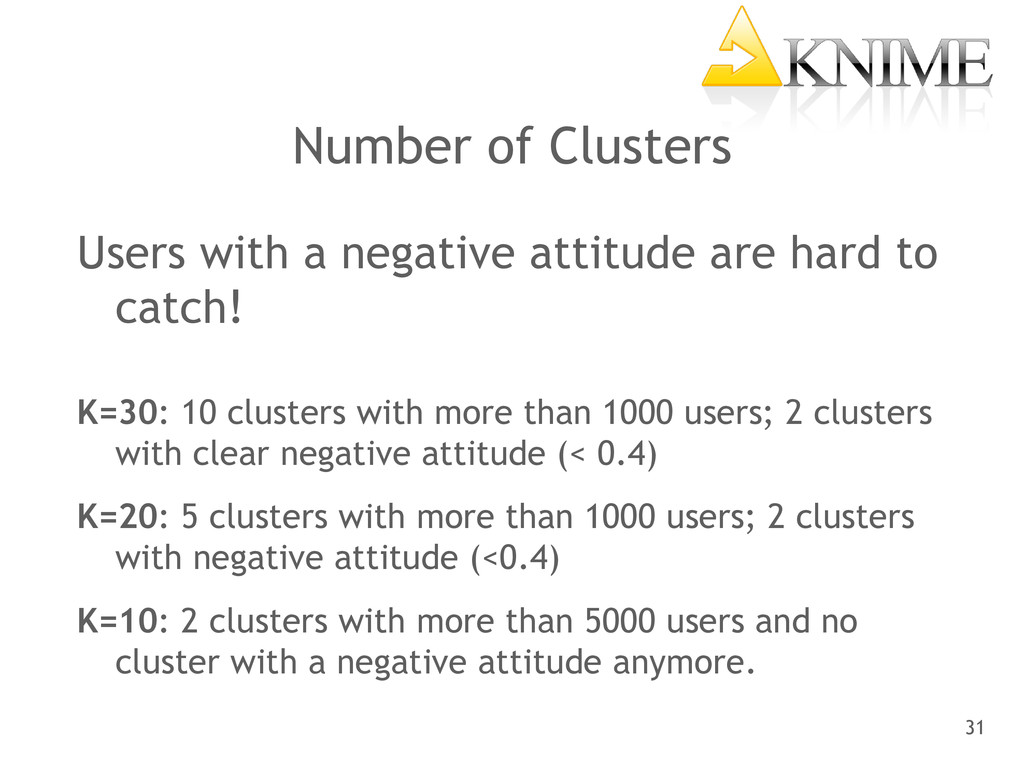
to catch! K=30: 10 clusters with more than 1000 users; 2 clusters with clear negative attitude (< 0.4) K=20: 5 clusters with more than 1000 users; 2 clusters with negative attitude (<0.4) K=10: 2 clusters with more than 5000 users and no cluster with a negative attitude anymore. 31
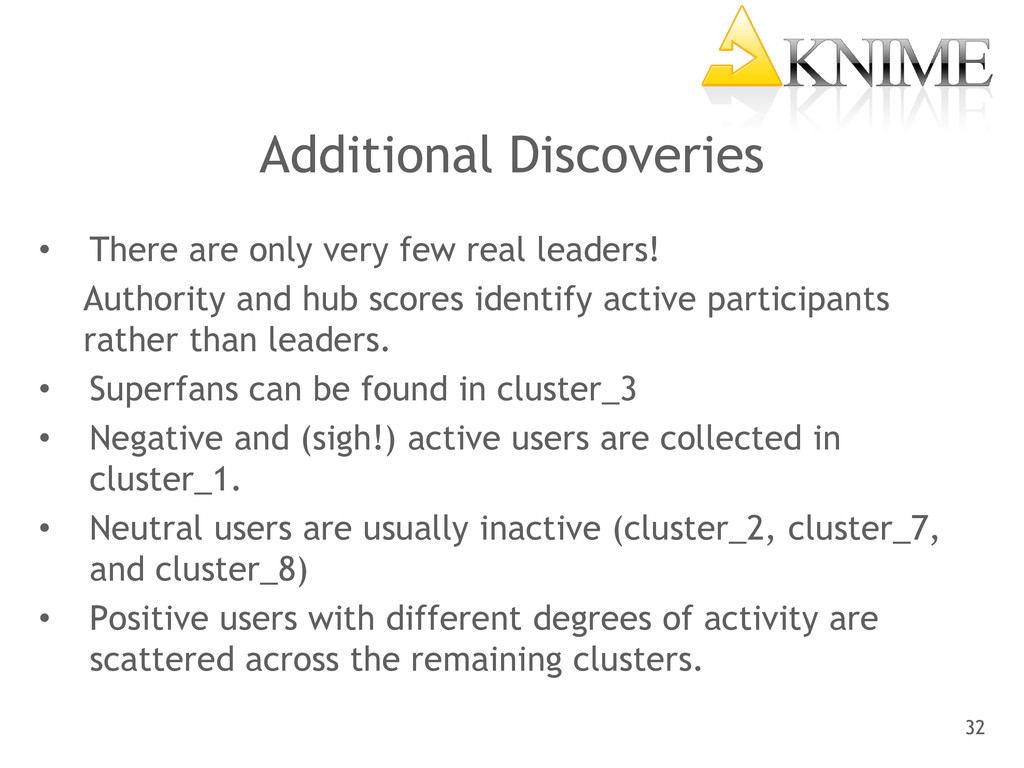
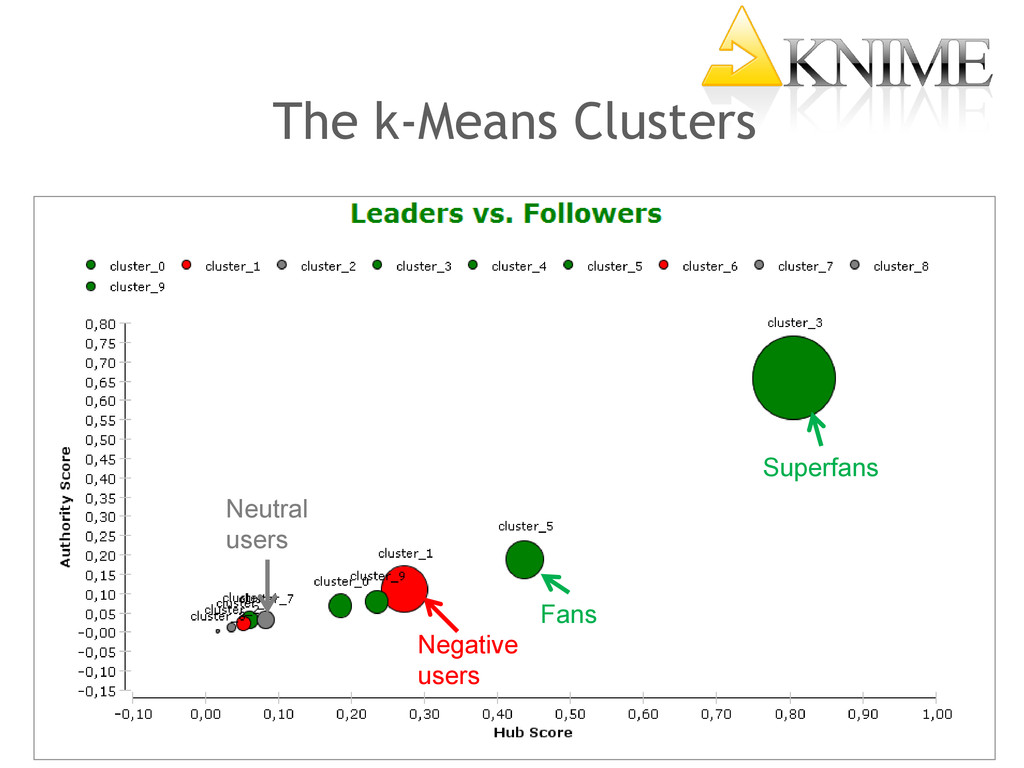
Authority and hub scores identify active participants rather than leaders. • Superfans can be found in cluster_3 • Negative and (sigh!) active users are collected in cluster_1. • Neutral users are usually inactive (cluster_2, cluster_7, and cluster_8) • Positive users with different degrees of activity are scattered across the remaining clusters. 32
![Normalization 29 • (Authority score, Hub score) in [0,1] x](https://files.speakerdeck.com/presentations/5a151ab05bee013047bd1231381b2567/slide_28.jpg)