Upgrade to Pro — share decks privately, control downloads, hide ads and more …

How I debug closed source software

How I debug closed source software

Slides from my talk “How I debug closed source software” at CocoaKucha 2 – London in January 2013.

Damien DeVille

January 16, 2014
Tweet

Other Decks in Technology

Transcript

  1. Who am I? • I am Damien DeVille. • I

    work at Realmac Software in Brighton. • I make Ember for Mac and iOS. • I spend way too much time in the debugger.
  2. Not all bugs are yours! • As software developers, we

    write a lot of bugs • But, we also rely on a lot of third party closed sourced code • Apple frameworks have bugs too! • Sometimes even though the bug is in your code, it only manifest itself inside a framework…
  3. So, how can we find these bugs? This is what

    we are going to talk about now!
  4. opensource.apple.com • Many Apple frameworks are open source! • dispatch,

    objc, darwin, CoreFoundation, CFNetwork, Security, etc… • A ton of closed source Apple frameworks are built on top of open source ones
  5. Class Dump Lets you examine the objc runtime information stored

    in Mach-O files: i.e. dump objc headers https://github.com/nygard/class-dump
  6. Class Dump It can also help us finding out that

    UIKit engineers have a good sense of humor…
  7. LLDB • LLDB is extremely powerful • We spend most

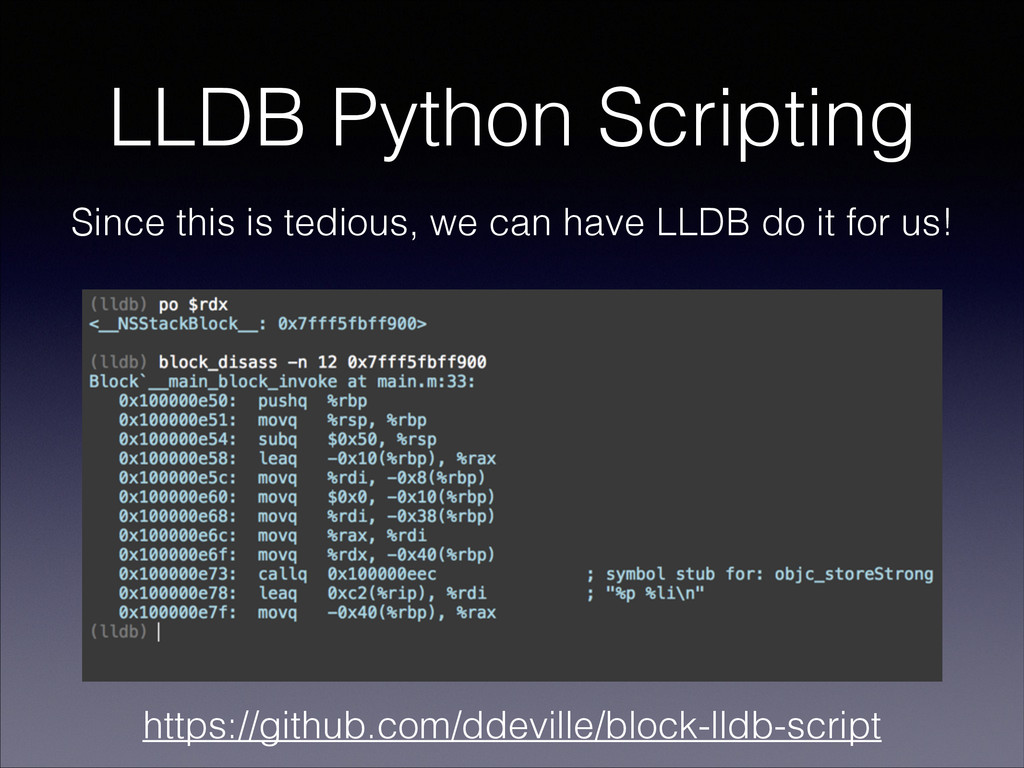
    of our time in the debugger so it’s important to master it • I’m going to share one special case where it can be tricky to find your way in the debugger…
  8. Inspecting blocks • A block is just a function pointer

    • With some captured variables • Luckily the signature is easily available http://ddeville.me/2013/02/block-debugging/
  9. LLDB Python Scripting Since this is tedious, we can have

    LLDB do it for us! https://github.com/ddeville/block-lldb-script
  10. LLDB Python Scripting Since this is tedious, we can have

    LLDB do it for us! https://github.com/ddeville/block-lldb-script
  11. LLDB Process Attach • Suppose that you have an application

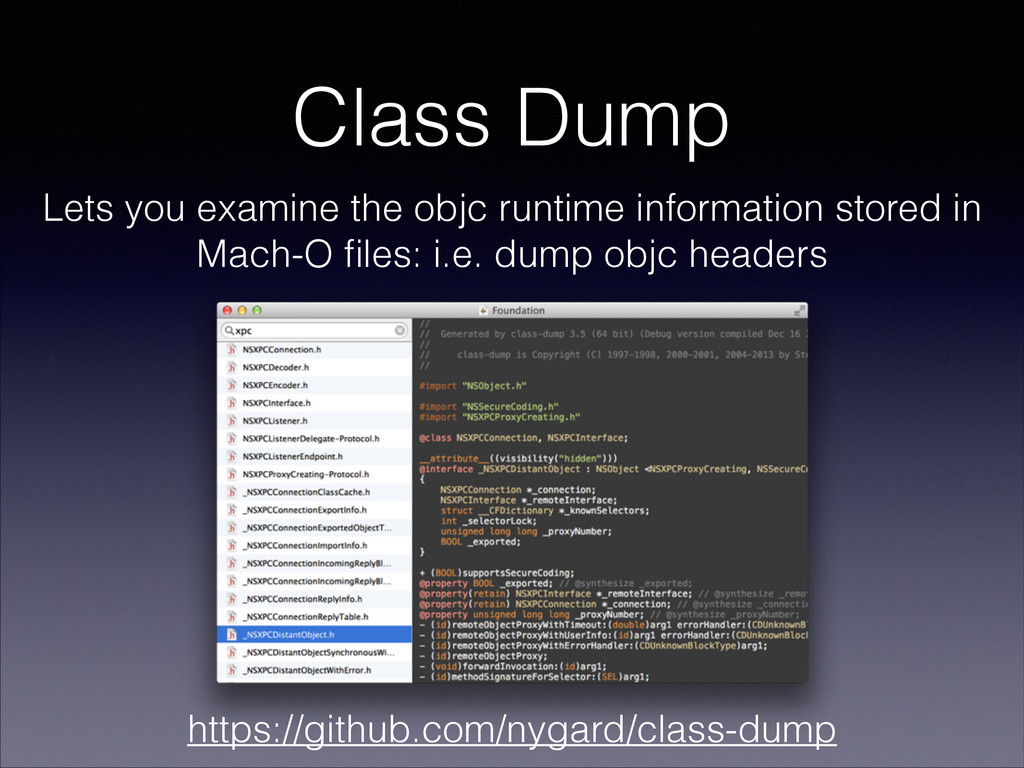
    on your machine • You would like to figure out how they implemented a given feature • You would like to debug it, i.e. inspect it in the debugger • Now, how can we do this?