Upgrade to Pro — share decks privately, control downloads, hide ads and more …

[2019.03 Meetup][TALK #1] Diogo Guerra - Monitoring Real-Time Cloud Infrastructure with an Open Source Stack

[2019.03 Meetup][TALK #1] Diogo Guerra - Monitoring Real-Time Cloud Infrastructure with an Open Source Stack

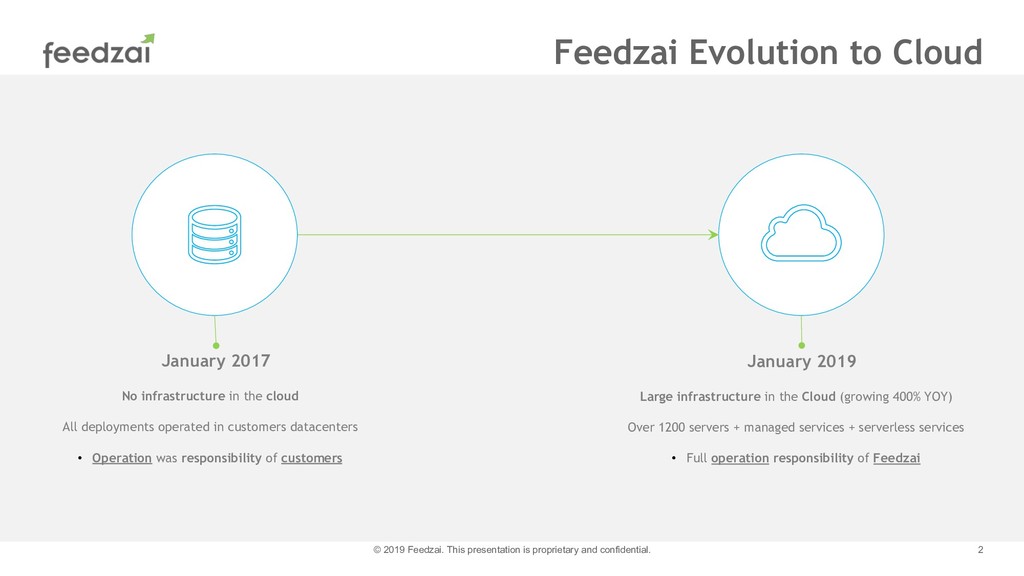
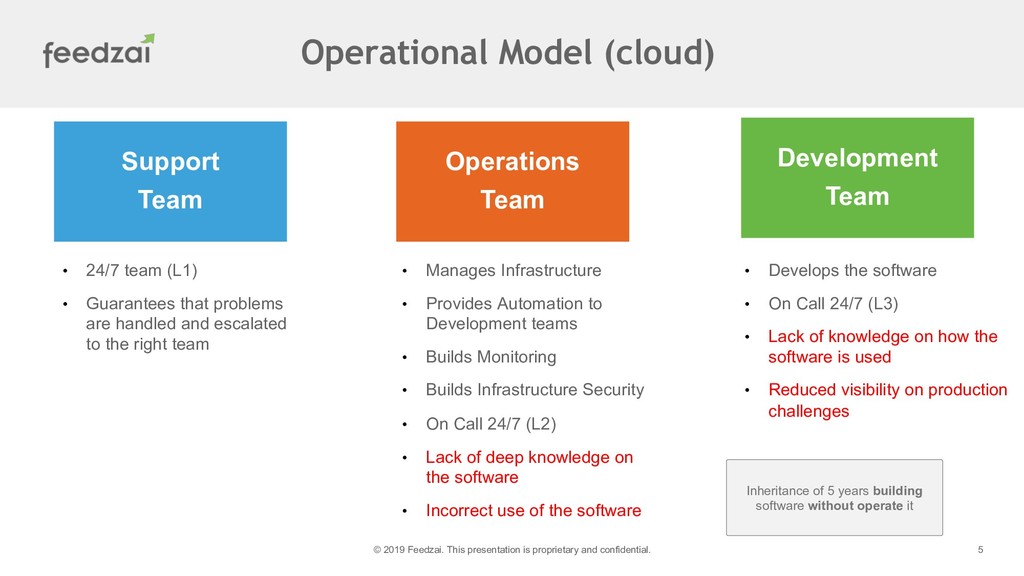
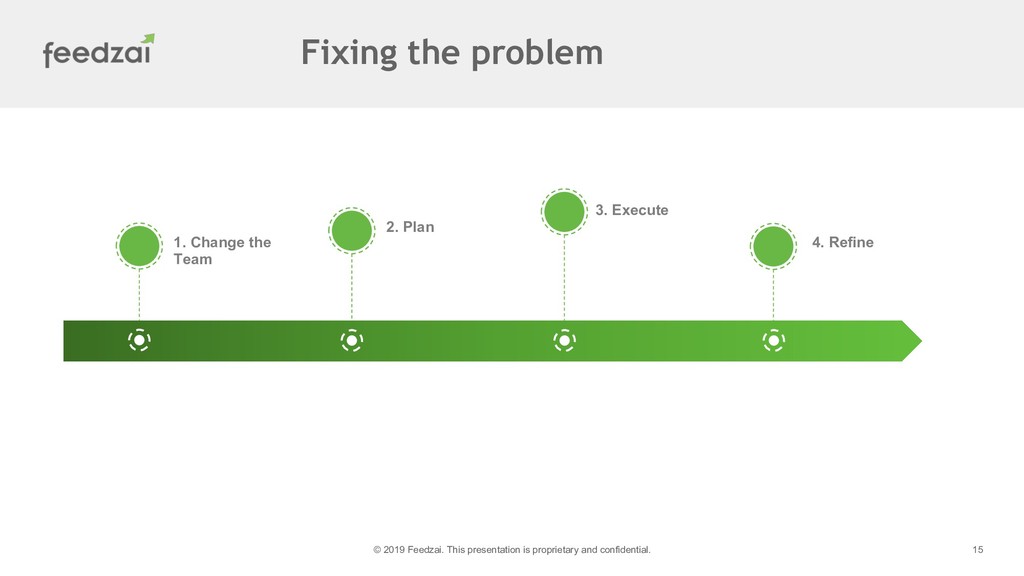
At Feedzai we have been making a transition to a devops mindset. During 2018 our cloud footprint grew 400% being a significant part of Feedzai's business. In this talk I will cover the effort put on monitoring and alerting of our systems and how our cloud operation changed the way we address monitoring from planning to the alerts that reach engineers phones.

I'll go into details of the transformation process and the differences between our legacy monitoring platform and the current state as well the impact on the quality of our service.

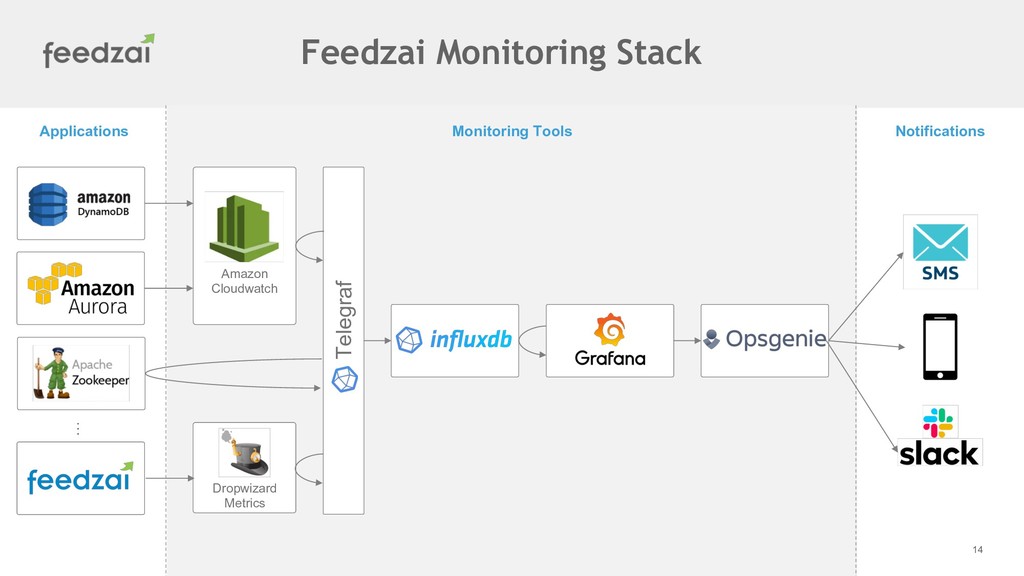
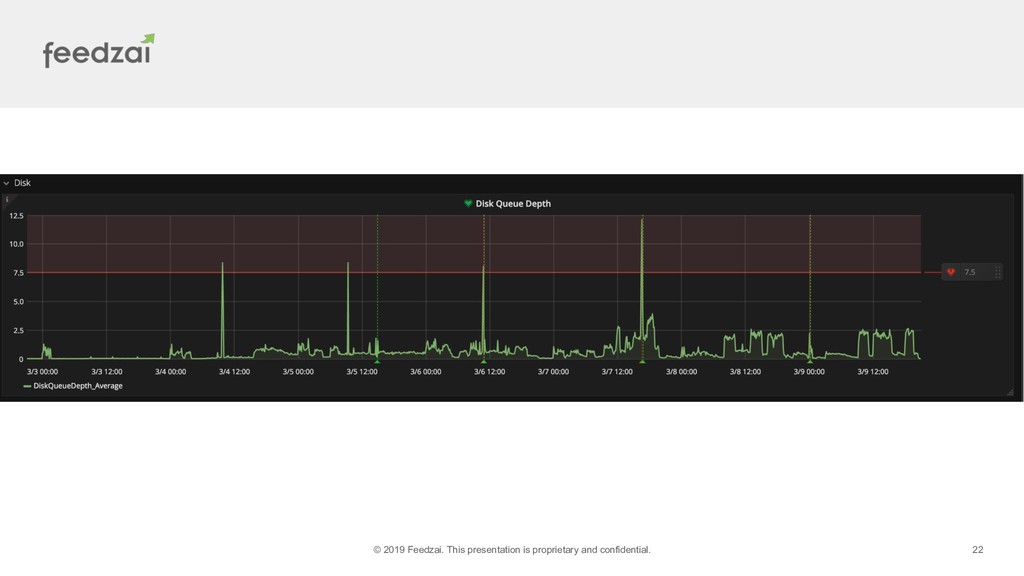
Feedzai monitoring stack is built on top of TIG (Telegraf, InfluxDB and Grafana) and covers mostly open source technologies such as Cassandra, Postgres, RabbitMQ, Hadoop (Spark and Yarn) as well as AWS native services.

Diogo Guerra is VP of Engineering at Feedzai leading the development of Feedzai's Real Time Fraud Detection system. He specializes in distributed systems, high performance, and low latency real-time platforms.

Leading teams to design and build systems that can process high volumes of data and leverage the power of Machine Learning, Diogo works on a daily basis with top financial institutions across the world to fight fraud.

DevOps Lisbon

March 11, 2019
Tweet

More Decks by DevOps Lisbon

Other Decks in Programming

Transcript

  1. © 2019 Feedzai. This presentation is proprietary and confidential. Feedzai

    Evolution to Cloud 2 No infrastructure in the cloud All deployments operated in customers datacenters • Operation was responsibility of customers January 2017 Large infrastructure in the Cloud (growing 400% YOY) Over 1200 servers + managed services + serverless services • Full operation responsibility of Feedzai January 2019
  2. © 2019 Feedzai. This presentation is proprietary and confidential. ©

    2019 Feedzai. This presentation is proprietary and confidential. 3 Operational Model (on premise) Support Team • 24/7 team (L1) • Guarantees that problems are handled and escalated to the right team Development Team • Develops the software • On Call 24/7 (L2)
  3. © 2019 Feedzai. This presentation is proprietary and confidential. ©

    2019 Feedzai. This presentation is proprietary and confidential. 4 Operational Model (cloud) Support Team • 24/7 team (L1) • Guarantees that problems are handled and escalated to the right team Operations Team Development Team • Manages Infrastructure • Provides Automation to Development teams • Builds Monitoring • Builds Infrastructure Security • On Call 24/7 (L2) • Develops the software • On Call 24/7 (L3)
  4. © 2019 Feedzai. This presentation is proprietary and confidential. ©

    2019 Feedzai. This presentation is proprietary and confidential. 5 Operational Model (cloud) Support Team • 24/7 team (L1) • Guarantees that problems are handled and escalated to the right team Operations Team Development Team • Manages Infrastructure • Provides Automation to Development teams • Builds Monitoring • Builds Infrastructure Security • On Call 24/7 (L2) • Lack of deep knowledge on the software • Incorrect use of the software • Develops the software • On Call 24/7 (L3) • Lack of knowledge on how the software is used • Reduced visibility on production challenges Inheritance of 5 years building software without operate it
  5. © 2019 Feedzai. This presentation is proprietary and confidential. ©

    2019 Feedzai. This presentation is proprietary and confidential. 6 What have we learned? Mechanic Racing Driver < not a >
  6. © 2019 Feedzai. This presentation is proprietary and confidential. ©

    2019 Feedzai. This presentation is proprietary and confidential. 7 What have we learned? Just because you have developed the software, doesn’t mean that you know how to operate it
  7. © 2019 Feedzai. This presentation is proprietary and confidential. ©

    2019 Feedzai. This presentation is proprietary and confidential. 9 Why is monitoring so challenging? System Complexity • Low latency systems are very sensitive • Highly stateful services are prone to accumulate problems • Multi Tenancy increases risk of failure propagation System Customization Customer Expectations • Extensibility allows partners and customers to deploy code in the system by themselves • Aggressive SLAs, reduce the available time to react and fix • Customers expect flexibility, speed, performance and stability
  8. © 2019 Feedzai. This presentation is proprietary and confidential. ©

    2019 Feedzai. This presentation is proprietary and confidential. 10 The root of the challenge Too many alerts Team ignoring alerts Problems not prevented
  9. © 2019 Feedzai. This presentation is proprietary and confidential. ©

    2019 Feedzai. This presentation is proprietary and confidential. 11 The root of the challenge Example of outliers hard to ignore: CPU Spikes
  10. © 2019 Feedzai. This presentation is proprietary and confidential. ©

    2019 Feedzai. This presentation is proprietary and confidential. 12 The root of the challenge Example of outliers hard to ignore: HTTP 4XX Errors
  11. © 2019 Feedzai. This presentation is proprietary and confidential. ©

    2019 Feedzai. This presentation is proprietary and confidential. 14 Feedzai Monitoring Stack Telegraf Amazon Cloudwatch Dropwizard Metrics … Monitoring Tools Notifications Applications
  12. © 2019 Feedzai. This presentation is proprietary and confidential. ©

    2019 Feedzai. This presentation is proprietary and confidential. 15 Fixing the problem 4. Refine 3. Execute 2. Plan 1. Change the Team
  13. © 2019 Feedzai. This presentation is proprietary and confidential. ©

    2019 Feedzai. This presentation is proprietary and confidential. 16 • Bring together engineers from all teams • Support • Operations • Development • Change the responsibilities moving forward • Monitoring is now responsibility of development teams • Operations are responsible for pushing it for all customers 1. Change the team
  14. © 2019 Feedzai. This presentation is proprietary and confidential. ©

    2019 Feedzai. This presentation is proprietary and confidential. 17 • Plan your development • Don’t fall on the same mistakes • Review incidents • Review postmortems • Listen to the people that operate and fix the problems in production • Structure the monitoring 2. Plan
  15. © 2019 Feedzai. This presentation is proprietary and confidential. ©

    2019 Feedzai. This presentation is proprietary and confidential. 18 2. Plan – Monitoring Structure Platform Metrics • Collected at operating system level • Low ability to predict problems • Are important to help debug problematic issues • E.g.: CPU, Disk, Memory, Network Application Metrics Business Metrics • Metrics that show the health of each application • Exported by each application • The more relevant and predictive • You need to implement your own application metrics • E.g.: pending messages in RabbitMQ, throttle events in DynamoDB • Metrics that are visible by the customers • Collected in the boundaries of the system (e.g.: the proxies or http servers) • Also collected in databases or reports (e.g.: • The most relevant, but won’t be predictive of problems, will only confirm • E.g.: SLAs, API Errors, Business Performance (how much fraud caught)
  16. © 2019 Feedzai. This presentation is proprietary and confidential. ©

    2019 Feedzai. This presentation is proprietary and confidential. 19 • Setup a structure that can be used in tandem with existing alerts • By adding a flag to the alerts • Define a maximum number of alerts wrongly triggered per day • We defined 10 alerts per day • Review every day the alerts triggered • Check for the false positives and tune it • Check if there was any of the old (true positive) alerts that was not triggered 3. Tune Alerts
  17. © 2019 Feedzai. This presentation is proprietary and confidential. ©

    2019 Feedzai. This presentation is proprietary and confidential. 20 • Is not about the tools, is about the processes and how you use the tools • Monitoring requires knowledge of the software but also of it’s behavior in production • Planning helps to think in a structured way and cover the systems in a thorough way Conclusion
  18. © 2019 Feedzai. This presentation is proprietary and confidential. ©

    2019 Feedzai. This presentation is proprietary and confidential. 22
  19. © 2019 Feedzai. This presentation is proprietary and confidential. ©

    2019 Feedzai. This presentation is proprietary and confidential. 23 • Understand the major “business” processes that are important to be working • Plan metrics at service level, not at node level • Monitoring platform should aggregate the metric for all nodes • If possible, export absolute counters, not window based metrics • E.g. total number of transactions processed vs number of transactions processed in the last minute • Allows the monitoring platform to be more flexible • Abstract standard metric and health check reporting • Apply to all your applications in a standard way • E.g. monitoring any Java process has basic stuff to be exported Making your apps monitorable
  20. © 2019 Feedzai. This presentation is proprietary and confidential. ©

    2019 Feedzai. This presentation is proprietary and confidential. 24 • Long running aggregations are too heavy and can’t be recovered easily • Aggregation process should be lightweight • Predefine which metrics you need to monitor (percentiles, averages, etc) • Aggregate in small time buckets (e.g. 5 min) and push those metrics to your database • Build alerting over averages or maxes of those pre-aggregations • One solution: use Pipped Logging in Apache and aggregate with StatsD Monitoring High Throughput Applications
  21. © 2019 Feedzai. This presentation is proprietary and confidential. ©

    2019 Feedzai. This presentation is proprietary and confidential. 25 • Alert over every data stream / metric that is monitored • Monitoring should support alerting but also debugging and reporting • Alerting should focus on trigger a reaction, 10 alerts at the same time, confuse engineers • Too aggressive thresholds • In general, gut feeling defines too aggressive thresholds • If possible, monitor in QA for some days / weeks before adjust thresholds • Alert Fatigue • Flapping alerts • Multiple alerts for the same problem Common Pitfalls