Upgrade to Pro — share decks privately, control downloads, hide ads and more …

Real User Metrics with Fastly and Prometheus

Real User Metrics with Fastly and Prometheus

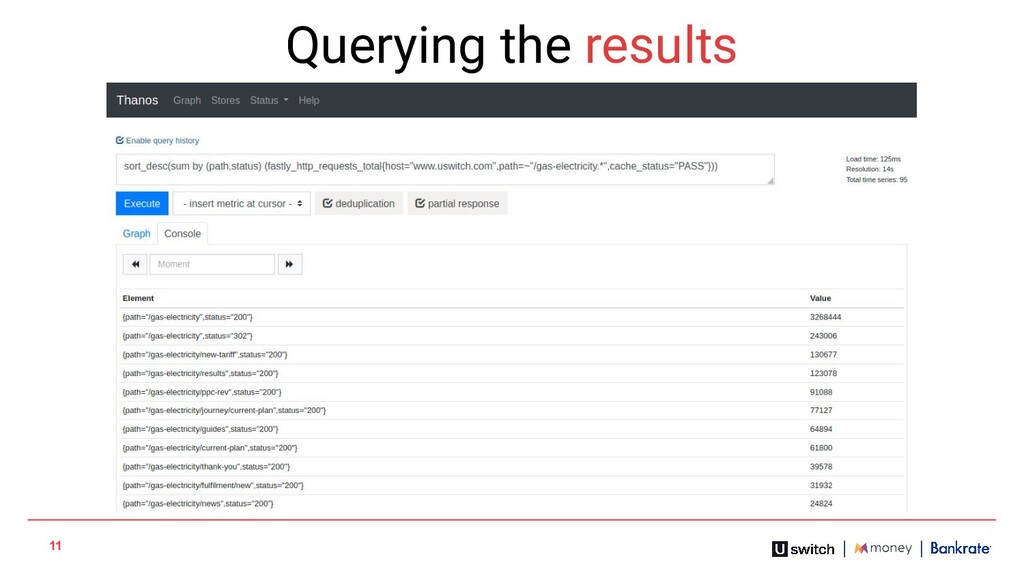
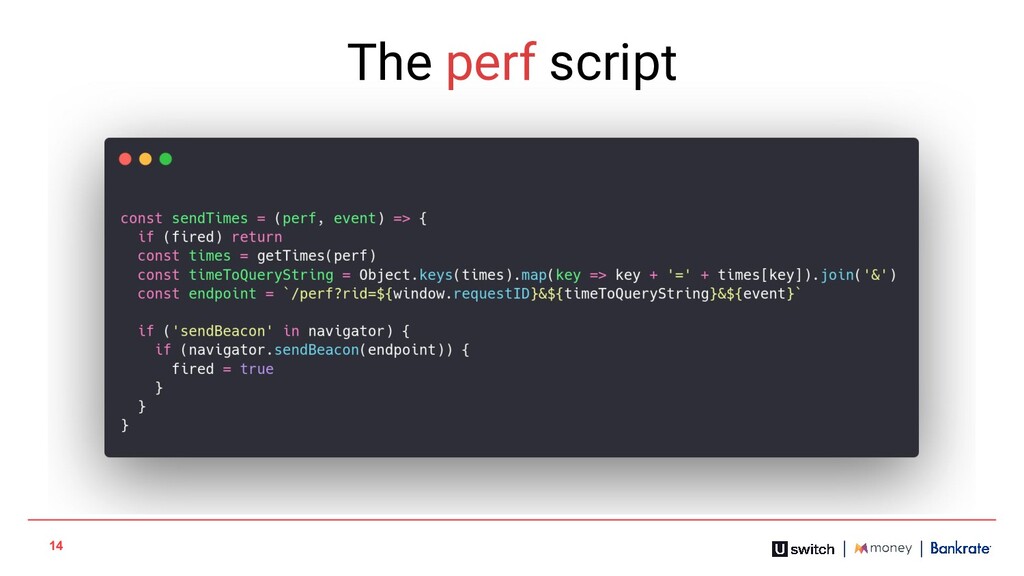
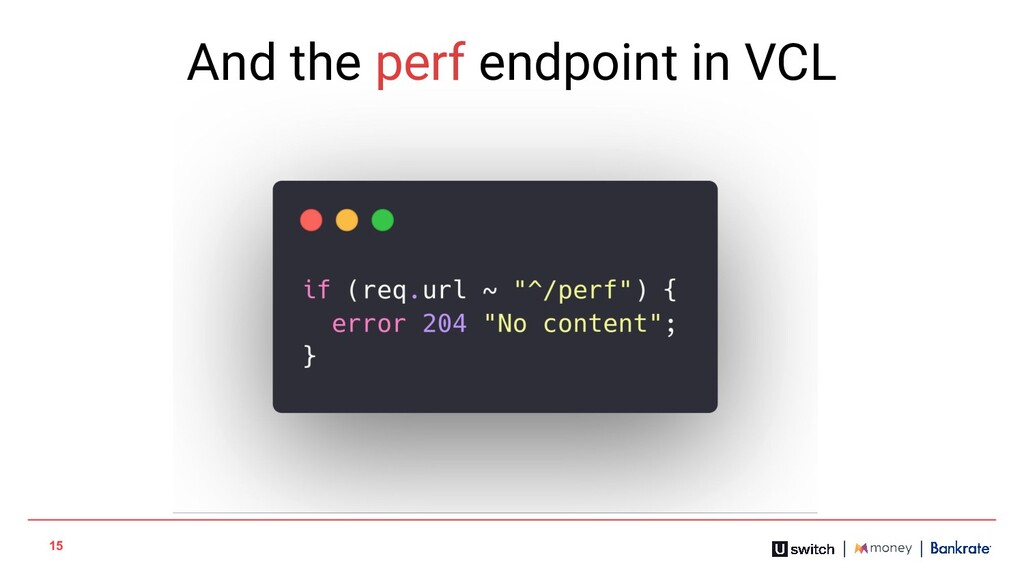
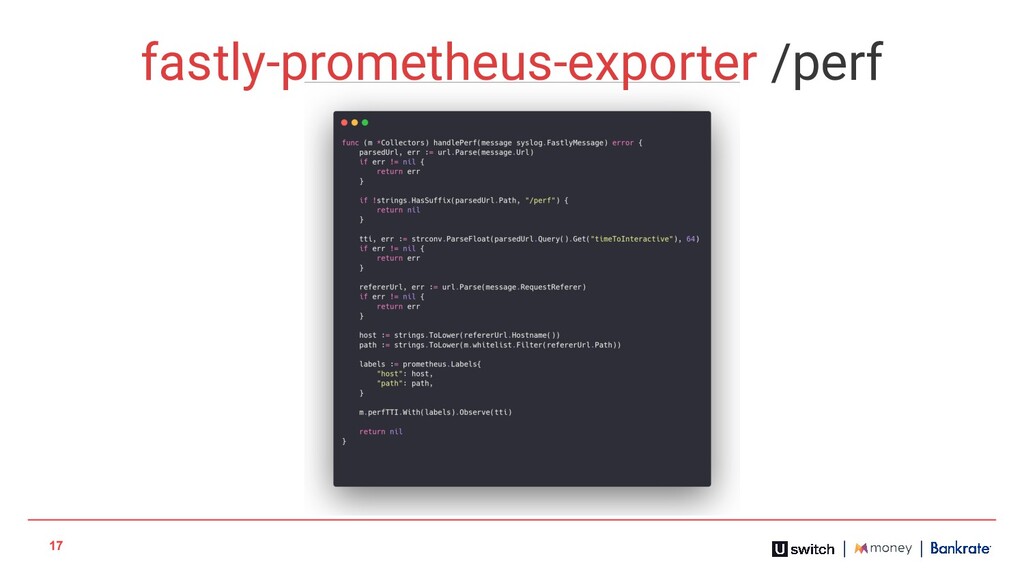
This deck covers turning Fastly logs into Prometheus metrics with a simple syslog server and then expanding on that by capturing data from client browsers and pulling that into Prometheus through the same mechanism.

A simple way to gain some insight into what your users are seeing on your site.

Dewald Viljoen

February 11, 2020
Tweet

More Decks by Dewald Viljoen

Other Decks in Programming

Transcript

  1. 2

  2. 3 • App metrics • Ingress metrics • Edge proxy

    metrics • All query-able from Prometheus • Request logs in BigQuery • Stats endpoint • Real-time analytics endpoint • Separate systems
  3. 6 • App metrics • Ingress metrics • Edge proxy

    metrics • All query-able from Prometheus • Request logs in BigQuery • Stats endpoint • Real-time analytics endpoint • Seperate systems
  4. 7 Fastly log streaming options • Amazon S3 • Heroku's

    Logplex • OpenStack • Cloud Files • Honeycomb • Papertrail • Datadog • Kafka • Scalyr • DigitalOcean Spaces • Log Shuttle • SFTP • Elasticsearch • LogDNA • Splunk • FTP • Logentries • Sumo Logic • Google BigQuery • Loggly • Syslog • Google Cloud Storage • Microsoft Azure Blob Storage