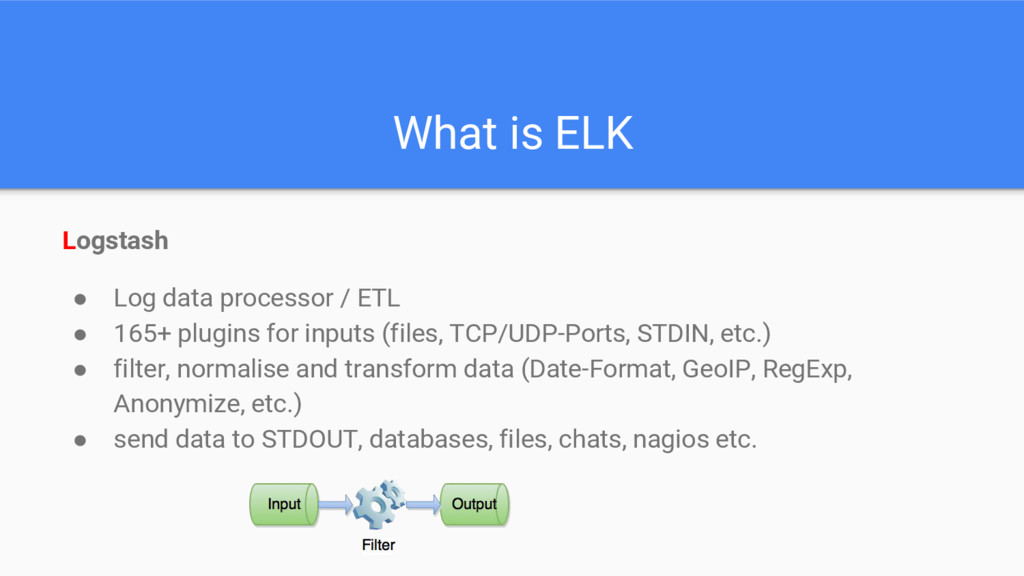
• 165+ plugins for inputs (files, TCP/UDP-Ports, STDIN, etc.) • filter, normalise and transform data (Date-Format, GeoIP, RegExp, Anonymize, etc.) • send data to STDOUT, databases, files, chats, nagios etc.
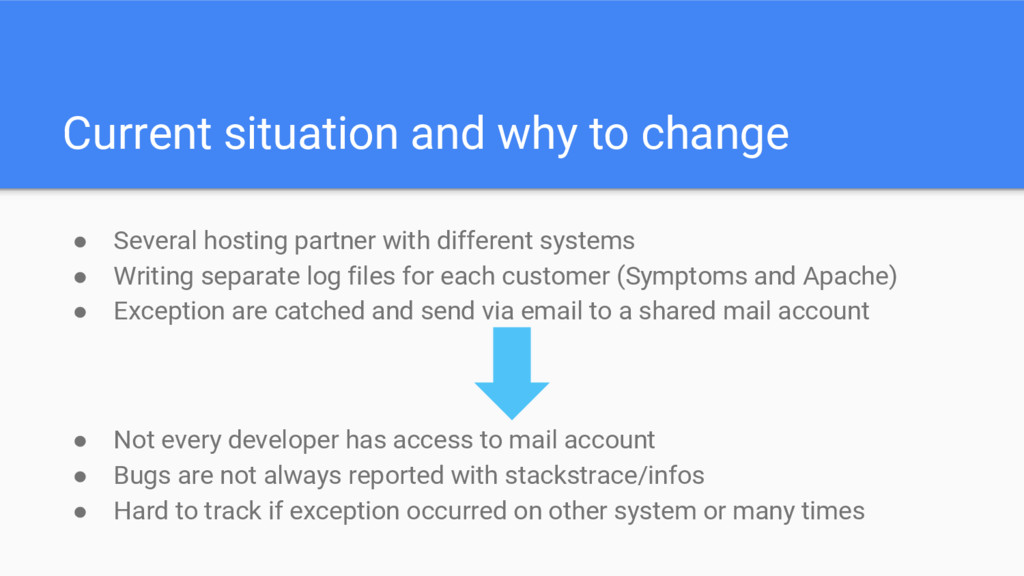
with different systems • Writing separate log files for each customer (Symptoms and Apache) • Exception are catched and send via email to a shared mail account • Not every developer has access to mail account • Bugs are not always reported with stackstrace/infos • Hard to track if exception occurred on other system or many times
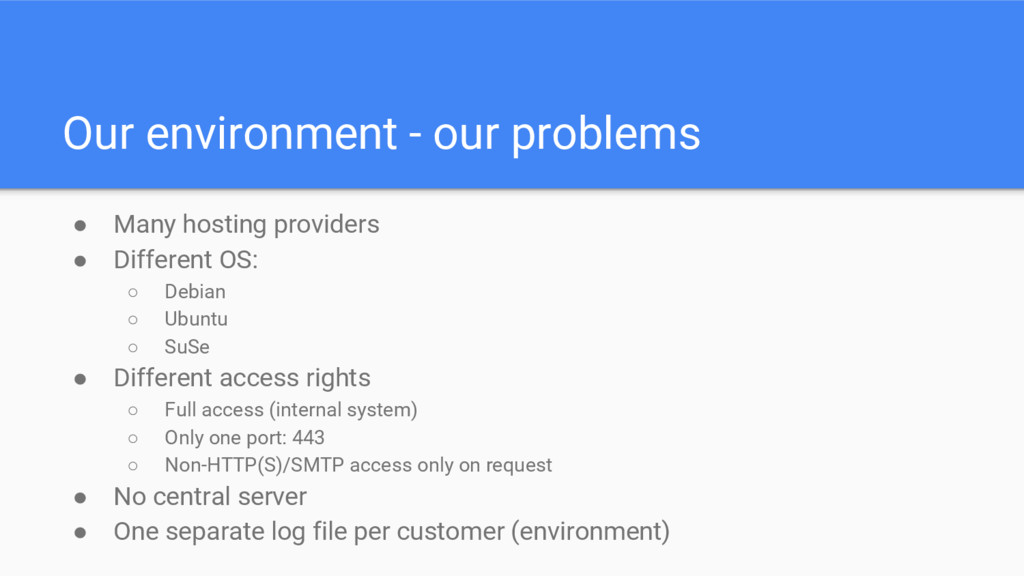
Different OS: ◦ Debian ◦ Ubuntu ◦ SuSe • Different access rights ◦ Full access (internal system) ◦ Only one port: 443 ◦ Non-HTTP(S)/SMTP access only on request • No central server • One separate log file per customer (environment)
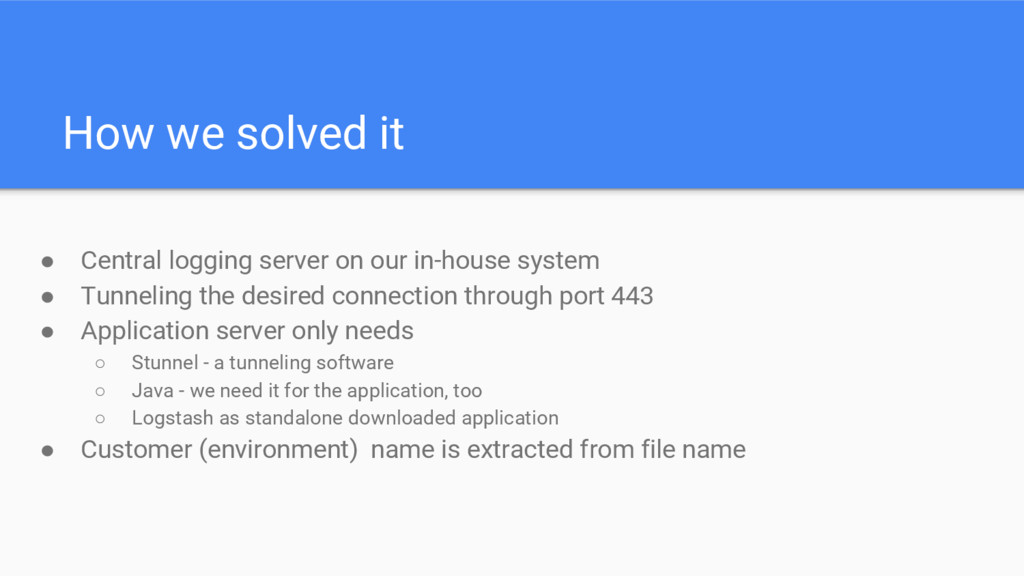
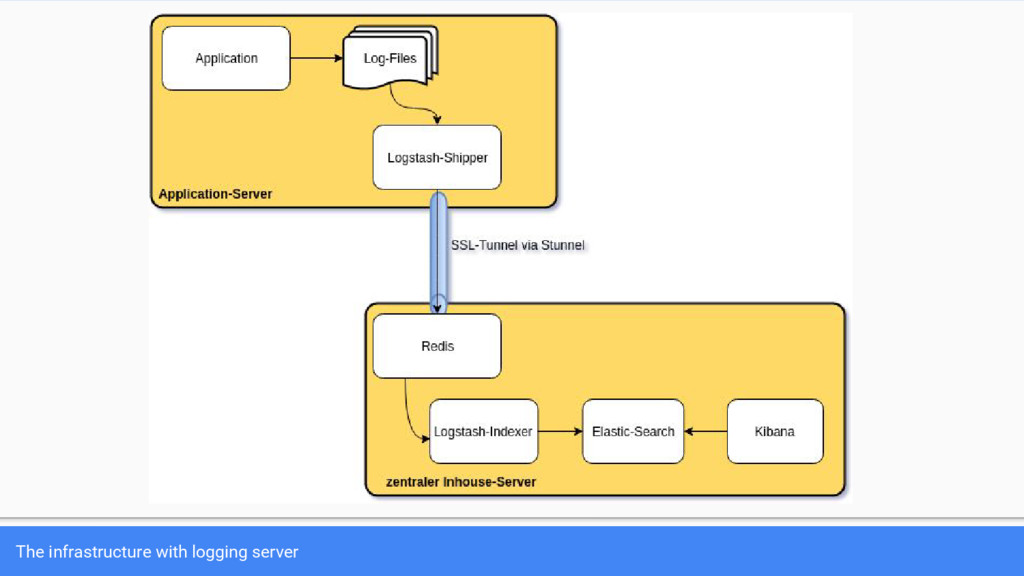
in-house system • Tunneling the desired connection through port 443 • Application server only needs ◦ Stunnel - a tunneling software ◦ Java - we need it for the application, too ◦ Logstash as standalone downloaded application • Customer (environment) name is extracted from file name


 dknx01
 sms_tech
 syumai
 ivargrimstad
 yuuu
 chigichan24
 usagi0920_pochi
 itsmedreamwalker
 t45k
 bicstone
 jsoizo
 rkaga
 kinakomoti321
 jonoalderson
 aleyda
 schlessera
 ipullrank
 rakko
 ryanjones
 holman
 cassininazir
 kimpetersen
 geshan
 auna