Upgrade to Pro — share decks privately, control downloads, hide ads and more …

The HST/ACS Coma Cluster Treasury Survey The Nature of Dwarf Galaxies Deep in the Heart of Coma

The HST/ACS Coma Cluster Treasury Survey The Nature of Dwarf Galaxies Deep in the Heart of Coma

CRAL – IPNL Conference: A Universe of Dwarf Galaxies – Observations, Theories and Simulations 14 – 18 June 2010, Lyon France

Conference website: http://cralconf.univ-lyon1.fr/2010/index.html

Dr. Arna Karick

June 16, 2010
Tweet

More Decks by Dr. Arna Karick

Other Decks in Research

Transcript

  1. A Universe of Dwarf Galaxies - June 2010 Arna Karick

    (ARI - LJMU) Ehsan Kourkchi (Sharif/ARI) Habib Khosroshahi (Sharif/ARI) Dave Carter (ARI - LJMU) + Team Coma members The Nature of Dwarf Galaxies Deep in the Heart of Coma The HST/ACS Coma Cluster Treasury Survey
  2. Next generation telescopes: JWST, TMT, ELT will focus on the

    “birth” of galaxies at z ~ 6 − 8 THe Universe As We Know It GALAXY CLUSTERS OUT TO Z~2
  3. HST/ACS Imaging ❏ Cycle 15 ACS Treasury Survey (PI: Carter

    et al 2008) ❏ Covers ~270 arcmin2 of the cluster core and infall region ❏ F814W (I) and F475W (g) band images ❏ FOV: 202″ x 202″ (11.3 arcmin2), resolution of 0.05″ ❏ Observing program terminated due to ACS failure + 7 FIELDS COMA TEAM MEMBERS Professor David Carter (PI) - UK Prof. Steve Phillipps - UK Dr Avon P. Huxor - UK Mr James Price - UK Dr Mustapha Mouhcine - UK Dr Carlos Hoyos - UK Dr Neil Trentham - UK Dr John Lucey - UK Prof. Ray M. Sharples - UK A Prof. Alister Graham - Australia Mr Juan Madrid - Australia Dr Harry C. Ferguson (PI) - US Dr Jennifer Lotz - US Dr Neal A. Miller - US Dr. Brent Tully - US Dr. Kristin Chiboucas - US Prof. Bahram Mobasher - US Dr Paul Goudfrooij - US Mr Derek Hammer - US Dr Ann Hornschemeier - US Dr Dan Batcheldor - US Prof. David Merritt - US Dr Ron Marzke - US Dr Rafael Guzman - US Dr Thomas H. Puzia - Canada Dr Terry Bridges - Canada Dr Habib Khosroshahi - ARI/Iran Mr. Ehsan Kourkchi - ARI/Iran Dr Carlos del Burgo- Ireland Dr Bryan Miller - Chile Dr Bianca Poggianti - Italy Dr Alfonso Aguerri - Spain Dr Marc Balcells - Spain Dr Reynier Peletier - Netherlands Mr Mark den Brok - Netherlands Prof. Edwin Valentijn - Netherlands Dr Gijs Verdoes Kleijn - Netherlands Dr Peter Erwin - Germany Dr Yutaka Komiyama - Japan Dr Masafumi Yagi - Japan Dr Eric Peng - China + others
  4. HST/ACS Imaging Hammer et al. (2010) The HST/ACS Coma Cluster

    Survey II: Data Description and Source Catalogs Cluster virial radius = 2.9 Mpc (Lokas & Mamon 2003) ❏ MMT/Hectospec: radial velocities for ~1600/7000 galaxies to R~20 mag ❏ DEIMOS+LRIS: additional velocities + dispersions down to R~24 ( ~21) COMA TEAM MEMBERS Professor David Carter (PI) - UK Prof. Steve Phillipps - UK Dr Avon P. Huxor - UK Mr James Price - UK Dr Mustapha Mouhcine - UK Dr Carlos Hoyos - UK Dr Neil Trentham - UK Dr John Lucey - UK Prof. Ray M. Sharples - UK A Prof. Alister Graham - Australia Mr Juan Madrid - Australia Dr Harry C. Ferguson (PI) - US Dr Jennifer Lotz - US Dr Neal A. Miller - US Dr. Brent Tully - US Dr. Kristin Chiboucas - US Prof. Bahram Mobasher - US Dr Paul Goudfrooij - US Mr Derek Hammer - US Dr Ann Hornschemeier - US Dr Dan Batcheldor - US Prof. David Merritt - US Dr Ron Marzke - US Dr Rafael Guzman - US Dr Thomas H. Puzia - Canada Dr Terry Bridges - Canada Dr Habib Khosroshahi - ARI/Iran Mr. Ehsan Kourkchi - ARI/Iran Dr Carlos del Burgo- Ireland Dr Bryan Miller - Chile Dr Bianca Poggianti - Italy Dr Alfonso Aguerri - Spain Dr Marc Balcells - Spain Dr Reynier Peletier - Netherlands Mr Mark den Brok - Netherlands Prof. Edwin Valentijn - Netherlands Dr Gijs Verdoes Kleijn - Netherlands Dr Peter Erwin - Germany Dr Yutaka Komiyama - Japan Dr Masafumi Yagi - Japan Dr Eric Peng - China + others
  5. Keck Spectroscopic Programs ❏ Keck/LRIS Spectroscopic confirmation of Coma Cluster

    dwarf galaxy membership assignments + UCDs in Coma (Chiboucas et al. 2010a - submitted, b - in prep)
  6. ❏ Velocity dispersions down to σ~20 kms-1 for large samples

    of confirmed cluster members (FOV: ~16′ x 5′) ❏ Radial velocities of LSB + UCDs galaxies (LRIS: Chiboucas et al. 2010 + future observations) ❏ Understanding the faint end, MI > −20, slope of LF (LRIS) (Trentham et al. 2010 - in prep) Motivation for DEIMOS spectroscopy Scientific Motivation: Trentham et al. (2010) - in prep ❏ The value of the exponent (α) of the Faber−Jackson relation helps to constrain galaxy formation models. (Dekel & Silk 1986, Yoshii & Arimoto 1987) ❏ Do dwarfs follow the same “Fundamental Scaling relations” as more massive galaxies? L, Reff, μeff, σ ❏ Does the high density environment have an effect on these relations? ❏ Extend previous age/metallicity analyses to lower luminosities and velocity dispersions? ie. index−σ relations Evstigneeva et al. (2006)
  7. Keck/DEIMOS Spectroscopy of Cluster Galaxies OBSERVATIONS: March 2007 OBSERVATIONS: March

    2007: Chiboucas, Tully (PI) & Carter ❏ Two DEIMOS masks (~6600s) ~200 galaxies ❏ Instrument spectral resolution (red): 1.6 Å (FWHM), pixel resolution : 0.30 Å (blue: 0.44 Å) ❏ Blue grating (900ZD l/mm, 5500 blaze) wavelength range: 4100 – 7500 Å : Line-strength indices ❏ Red grating (1200G l/mm, 7500 blaze) wavelength range: 7500‐ 11000 Å : Velocity dispersions
  8. Source Selection (from Adami et al. 2006): ❏ within ±3σ

    of the red sequence in a (B-R) vs. R color-magnitude diagram : −19 < MR < −16 mag ❏ galaxy morphology checked in ACS imaging ❏ 1.0″ width slits for radial velocity measurements of LSB cluster candidates ❏ 0.7″ width slits for velocity dispersion analysis Redshift Analysis: ❏ 50/50 galaxies are confirmed cluster members ❏ 70/153 LSB galaxy candidates are background galaxies (rest are too low S/N) ❏ 33 UCD (bright IGC) candidates: - 9/33 stars/background galaxies - 8/33 probable Coma members [Chiboucas, Karick & Khosroshahi] Keck/DEIMOS Spectroscopy of Cluster Galaxies
  9. Velocity Dispersions − the data ✗ ❏ 0.7″ width slits.

    Dispersion: 0.33 Å/pix. R = 5000 (velocity width ~ 20 kms-1) ❏ Red spectra reduced using the DEEP2 IDL pipeline. (Habib Khosroshahi) ❏ 41 galaxies with S/N ≥ 15 luminosities: − 20.5 ≤ Mr (SDSS) ≤ − 15.0 mag ❏ Velocity dispersions σ, measured from CaT Not trivial! CaT: 8498Å, 8542Å and 8662Å shifted into sky lines Analysis of red setup: 7500Å - 9000Å, CaT analysis (Kourkchi et al. 2010a in prep)
  10. Penalized Pixel Fitting (pPXF): (Cappellari & Emsellem 2004) - templates

    selected from the Indo-US stellar library (+3 observed DEIMOS templates) - radial velocity and dispersion determined simultaneously by minimising the X2 - uses multiple weighted stellar templates (~50-80) and finds best fit solution - for low S/N pPXF the noise effects are supressed in the solution - for these data pPXF appears to more robust results Errors and Uncertainties: (i) “statistical error” investigation - simulated galaxy spectra with variable S/N, errors due to random noise (ii) template mismatch - measurement limited to CaT region Analysis of red setup: 7500Å - 9000Å, CaT analysis (Kourkchi et al. 2010a in prep) Velocity Dispersions − the data Kourkchi et al. ➙ POSTER 7.11 Dynamical and Photometric Properties of Dwarf Galaxies in Coma Cluster
  11. RESULTS: Faber-Jackson Relation ( L ∝σα ) Luminosity: SDSS -

    R log ( velocity dispersion) DEIMOS slit spectroscopy Sample selection: B & R, CFHT imaging resolution: FWHM~1.6A, ~20 kms-1 CaT lines used to measure dispersions (strong & broad, observationally the easiest lines to use) Analysis of red setup: 7500Å - 9000Å, CaT analysis (Kourkchi et al. 2010a, b in prep) Kourkchi et al. (2010) in prep α = 2.15
  12. S/N < 15 For S/N > 15 DEIMOS goes an

    order of magnitude fainter SDSS magnitudes used for comparison Scatter at MR > −17 appears to be real Luminosity: SDSS - R log ( velocity dispersion) Kourkchi et al. (2010) in prep RESULTS: Faber-Jackson Relation ( L ∝σα ) Analysis of red setup: 7500Å - 9000Å, CaT analysis (Kourkchi et al. 2010a, b in prep)
  13. Cody et al. (2008) KPNO/WIYN Hydra fibre spectroscopy of early

    type galaxies −20.6 < MR < −15.7 Mgb and Hβ lines used to measure dispersions 60% galaxies have S/N <10 α = 2.0 ± 0.2 RESULTS: Faber-Jackson Relation ( L ∝σα ) Luminosity: SDSS - R log ( velocity dispersion) Analysis of red setup: 7500Å - 9000Å, CaT analysis (Kourkchi et al. 2010a, b in prep)
  14. Matkovic et al. (2005) (for S/N > 15) KPNO/WIYN Hydra

    fibre (3″) spectroscopy Reff ~ 2″ for Coma Sample selection: U,B,R WIYN+INT imaging resolution: FWHM~1.4A, ~40 kms-1 Mgb and Hβ lines used to measure dispersions 4120 Å − 5600 Å RESULTS: Faber-Jackson Relation ( L ∝σα ) Luminosity: SDSS - R log ( velocity dispersion) Analysis of red setup: 7500Å - 9000Å, CaT analysis (Kourkchi et al. 2010a, b in prep)
  15. Matkovic et al. (2005) KPNO/WIYN Hydra fibre (3″) spectroscopy Reff

    ~ 2″ for Coma Sample selection: U,B,R WIYN+INT imaging resolution: FWHM~1.4A, ~40 kms-1 Mgb and Hβ lines used to measure dispersions 4120 Å − 5600 Å RESULTS: Faber-Jackson Relation ( L ∝σα ) Luminosity: SDSS - R log ( velocity dispersion) Analysis of red setup: 7500Å - 9000Å, CaT analysis (Kourkchi et al. 2010a, b in prep)
  16. Matkovic et al. (2005) (for S/N > 15) KPNO/WIYN Hydra

    fibre (3″) spectroscopy Reff ~ 2″ for Coma Sample selection: U,B,R WIYN+INT imaging resolution: FWHM~1.4A, ~40 kms-1 Mgb and Hβ lines used to measure dispersions 4120 Å − 5600 Å RESULTS: Faber-Jackson Relation ( L ∝σα ) Luminosity: SDSS - R log ( velocity dispersion) Analysis of red setup: 7500Å - 9000Å, CaT analysis (Kourkchi et al. 2010a, b in prep)
  17. Interpreting Results... ❏ Does the relation flatten at σ ~20

    kms-1 ? ❏ Is there a resolution issue? ➛ implications for UCD velocity dispersions: VLT/UVES+Keck/ESI observations > 15 kms −1 (Hilker et al. 2006, Evstigneeva et al. 2006) ❏ Is there a gap in the relation between dwarfs (dEs/dSphs) and UCDs? ❏ It’s important not to OVER INTERPRET the data...
  18. In Progress - Structural Parameter Analysis Kourkchi et al. (2010b)

    in prep ❏ How does the scatter at the faint end of the L − σ relation depend on other parameters? i.e. Sersic index? or μeff? THE FUNDAMENTAL & PHOTOMETRIC PLANES PROFILE FITTING ❏ multi-component fits (Sersic + Gaussian PSF) when necessary ❏ investigating deviations from single Sersic profiles
  19. In Progress - Fundamental and Photometric Planes ❏ Investigate the

    mapping between Photometric (PhotP) and Fundamental (FP) planes. (Khosroshahi et al. 2000) ❏ Investigate the capability of the PhotP to reduce the scatter at low luminosities. ➙ desirable for cases where dispersions may be unobtainable (time consuming) ❏ Need to understand the outliers -- internal spiral structure/bad Sersic fits. ❏ Determine dynamical masses of cluster galaxies bright faint Kourkchi et al. (2010) in prep
  20. Dynamical and Photometric Properties of Dwarf Galaxies in Coma Cluster

    1: Institute for Research in Fundamental Sciences (IPM) 2: Sharif University Of Technology 3: Astrophysics Research Institute, Liverpool John Moores University 4: Institute for Astronomy, University of Hawaii Kourkchi, E.1,2; Khosroshahi, H.1; Carter, D.3; Chiboucas, K. 4; Karick, A.3 and Coma Collaboration Team A) The HST ACS Coma cluster Treasury survey is a deep two-passband imaging survey (F475W and F814W filters) of one of the nearest rich clusters of galaxies. The Coma core is the densest galaxy environment in the local universe. As such, it provides a key local, high-density benchmark for comparison to surveys of less dense and relaxed environ- ments, high-redshift HST cluster surveys and field surveys. The completed survey covers 274 square arcmin of sky in the core and infall region of the Coma cluster. For our pho- tometric analysis, we use ACS data. Core of Coma Cluster B) The Spectroscopic Analysis: A sample of ~50 dwarf galaxies within the core of Coma cluster were observed us- ing DEIMOS on the Keck II telescope. The spectral resolu- tion (FWHM) of 1.6 Å allows us to measure the velocity dis- persions down to ~15 km/s for the wavelength range between 7,500 to 10,000 Å. The dominant spectral feature in this wavelength range is the calcium II triplet absorption lines (CaT). With the aid of CaT lines, we measure the ve- locity dispersion and radial velocity of sample galaxies. We use Monte Calro bootstrapping to study various sources of uncertainty in our measurements, namely statistical uncer- tainty, template mismatch and other systematics. C) Faber-Jackson Relation (FJ): The current study covers one magnitude fainter galaxies in R-band compared to the pre- vious studies of the Coma dwarf galaxies. Based on this study, the FJ trend is shallower than what is expected for brighter galaxies. Given the uncertainties in measurements, our find- ings show that the velocity dispersions of galaxies fainter than M R =-16 are larger than the value expected from the extrapola- tion of existing observations. E) Deviation from the Fundamental Plane We investigate the deviation from the fundamental plane as a function of the shape of the light profile, the excess light at the core of the galaxy and the galaxy luminosity. The extra light is the imprint of the formation history of the galaxies and is believed to be the result of the last major merger which formed the galaxy. D) The Fundamental Plane (FP) and the Photometric Plane (PP): The deviation from the FP and PP increases for fainter galaxies. For these galaxies, the velocity dispersion is unexpec- tedly high. In this regime, galaxies have higher mass-to-light ra- tio than that expected from the trends found for brighter galax- ies. PP is more sensitive to the morphology of the galaxies. Core of Coma Cluster ACS Footprint Credit & Copyright: Jim Misti Kourkchi et al. ➙ POSTER 7.11 see Habib Khosroshahi Dynamical and Photometric Properties of Dwarf Galaxies in Coma Cluster
  21. den Brok et al. ➙ POSTER 5.15 Photometric and Structural

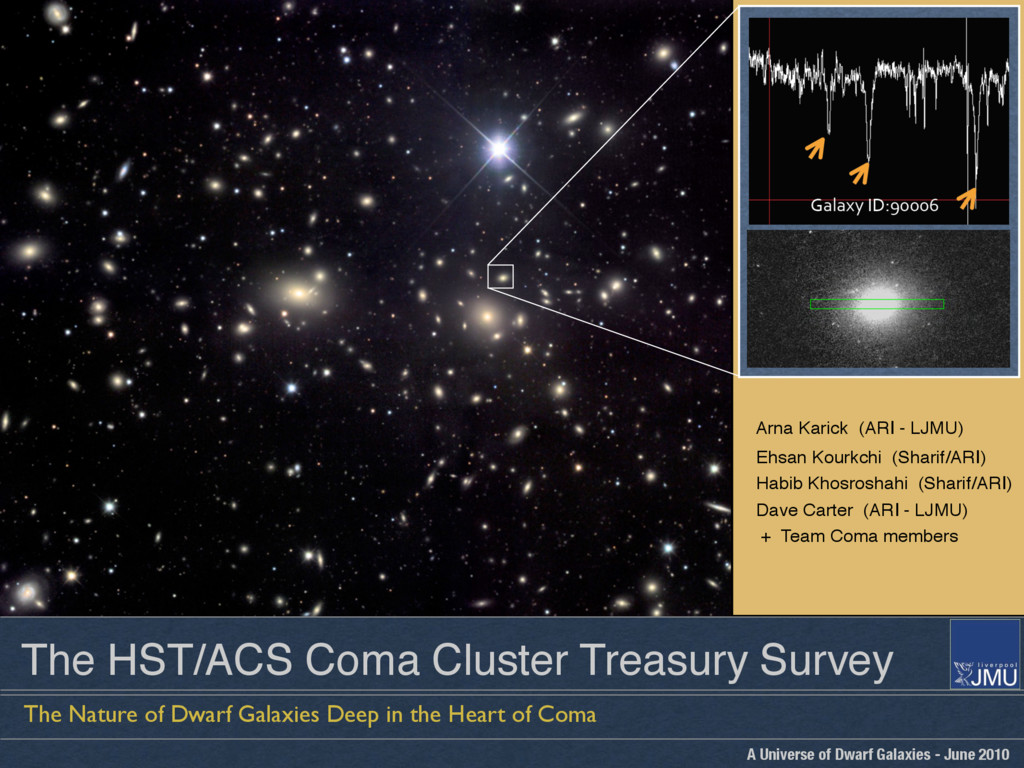
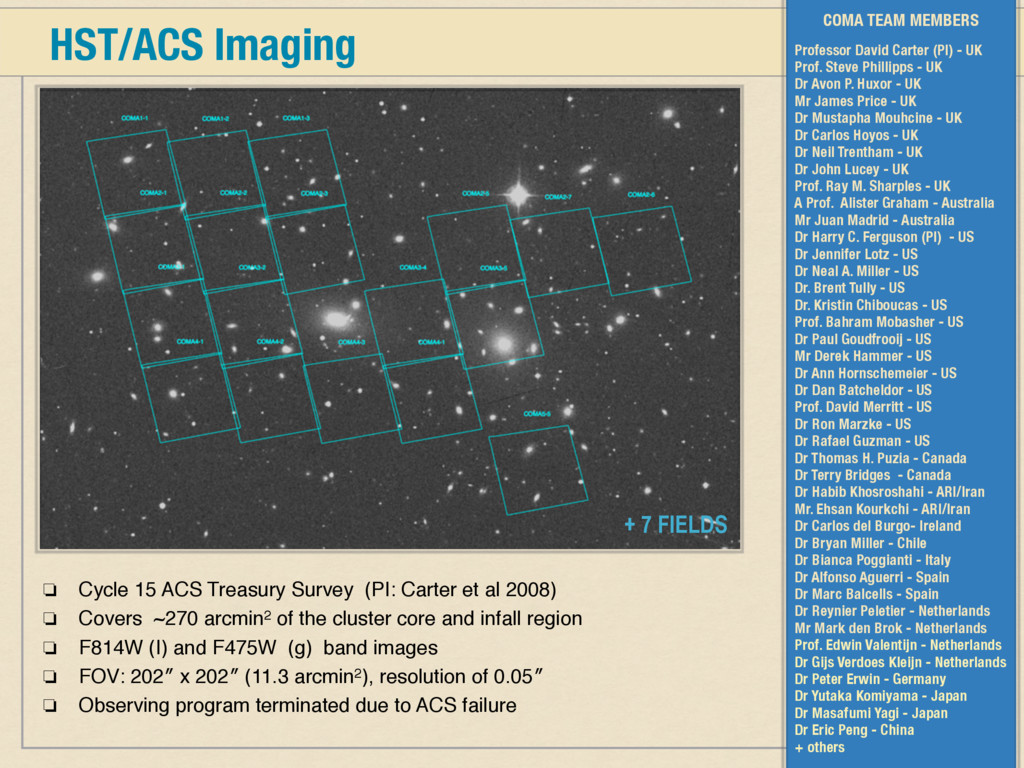
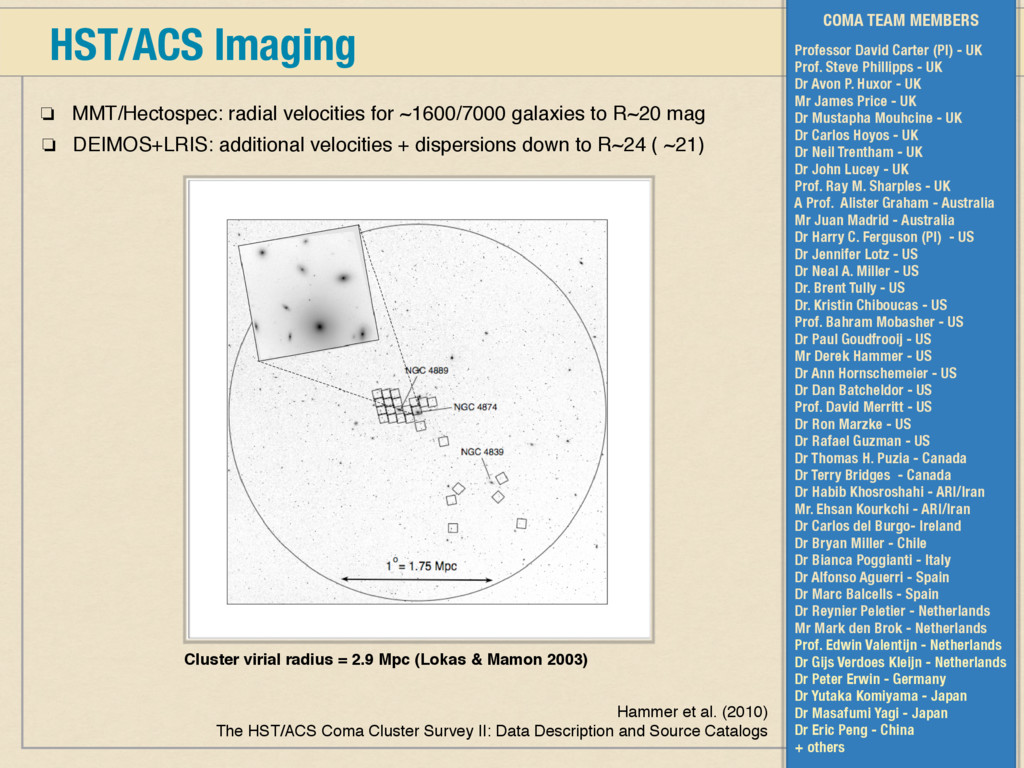
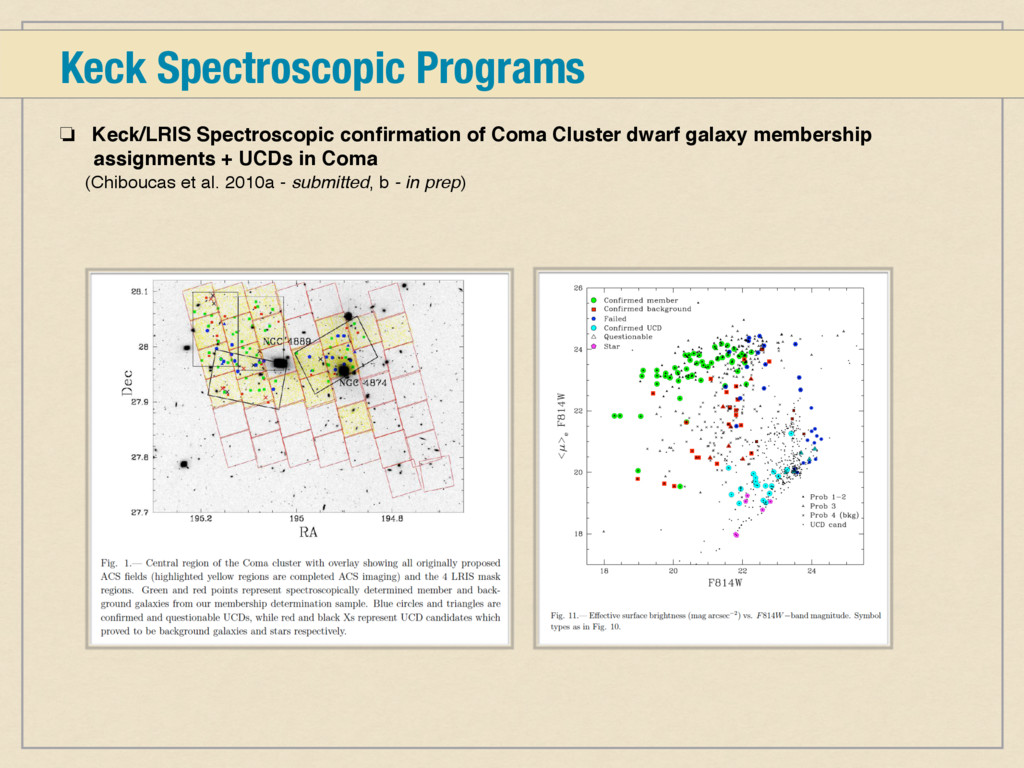
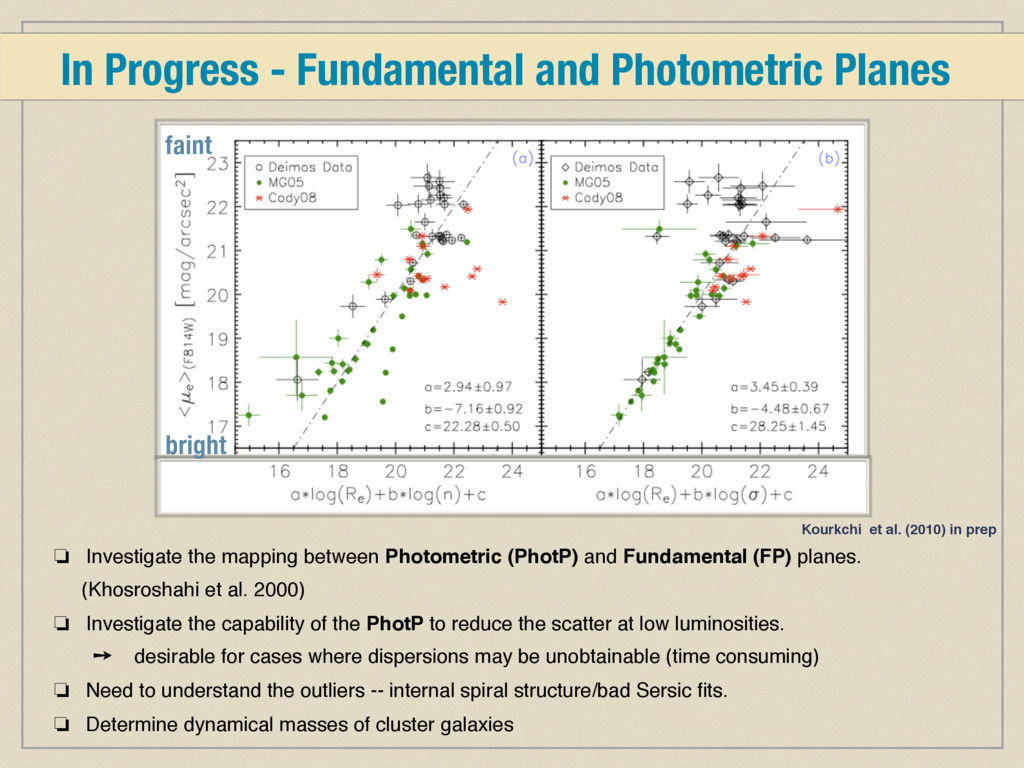
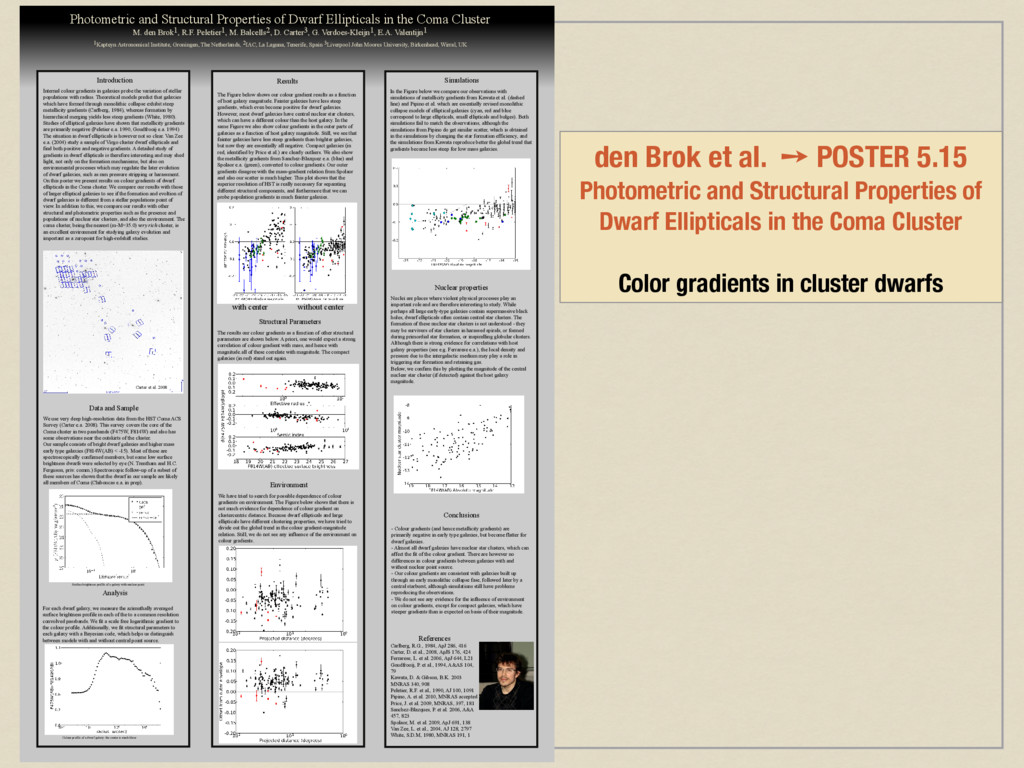
    Properties of Dwarf Ellipticals in the Coma Cluster Color gradients in cluster dwarfs Photometric and Structural Properties of Dwarf Ellipticals in the Coma Cluster M. den Brok1, R.F. Peletier1, M. Balcells2, D. Carter3, G. Verdoes-Kleijn1, E.A. Valentijn1 1Kapteyn Astronomical Institute, Groningen, The Netherlands, 2IAC, La Laguna, Tenerife, Spain 3Liverpool John Moores University, Birkenhead, Wirral, UK Introduction Internal colour gradients in galaxies probe the variation of stellar populations with radius. Theoretical models predict that galaxies which have formed through monolithic collapse exhibit steep metallicity gradients (Carlberg, 1984), whereas formation by hierarchical merging yields less steep gradients (White, 1980). Studies of elliptical galaxies have shown that metallicity gradients are primarily negative (Peletier e.a. 1990, Goudfrooij e.a. 1994) The situation in dwarf ellipticals is however not so clear. Van Zee e.a. (2004) study a sample of Virgo cluster dwarf ellipticals and find both positive and negative gradients. A detailed study of gradients in dwarf ellipticals is therefore interesting and may shed light, not only on the formation mechanisms, but also on environmental processes which may regulate the later evolution of dwarf galaxies, such as ram pressure stripping or harassment. On this poster we present results on colour gradients of dwarf ellipticals in the Coma cluster. We compare our results with those of larger elliptical galaxies to see if the formation and evoltion of dwarf galaxies is different from a stellar populations point of view. In addition to this, we compare our results with other structural and photometric properties such as the presence and populations of nuclear star clusters, and also the environment. The coma cluster, being the nearest (m-M=35.0) very rich cluster, is an excellent environment for studying galaxy evolution and important as a zeropoint for high-redshift studies. Data and Sample We use very deep high-resolution data from the HST Coma ACS Survey (Carter e.a. 2008). This survey covers the core of the Coma cluster in two passbands (F475W, F814W) and also has some observations near the outskirts of the cluster. Our sample consists of bright dwarf galaxies and higher mass early type galaxies (F814W(AB) < -15). Most of these are spectroscopically confirmed members, but some low surface brightness dwarfs were selected by eye (N. Trentham and H.C. Ferguson, priv. comm.) Spectroscopic follow-up of a subset of these sources has shown that the dwarf in our sample are likely all members of Coma (Chiboucas e.a. in prep). Results The Figure below shows our colour gradient results as a function of host galaxy magnitude. Fainter galaxies have less steep gradients, which even become positive for dwarf galaxies. However, most dwarf galaxies have central nuclear star clusters, which can have a different colour than the host galaxy. In the same Figure we also show colour gradients in the outer parts of galaxies as a function of host galaxy magnitude. Still, we see that fainter galaxies have less steep gradients than brighter galaxies, but now they are essentially all negative. Compact galaxies (in red, identified by Price et al.) are clearly outliers. We also show the metallicity gradients from Sanchez-Blazquez e.a. (blue) and Spolaor e.a. (green), converted to colour gradients. Our outer gradients disagree with the mass-gradient relation from Spolaor and also our scatter is much higher. This plot shows that the superior resolution of HST is really necessary for separating different structural components, and furthermore that we can probe population gradients in much fainter galaxies. Structural Parameters The results our colour gradients as a function of other structural parameters are shown below. A priori, one would expect a strong correlation of colour gradient with mass, and hence with magnitude.all of these correlate with magnitude. The compact galaxies (in red) stand out again. Environment We have tried to search for possible dependence of colour gradients on environment. The Figure below shows that there is not much evidence for dependence of colour gradient on clustercentric distance. Because dwarf ellipticals and large ellipticals have different clustering properties, we have tried to divide out the global trend in the colour gradient-magnitude relation. Still, we do not see any influence of the environment on colour gradients. Conclusions - Colour gradients (and hence metallicity gradients) are primarily negative in early type galaxies, but become flatter for dwarf galaxies. - Almost all dwarf galaxies have nuclear star clusters, which can affect the fit of the colour gradient. There are however no differences in colour gradients between galaxies with and without nuclear point source. - Our colour gradients are consistent with galaxies built up through an early monolithic collapse fase, followed later by a central starburst, although simulations still have problems reproducing the observations. - We do not see any evidence for the influence of environment on colour gradients, except for compact galaxies, which have steeper gradients than is expected on basis of their magnitude. References Carlberg, R.G., 1984, ApJ 286, 416 Carter, D. et al., 2008, ApJS 176, 424 Ferrarese, L. et al. 2006, ApJ 644, L21 Goudfrooij, P. et al., 1994, A&AS 104, 79 Kawata, D. & Gibson, B.K. 2003 MNRAS 340, 908 Peletier, R.F. et al., 1990, AJ 100, 1091 Pipino, A. et al. 2010, MNRAS accepted Price, J. et al. 2009, MNRAS, 397, 181 Sanchez-Blazques, P. et al. 2006, A&A 457, 823 Spolaor, M. et al. 2009, ApJ 691, 138 Van Zee, L. et al., 2004, AJ 128, 2797 White, S.D.M, 1980, MNRAS 191, 1 Simulations In the Figure below we compare our observations with simulations of metallicity gradients from Kawata et al. (dashed line) and Pipino et al. which are essentially revised monolithic collapse models of elliptical galaxies (cyan, red and blue correspond to large ellipticals, small ellipticals and bulges). Both simulations fail to match the observations, although the simulations from Pipino do get similar scatter, which is obtained in the simulations by changing the star formation efficiency, and the simulations from Kawata reproduce better the global trend that gradients become less steep for low mass galaxies. Nuclear properties Nuclei are places where violent physical processes play an important role and are therefore interesting to study. While perhaps all large early-type galaxies contain supermassive black holes, dwarf ellipticals often contain central star clusters. The formation of these nuclear star clusters is not understood - they may be survivers of star clusters in harassed spirals, or formed during primordial star formation, or inspiralling globular clusters. Although there is strong evidence for correlations with host galaxy properties (see e.g. Ferrarese e.a.), the local density and pressure due to the intergalactic medium may play a role in triggering star formation and retaining gas. Below, we confirm this by plotting the magnitude of the central nuclear star cluster (if detected) against the host galaxy magnitude. Analysis For each dwarf galaxy, we measure the azimuthally averaged surface brightness profile in each of the to a common resolution convolved passbands. We fit a scale free logarithmic gradient to the colour profile. Additionally, we fit structural parameters to each galaxy with a Bayesian code, which helps us distinguish between models with and without central point source. with center without center Carter et al. 2008 Surface brightness profile of a galaxy with nuclear point Colour profile of a dwarf galaxy: the center is much bluer
  22. Stellar Populations Scientific Motivation: Analysis of blue setup: 3900A -

    6700A, Line-strength indices (Karick et al. 2010, in prep) ❏ For Elliptical galaxies: Mg/Fe ratios increase with velocity dispersion +0.3 dex above solar for σ > 200 kms−1 ❏ For Dwarf galaxies: Mg/Fe ratios roughly − solar (Geha et al. 2003) − supersolar (Chillingarian 2008) ❏ To characterize stellar populations and kinematics of dwarfs in the high density cluster core In particular -- investigating various line index−σ relations. ❏ Extend previous work in Coma to fainter magnitudes − lower velocity dispersion. (Poggianti et al 2001, Caldwell et al 2003, Sánchez-Blásquez et al. 2006: σ > 50 kms−1) (Matkovic et al. 2005, 2009: σ > 35 kms−1) + Smith et al. 2009 − NEXT TALK! ❏ Matkovic et. al. (2005) have show that galaxies with σ < 100 kms−1 follow a steeper slope than galaxies with σ >100 kms−1 Is the DEIMOS data consistent with this picture?
  23. Stellar Populations - preliminary analysis ❏ Blue spectra reduced using

    a tweaked DEEP2 pipeline (wavelength calibration tricky!) ❏ DEIMOS optimized for red setup. Low throughput restricts us to ~5000−6500Å (ie. Mg2, Mgb, Fe5270, Fe5335 lines) ❏ Preliminary results for 18 galaxies with velocity dispersions (red points) ❏ Combined with data from Matkovic et al. (2009) to look at the scatter and index−σ slope for σ < 100 kms-1 (black points) Mg2 − σ tight for Es: low dispersion in age? dwarfs? depends mostly of [Fe/H]? signif dependence on age? Different slopes due to relative abundances of [Mg/Fe], [C/Fe], and [N/Fe] etc.? Analysis of blue setup: 3900A - 6700A, Line-strength indices (Karick et al. 2010, in prep) From M05: for σ < 100 kms-1 From M05: for σ > 100 kms-1 From M05: for entire (binned) sample Consider this a taster
  24. Stellar Populations - future work Analysis of blue setup: 3900A

    - 6700A, Line-strength indices (Karick et al. 2010, in prep) ❏ Derive ages & metallicities using BaSTI stellar evolution models (Pietrinferni et al. 2004) ❏ Does metallicity correlate with the Fundamental Plane parameters? ❏ Compare to other Stellar Population models: EZ-AGES (Shiavon et al. 2007, Graves & Schiavon 2008) High spectral (~1Å) and metallicity resolution: Δ[Fe/H] ~0.2 [Fe/H] ~ −2.62 to +0.05 for scaled-solar & α− enhanced mixture Integrated stellar populations Fully self-consistent in terms of α− enhancement: Full control of spectra and isochrones (in-house: Maurizio Salaris & Susan Percival) Systematics well understood (+ current work towards modelling HB/EHB)
  25. Summary ❏ Velocity dispersions measured for 41 galaxies using high

    resolution DEIMOS spectra More DEIMOS observations to extend this analysis to fainter luminosities (UCDs) Also need better statistics. ❏ Preliminary Structural Parameter analysis from HST/ACS imaging Detailed analysis of all Coma cluster galaxies within ACS fields ❏ Measurement of Mg and Fe line indices: preliminary investigation of the slopes/scatter of the index − σ relations for low velocity dispersions (30 kms-1) Use higher S/N data for line indices (Hectospec + future LRIS/ DEIMOS) Derive ages & metallicities using BaSTI stellar evolution models Compare to other models... FUTURE: FUTURE: FUTURE: FUTURE: BaSTI@ARI, Salaris & Percival: http://albione.oa-teramo.inaf.it/