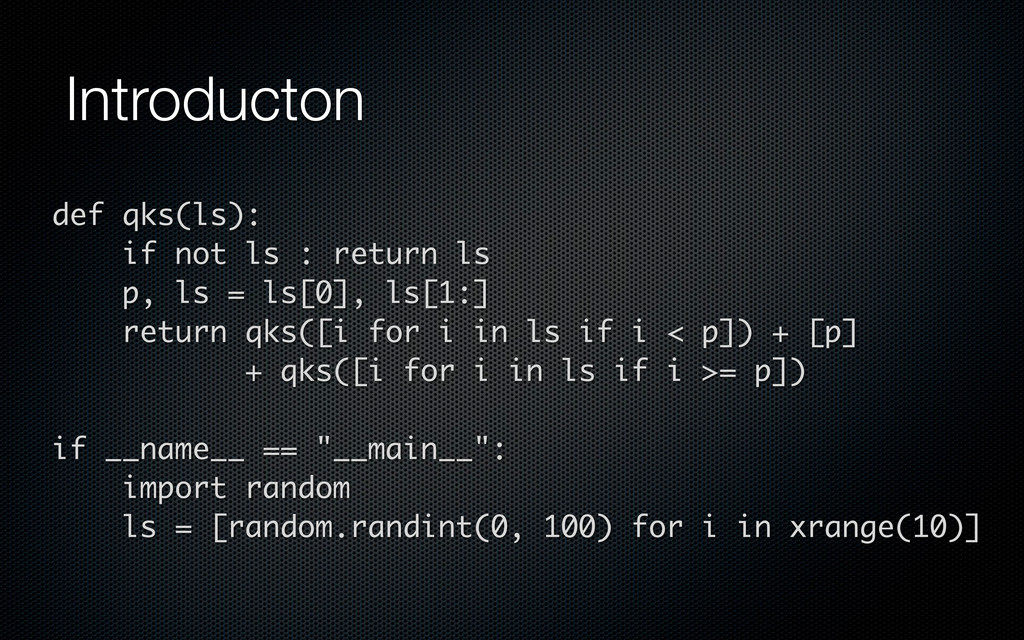
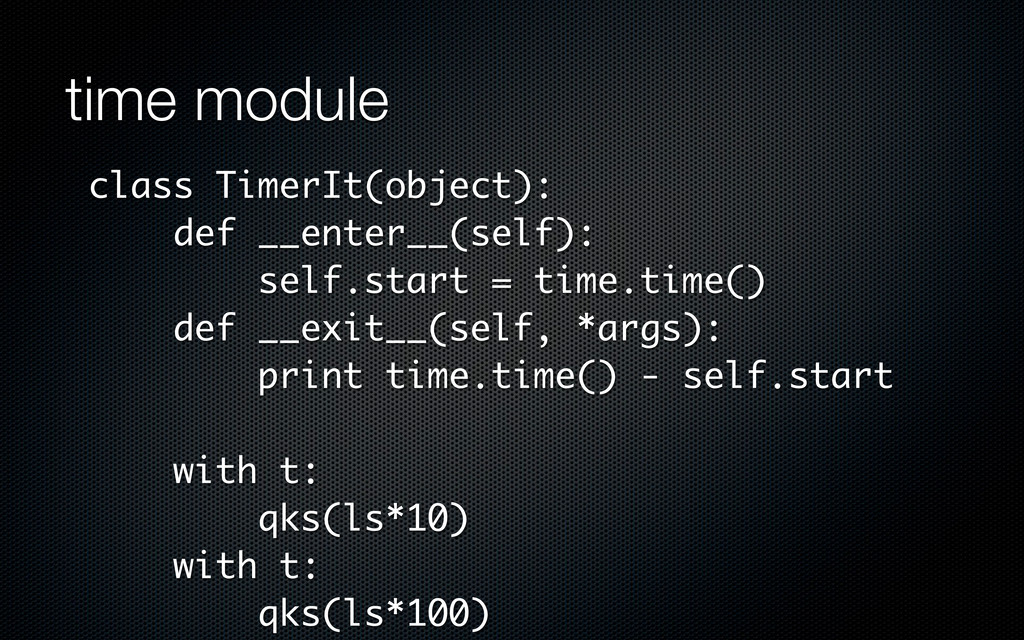
ls = ls[0], ls[1:] return qks([i for i in ls if i < p]) + [p] + qks([i for i in ls if i >= p]) if __name__ == "__main__": import random ls = [random.randint(0, 100) for i in xrange(10)]
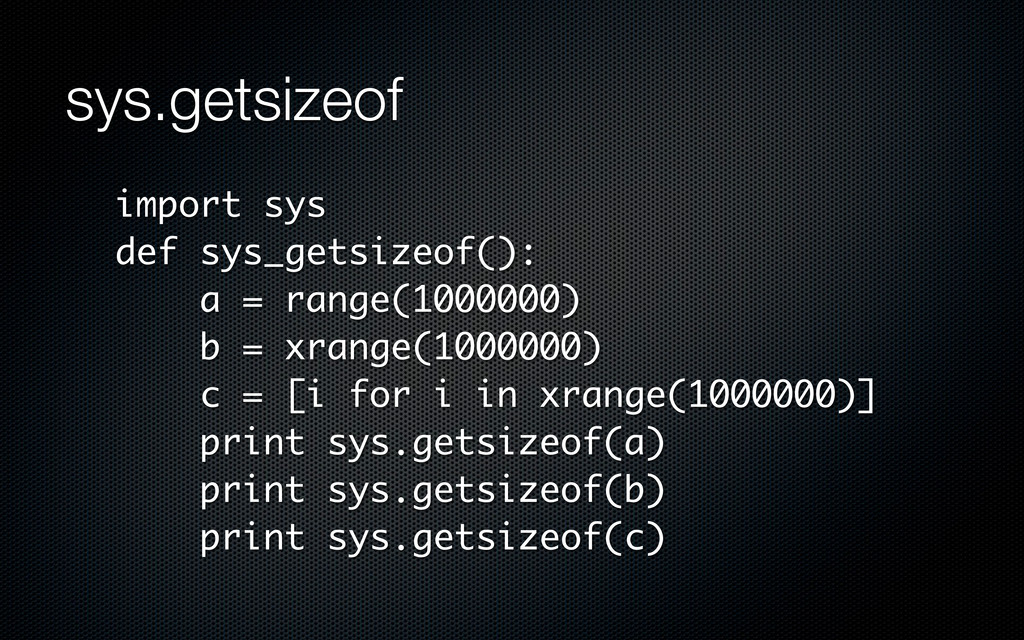
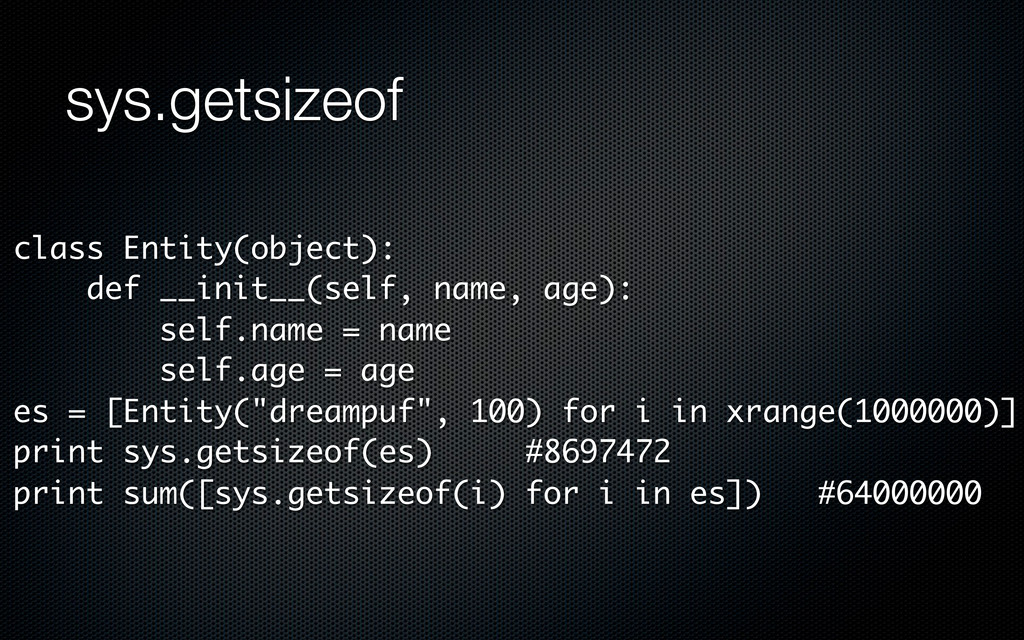
self.age = age es = [Entity("dreampuf", 100) for i in xrange(1000000)] print sys.getsizeof(es) #8697472 print sum([sys.getsizeof(i) for i in es]) #64000000
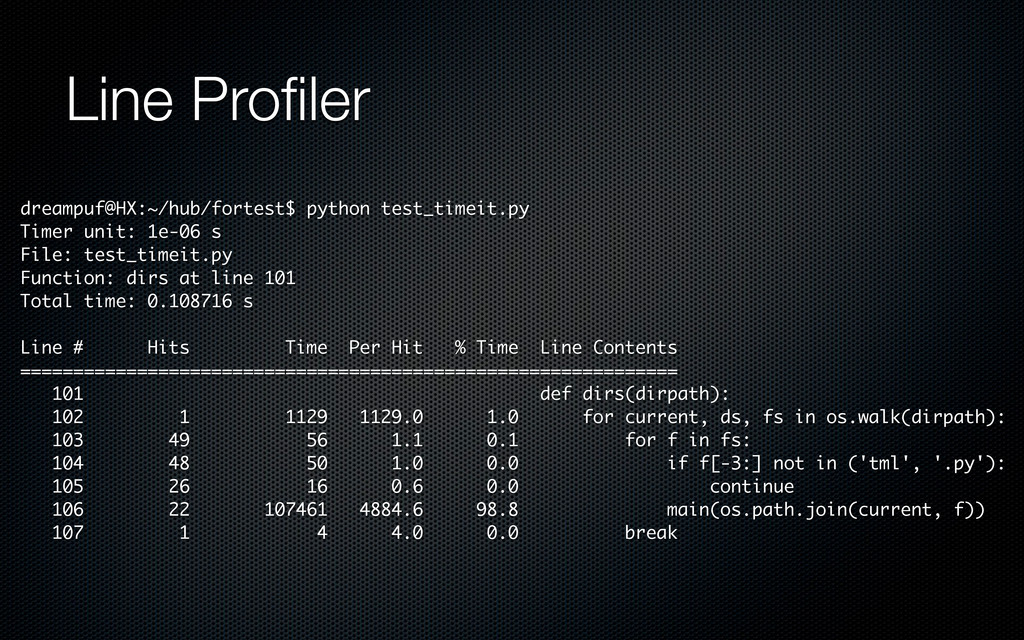
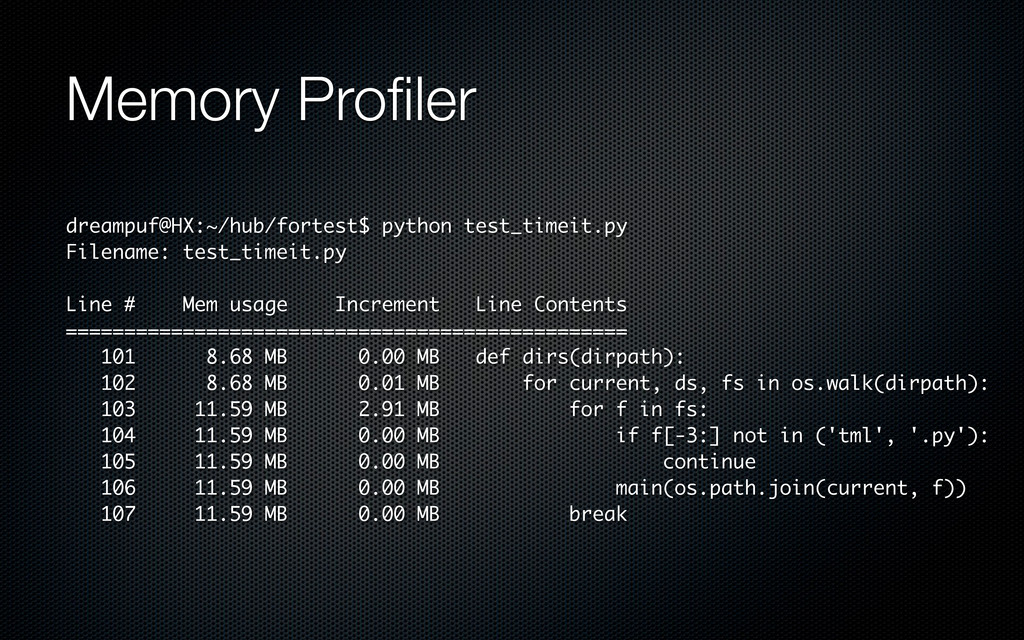
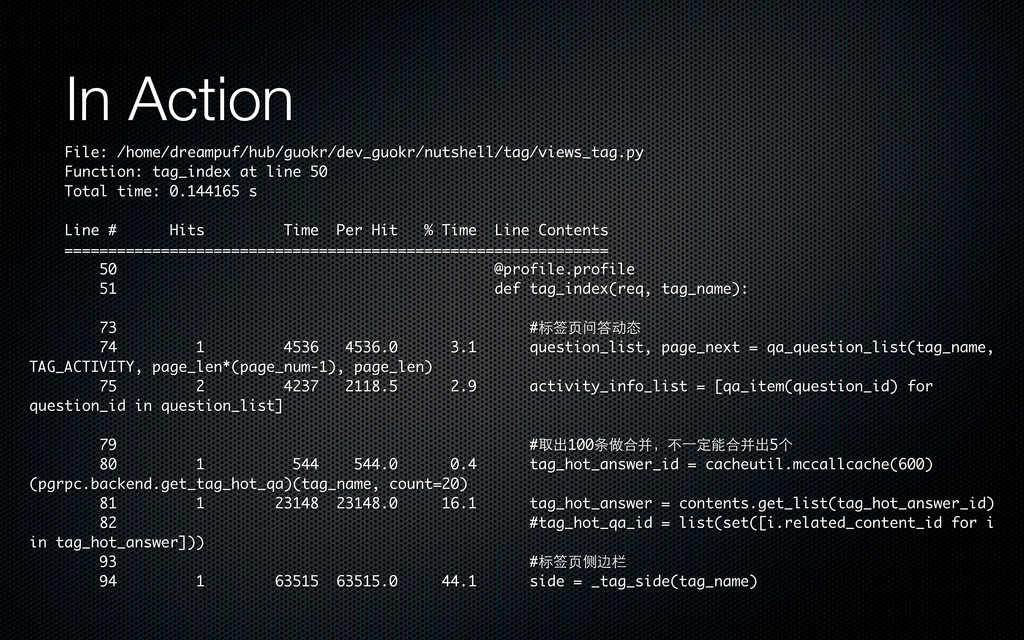
test_timeit.py Function: dirs at line 101 Total time: 0.108716 s Line # Hits Time Per Hit % Time Line Contents ============================================================== 101 def dirs(dirpath): 102 1 1129 1129.0 1.0 for current, ds, fs in os.walk(dirpath): 103 49 56 1.1 0.1 for f in fs: 104 48 50 1.0 0.0 if f[-3:] not in ('tml', '.py'): 105 26 16 0.6 0.0 continue 106 22 107461 4884.6 98.8 main(os.path.join(current, f)) 107 1 4 4.0 0.0 break
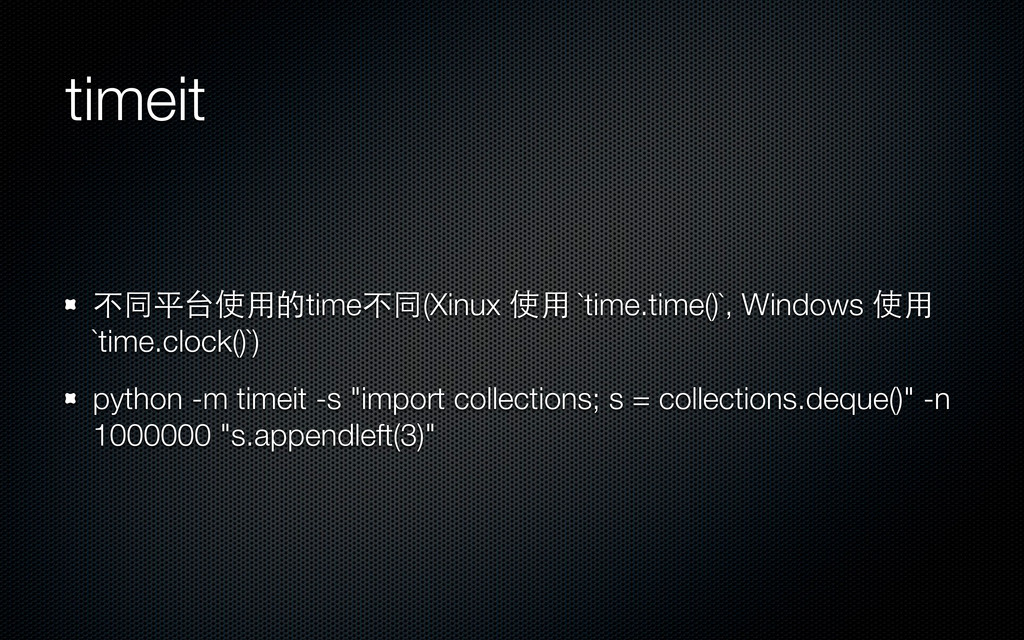
![timeit In [1]: from timeit import timeit In [2]: timeit('s.appendleft(3)',](https://files.speakerdeck.com/presentations/505c8725ae04f50002057472/slide_12.jpg)
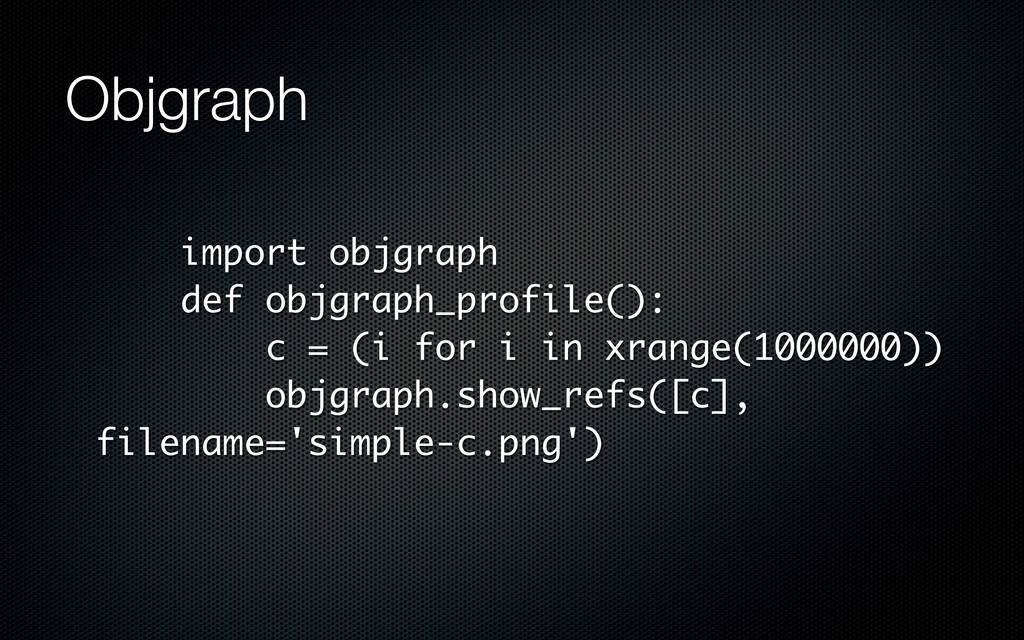
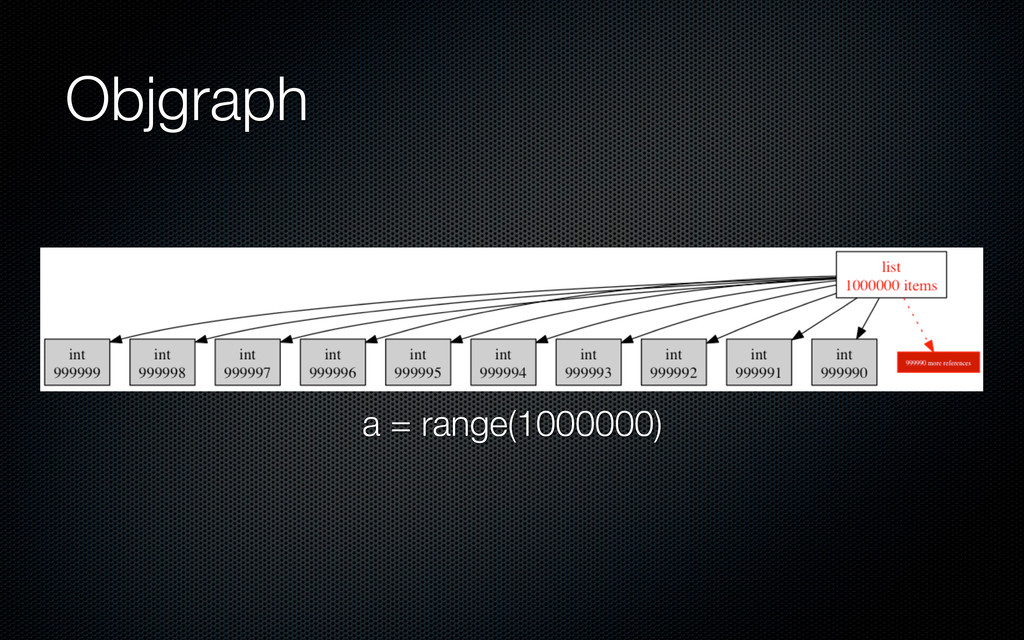
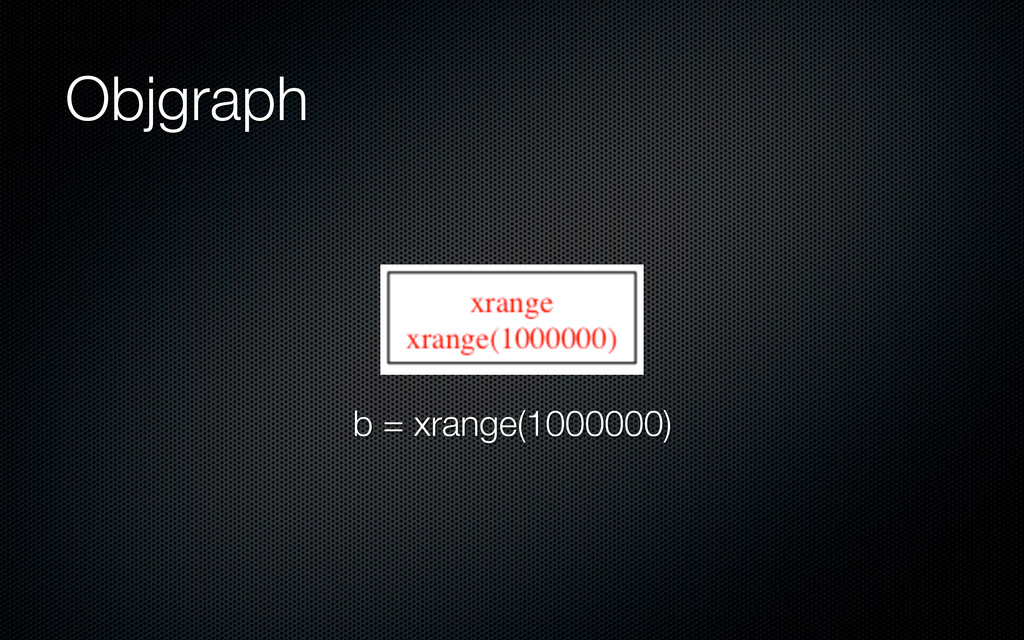
![Objgraph es = [Entity("dreampuf", 100) for i in xrange(1000)]](https://files.speakerdeck.com/presentations/505c8725ae04f50002057472/slide_34.jpg)
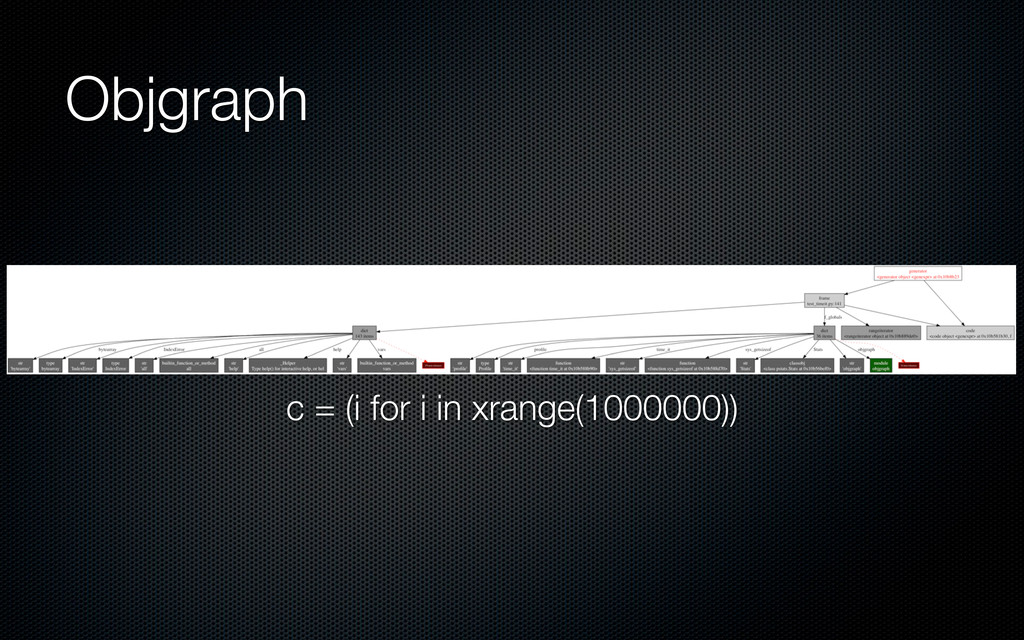
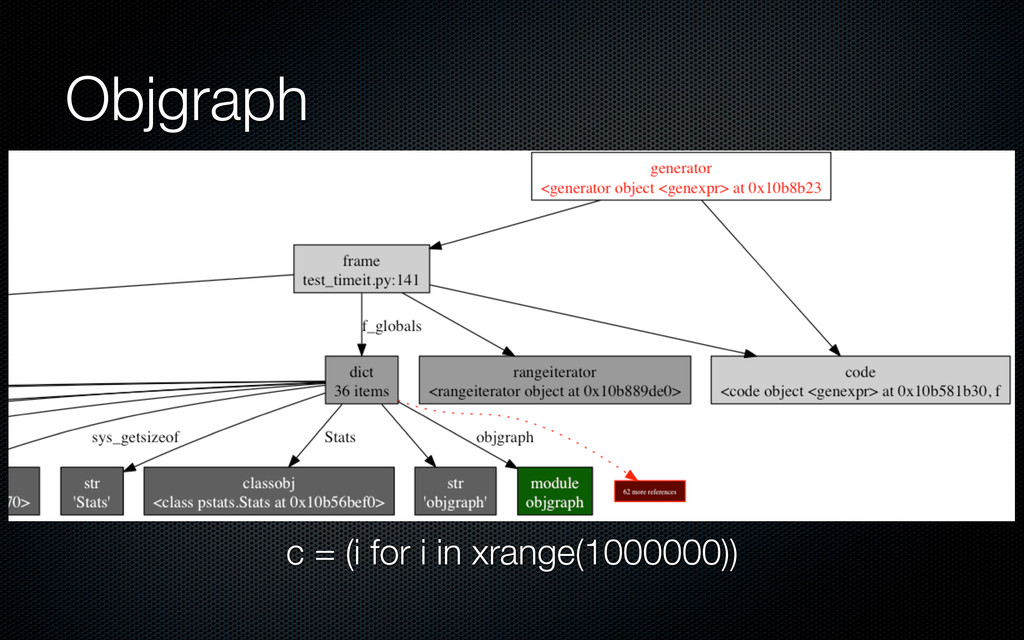
![Objgraph es = [Entity("dreampuf", 100) for i in xrange(1000)]](https://files.speakerdeck.com/presentations/505c8725ae04f50002057472/slide_35.jpg)
 - [The Python Profilers](http://docs.python.org/library/profile.html) - [Profiling threads](http://code.activestate.com/recipes/465831-profiling-threads/)](https://files.speakerdeck.com/presentations/505c8725ae04f50002057472/slide_43.jpg)