Upgrade to Pro — share decks privately, control downloads, hide ads and more …

D3Js

Dreampuf
January 15, 2013

 D3Js

A short introduction of D3js

Dreampuf

January 15, 2013
Tweet

More Decks by Dreampuf

Other Decks in Technology

Transcript

  1. AGENDA AGENDA Introduction Examples A guide of bar chart The

    analysis of source code The Wealth & Health of Nations An time series visual design of Adserver svn commit record Resources
  2. D3.JS: DATA-DRIVEN DOCUMENTS D3.JS: DATA-DRIVEN DOCUMENTS JavaScript Library Open source

    (BSD license) developed by Michael Bostock and others at Stanford University former work on Protovis Library from Intro to d3
  3. D3.JS: DATA-DRIVEN DOCUMENTS D3.JS: DATA-DRIVEN DOCUMENTS not a traditional visualization

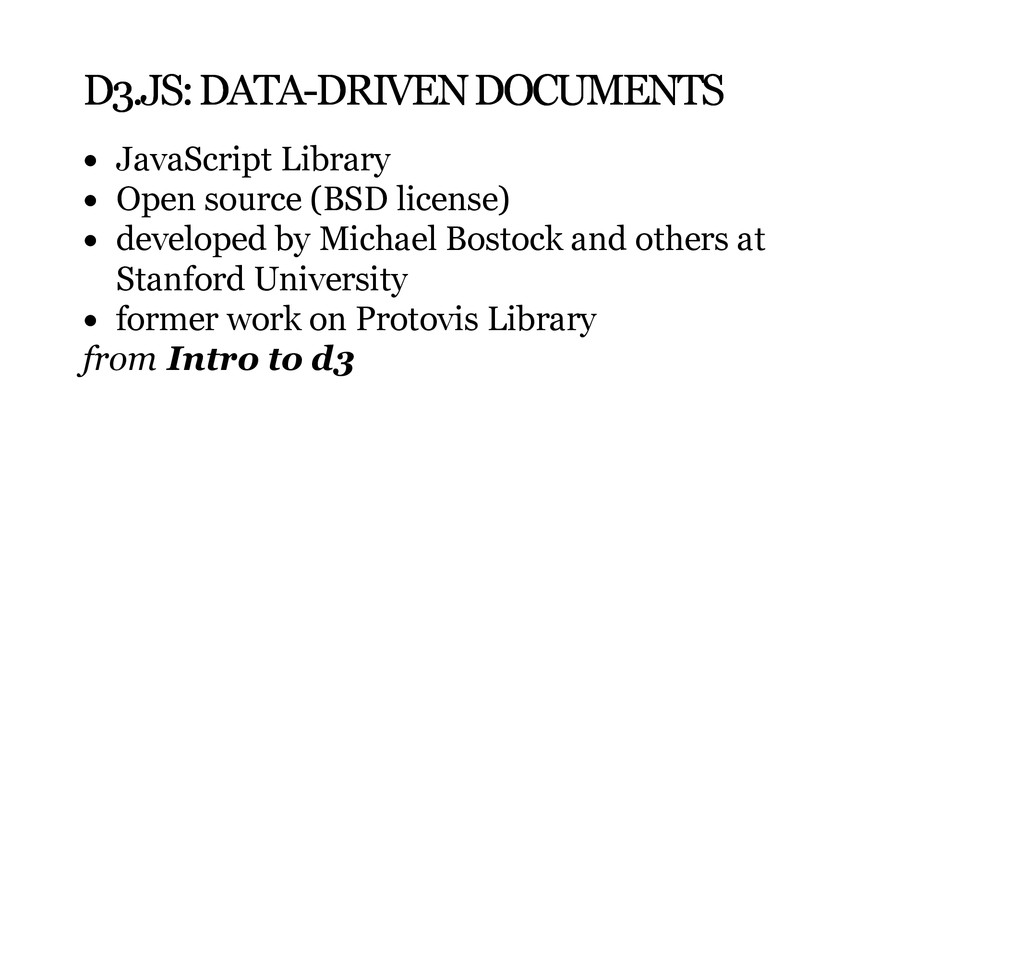
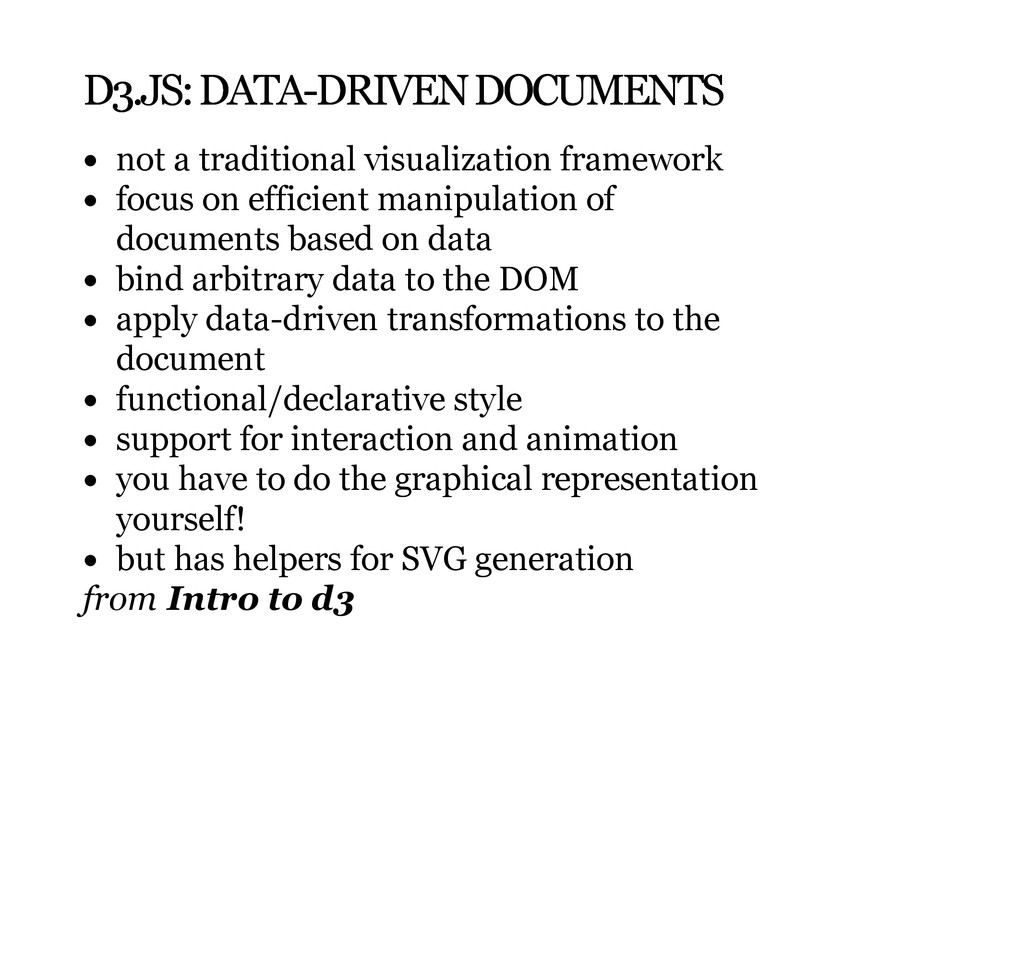
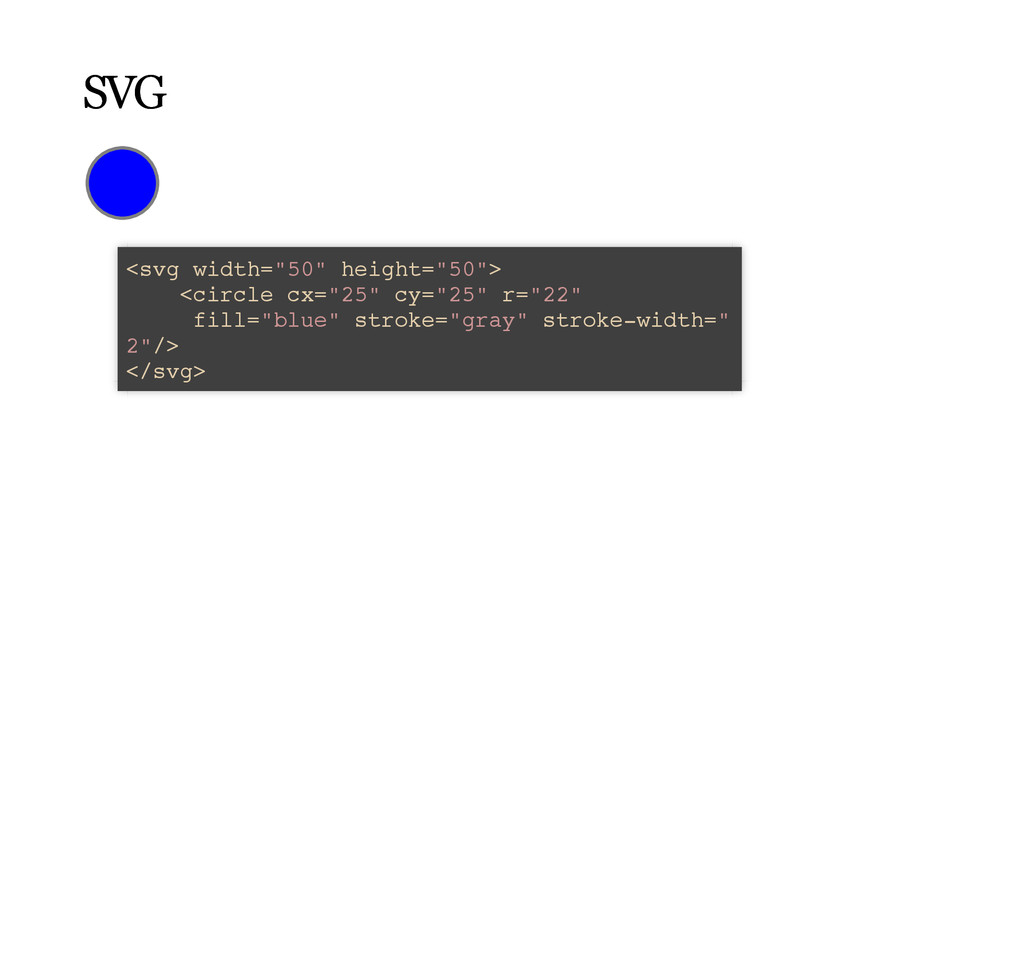
    framework focus on efficient manipulation of documents based on data bind arbitrary data to the DOM apply data-driven transformations to the document functional/declarative style support for interaction and animation you have to do the graphical representation yourself! but has helpers for SVG generation from Intro to d3
  4. SELECTIONS SELECTIONS operate on arbitrary sets of nodes called selections

    W3C Selectors API or Sizzle fallback d3.selectAll("p") .style("color", "white");
  5. DYNAMIC PROPERTIES DYNAMIC PROPERTIES bind data to a selection apply

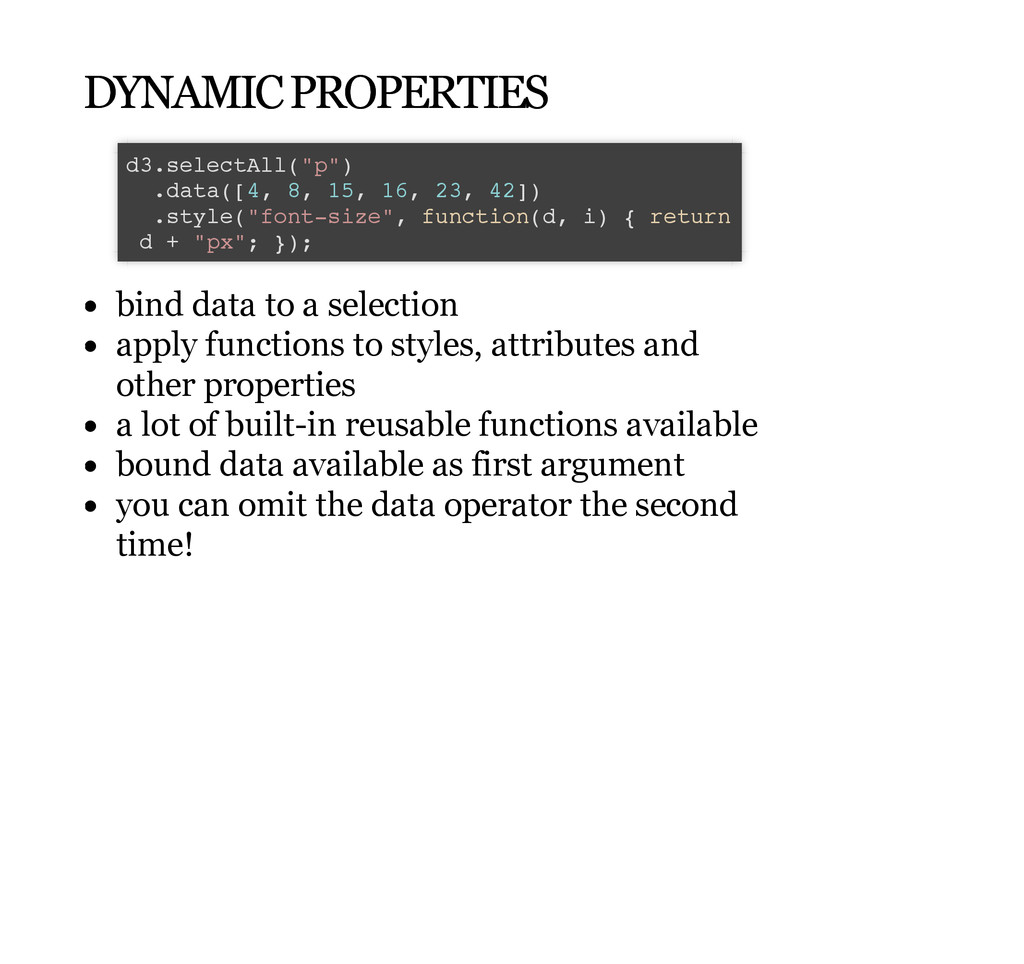
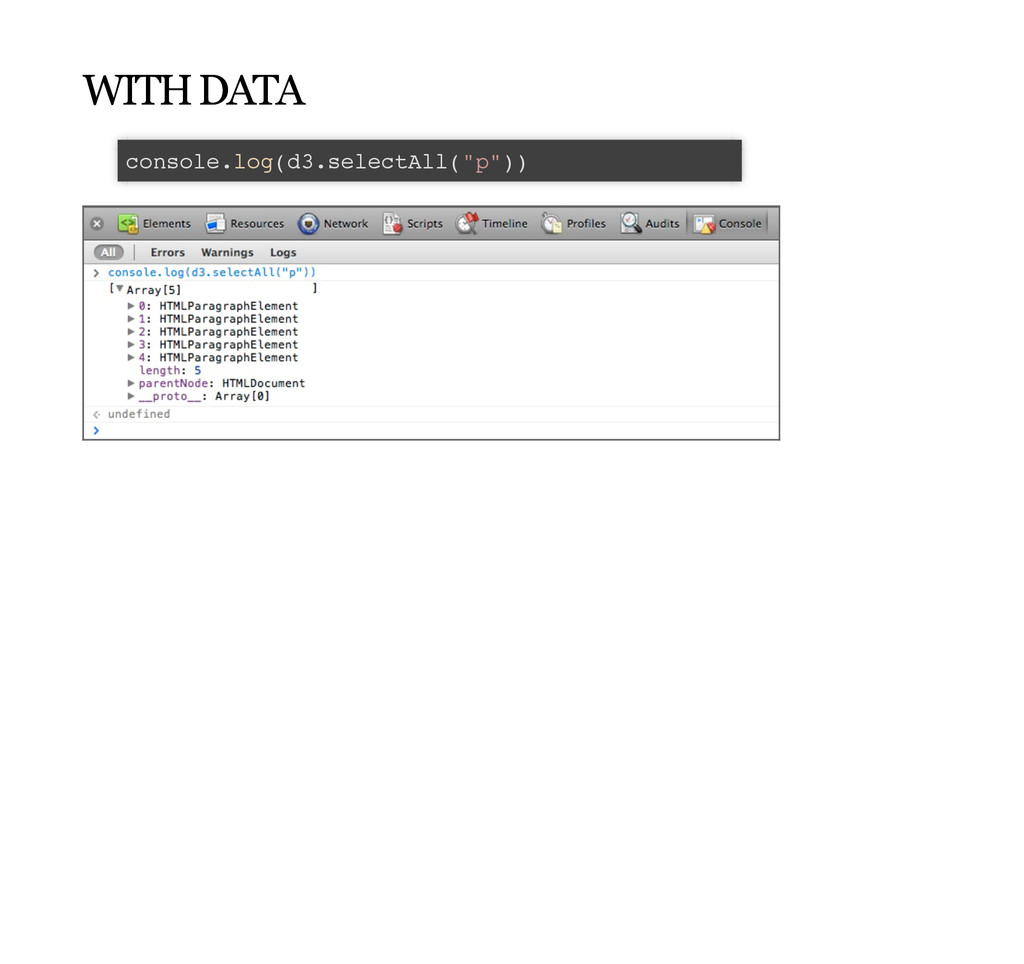
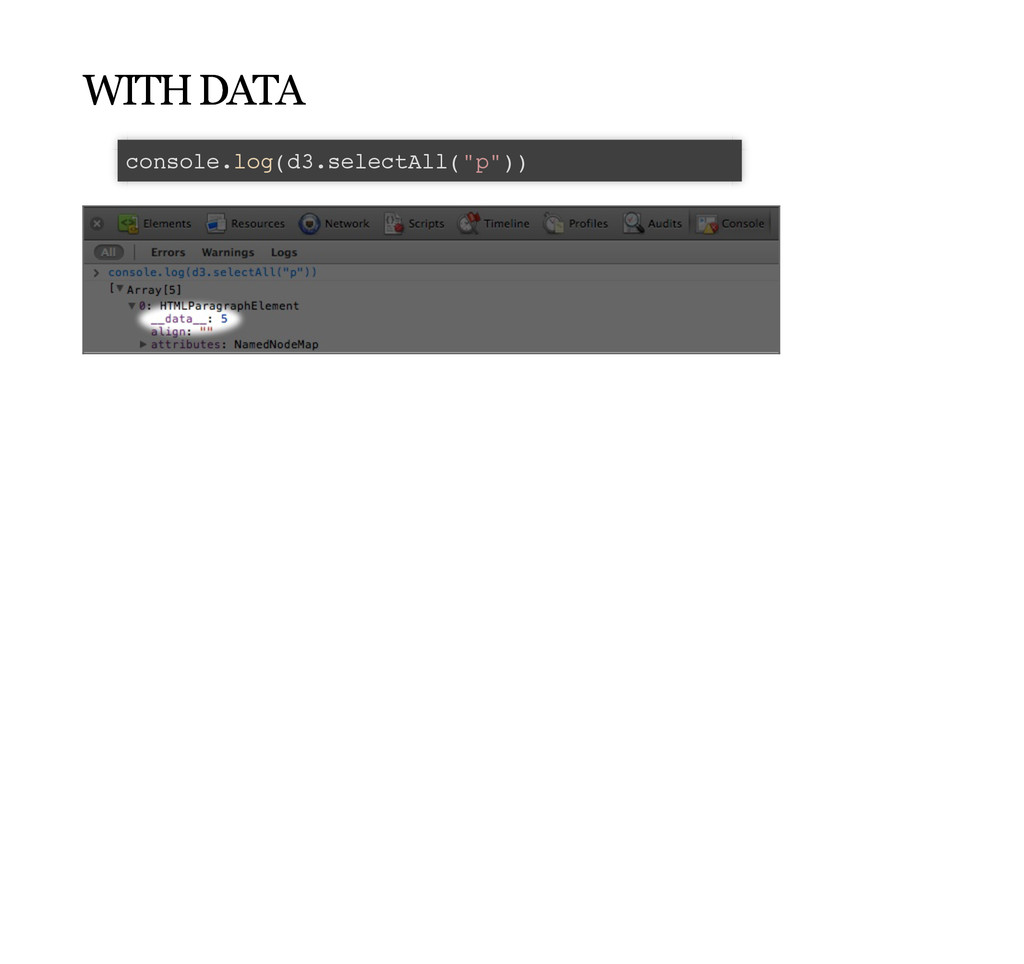
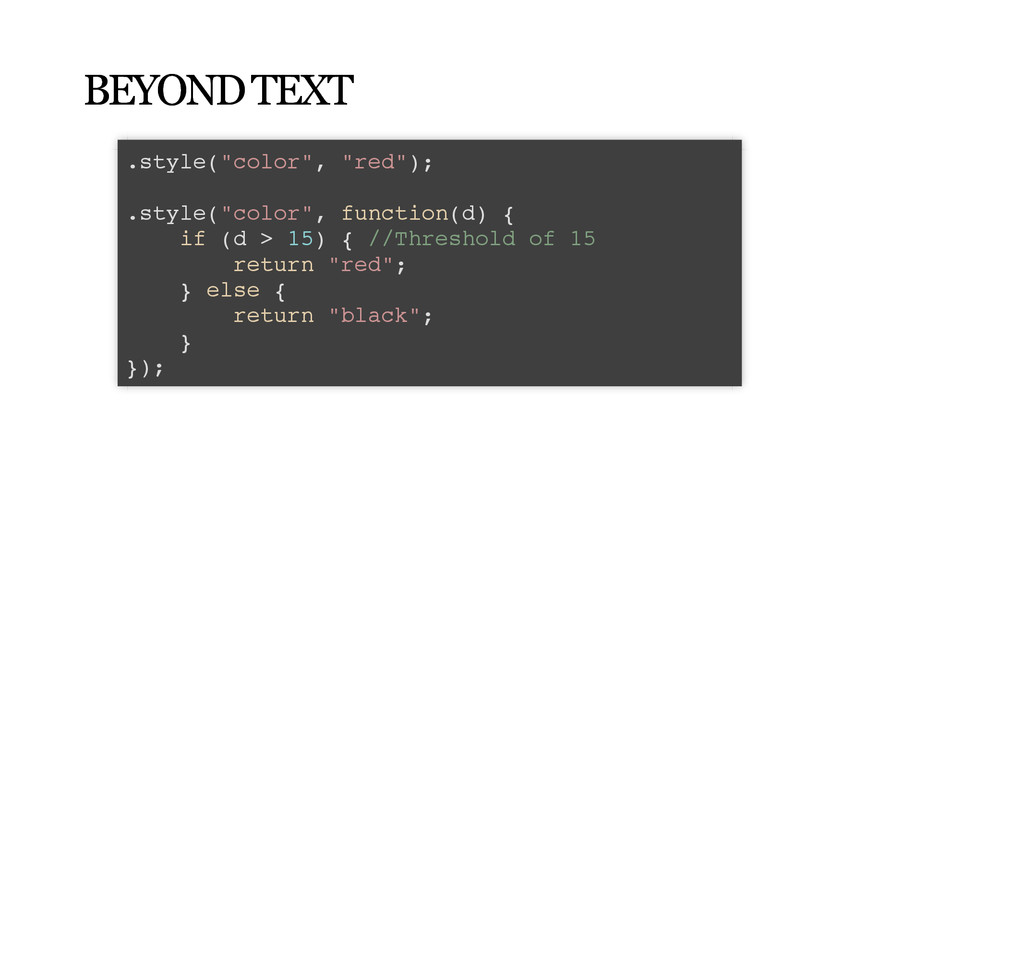
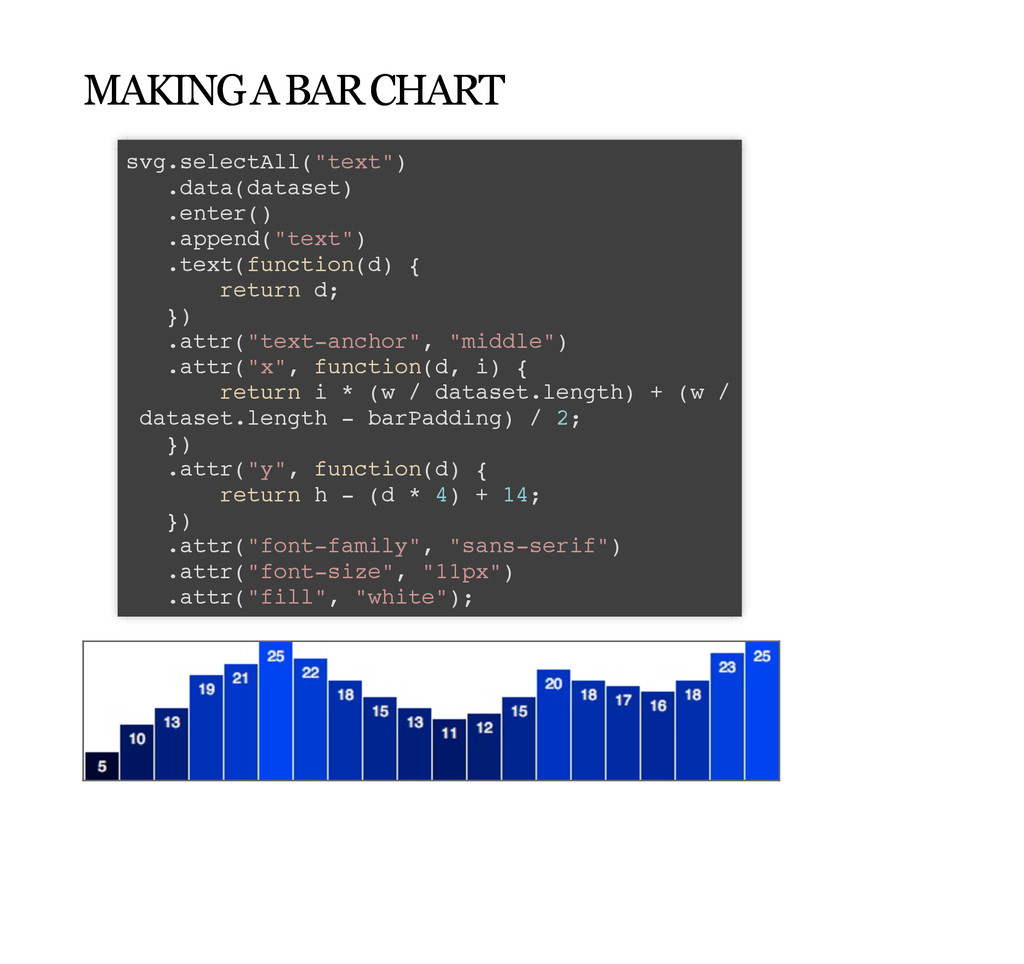
    functions to styles, attributes and other properties a lot of built-in reusable functions available bound data available as first argument you can omit the data operator the second time! d3.selectAll("p") .data([4, 8, 15, 16, 23, 42]) .style("font-size", function(d, i) { return d + "px"; });
  6. ENTER AND EXIT ENTER AND EXIT enter: selects all data

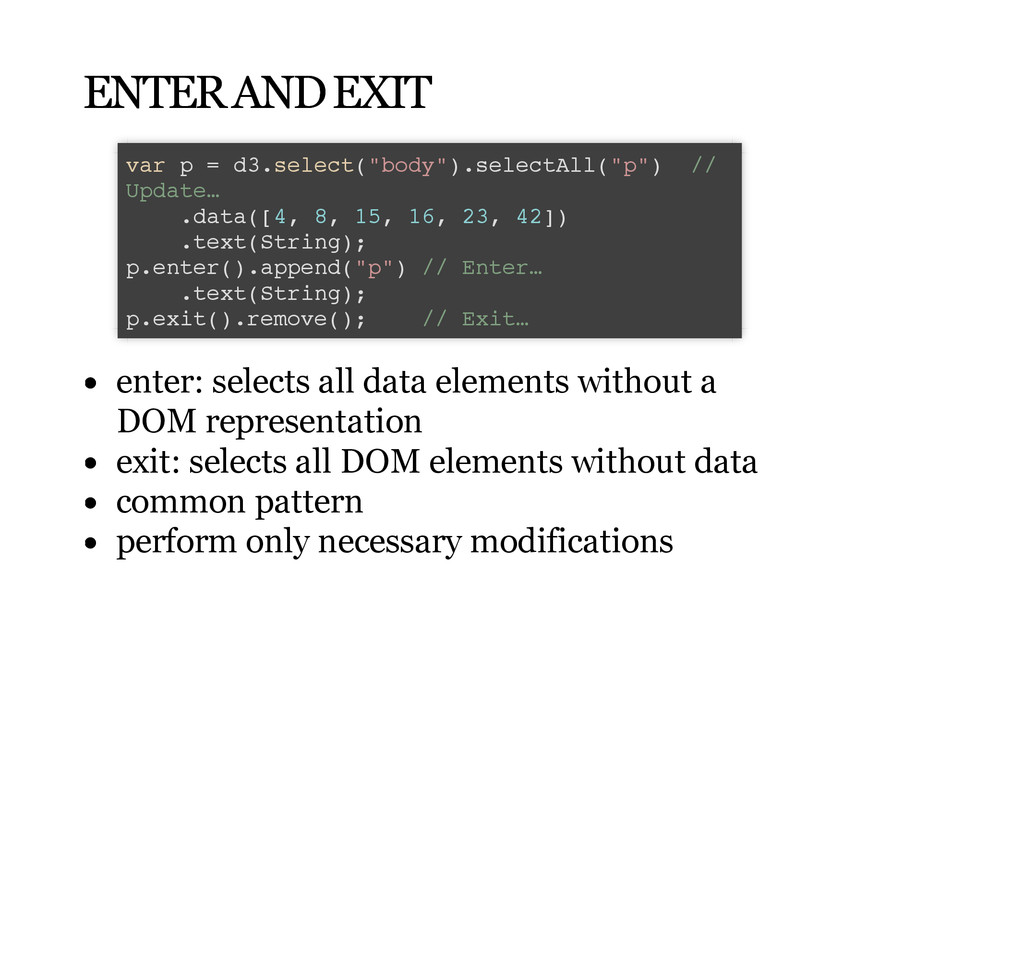
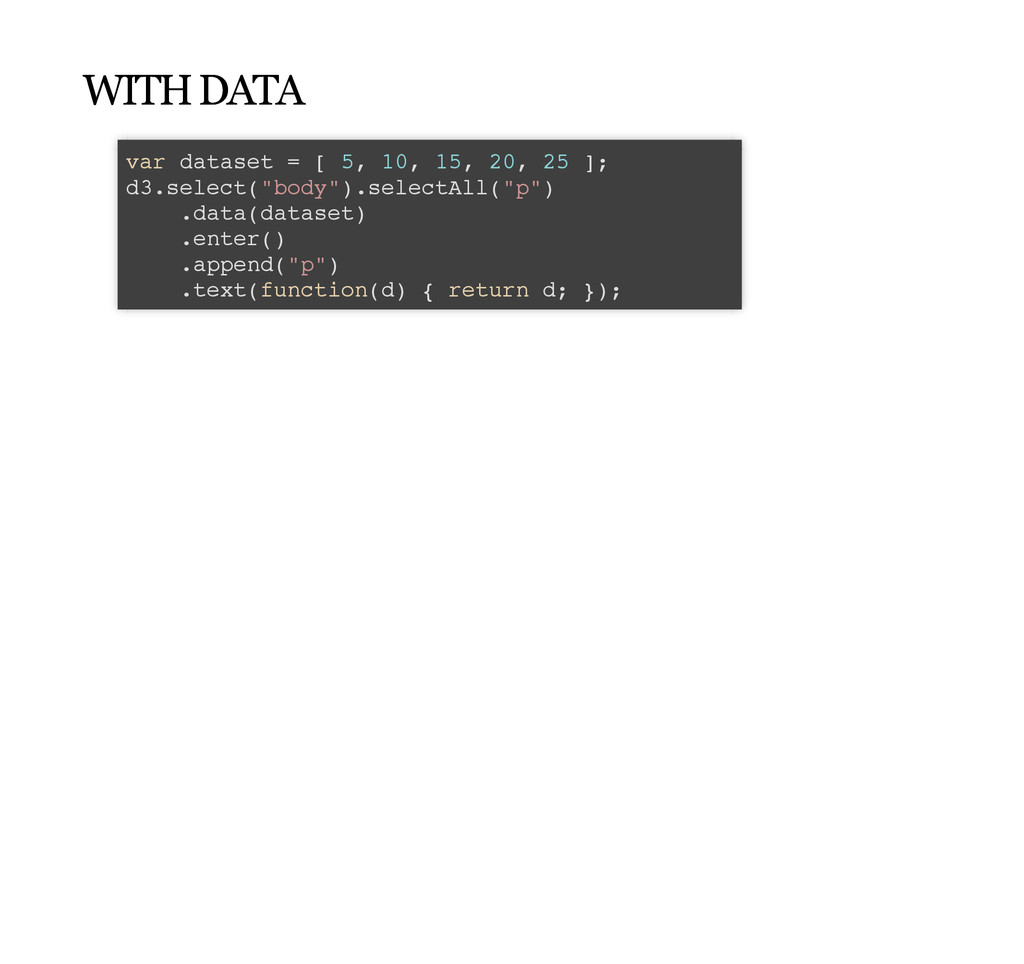
    elements without a DOM representation exit: selects all DOM elements without data common pattern perform only necessary modifications var p = d3.select("body").selectAll("p") // Update… .data([4, 8, 15, 16, 23, 42]) .text(String); p.enter().append("p") // Enter… .text(String); p.exit().remove(); // Exit…
  7. SUBSELECTIONS SUBSELECTIONS generate a subselection by calling selectAll on an

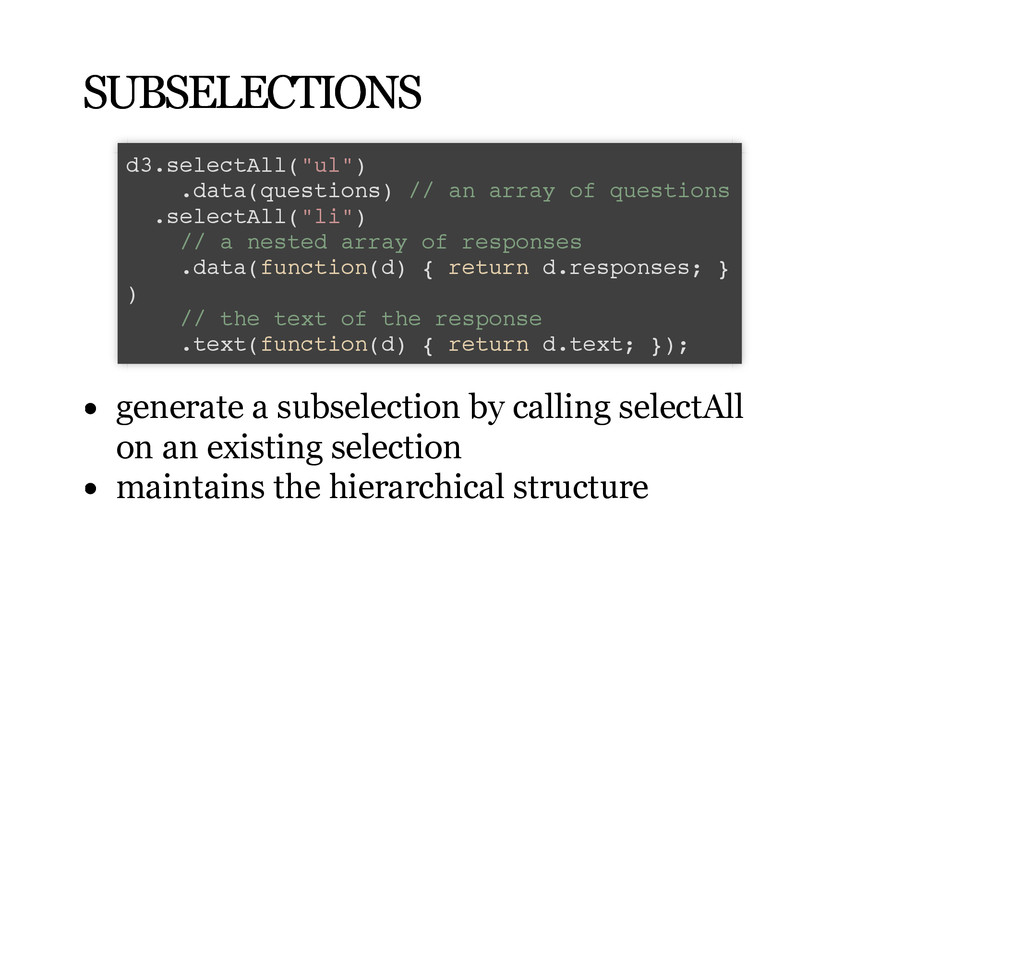
    existing selection maintains the hierarchical structure d3.selectAll("ul") .data(questions) // an array of questions .selectAll("li") // a nested array of responses .data(function(d) { return d.responses; } ) // the text of the response .text(function(d) { return d.text; });
  8. TRANSITIONS TRANSITIONS with d3.js they are easy! various tweening functions

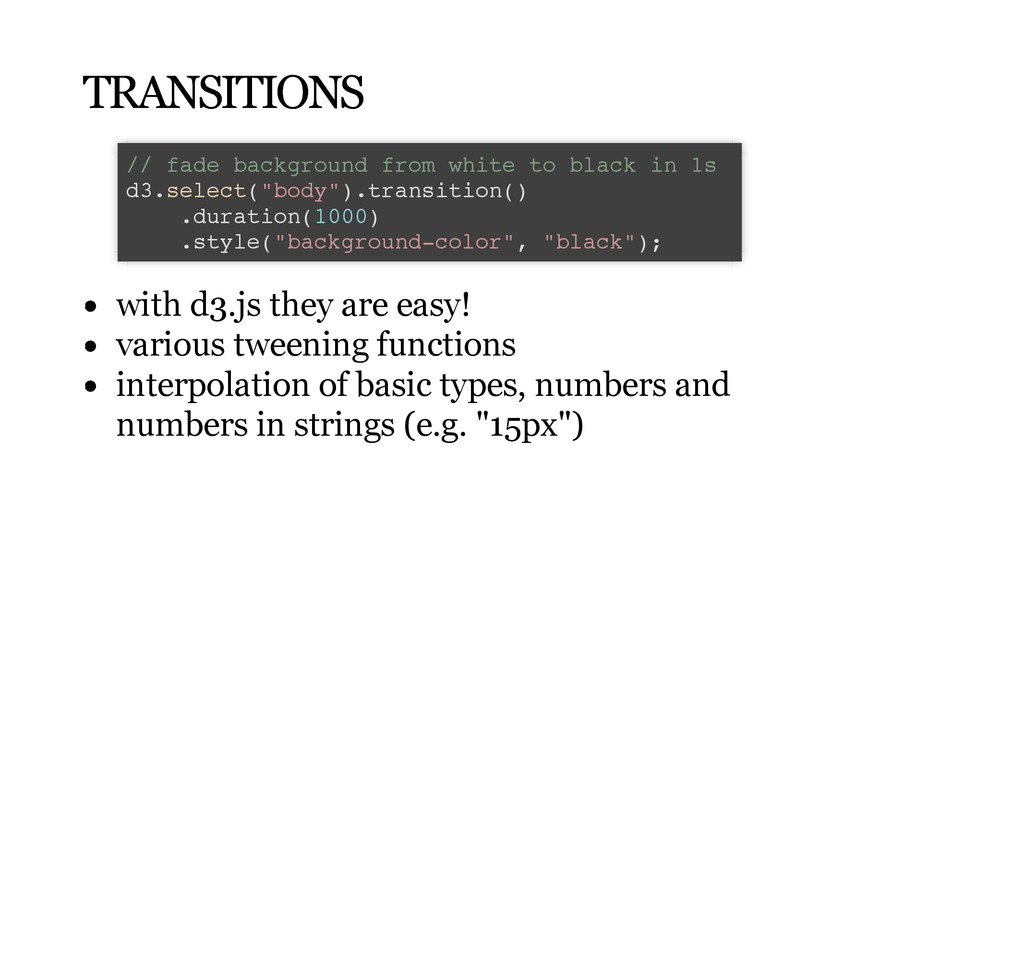
    interpolation of basic types, numbers and numbers in strings (e.g. "15px") // fade background from white to black in 1s d3.select("body").transition() .duration(1000) .style("background-color", "black");
  9. 0 0 5 5 10 10 15 15 20 20

    25 25 30 30 35 35 40 40 45 45 economy (mpg) economy (mpg) 3.0 3.0 3.5 3.5 4.0 4.0 4.5 4.5 5.0 5.0 5.5 5.5 6.0 6.0 6.5 6.5 7.0 7.0 7.5 7.5 8.0 8.0 cylinders cylinders 100 100 150 150 200 200 250 250 300 300 350 350 400 400 450 450 displacement (cc) displacement (cc)
  10. vis data Data DataList DataSprite EdgeSprite NodeSprite render ArrowType EdgeRenderer

    IRenderer ShapeRenderer ScaleBinding Tree TreeBuilder events DataEvent SelectionEvent TooltipEvent VisualizationEvent legend Legend LegendItem LegendRange operator distortion BifocalDistortion Distortion FisheyeDistortion encoder ColorEncoder Encoder PropertyEncoder ShapeEncoder SizeEncoder filter FisheyeTreeFilter G raphD istanceFilter VisibilityFilter IO perator label Labeler RadialLabeler StackedAreaLabeler layout AxisLayout BundledEdgeRouter CircleLayout CirclePackingLayout DendrogramLayout ForceDirectedLayout IcicleTreeLayout IndentedTreeLayout Layout NodeLinkTreeLayout PieLayout RadialTreeLayout RandomLayout StackedAreaLayout TreeMapLayout Operator OperatorList OperatorSequence
  11. util m ath palette ShapePalette SizePalette Property Shapes Sort Stats

    Strings axis Axes Axis AxisGridLine AxisLabel CartesianAxes controls AnchorControl ClickControl Control ControlList DragControl ExpandControl HoverControl IControl PanZoomControl SelectionControl TooltipControl Data DataList
  12. SIMPLE SHAPES SIMPLE SHAPES <circle cx="25" cy="25" r="22" class="pumpkin "/>

    .pumpkin { fill: red; stroke: orange; stroke-width: 5; }
  13. SIMPLE SHAPES SIMPLE SHAPES <rect x="100" y="100" width="80" height="80" fill="purple"/>

    <rect x="120" y="105" width="80" height="80" fill="blue"/> <rect x="140" y="110" width="80" height="80" fill="green"/> <rect x="160" y="115" width="80" height="80" fill="yellow"/> <rect x="180" y="120" width="80" height="80" fill="red"/>
  14. SIMPLE SHAPES SIMPLE SHAPES <circle cx="125" cy="80" r="60" fill="rgba(12 8,

    0, 128, 1.0)"/> <circle cx="150" cy="80" r="60" fill="rgba(0, 0, 805, 0.75)"/> <circle cx="175" cy="80" r="60" fill="rgba(0, 805, 0, 0.5)"/> <circle cx="200" cy="80" r="60" fill="rgba(80 5, 805, 0, 0.80)"/> <circle cx="280" cy="80" r="60" fill="rgba(80 5, 0, 0, 0.1)"/>
  15. PAGE PAGE <!DOCTYPE html> <html> <head> <meta charset="utf-8"> <title>D3 Test</title>

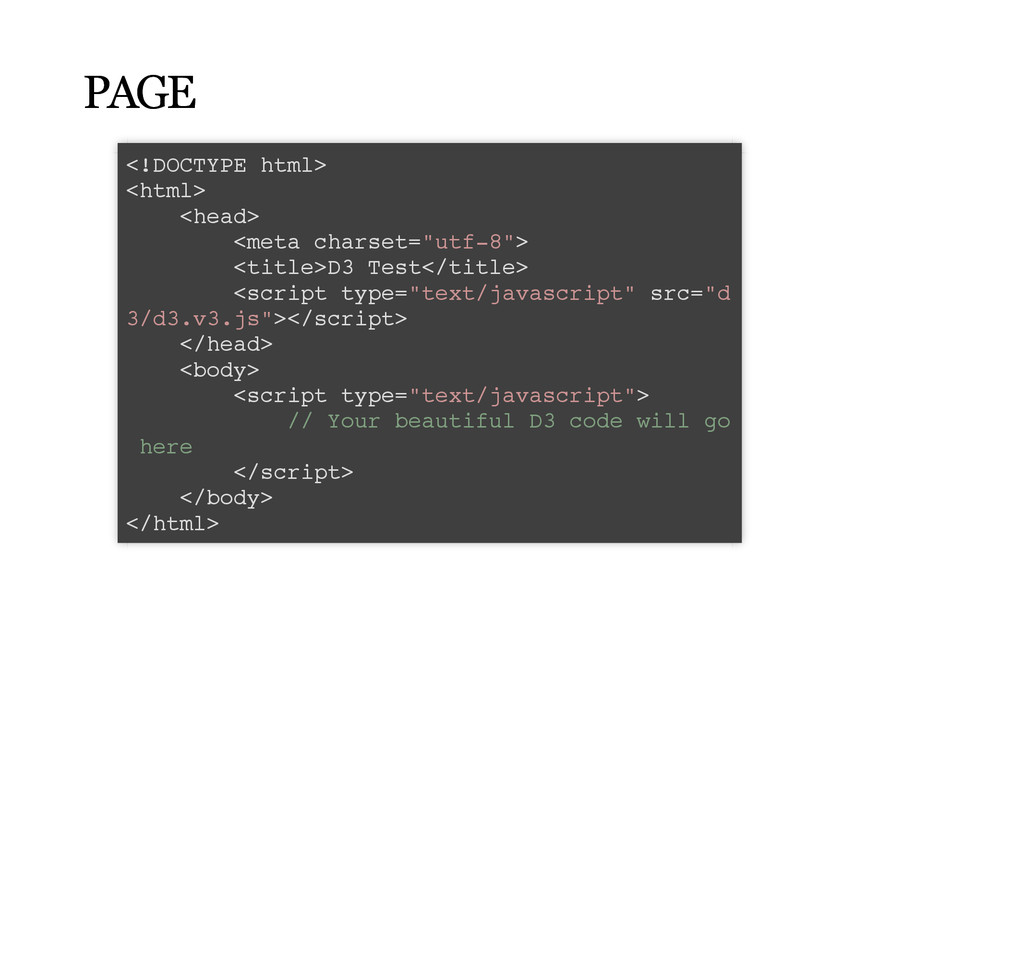
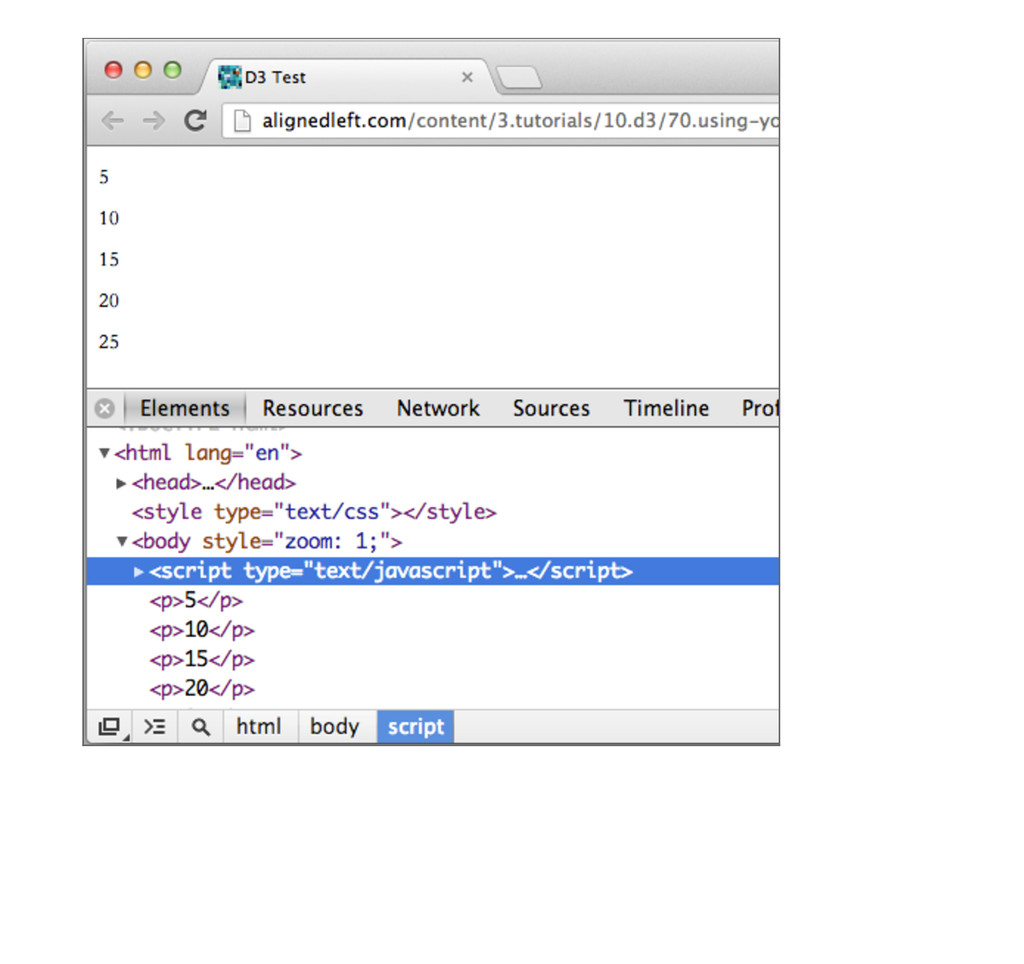
    <script type="text/javascript" src="d 3/d3.v3.js"></script> </head> <body> <script type="text/javascript"> // Your beautiful D3 code will go here </script> </body> </html>
  16. WITH DATA WITH DATA var dataset = [ 5, 10,

    15, 20, 25 ]; d3.select("body").selectAll("p");
  17. WITH DATA WITH DATA var dataset = [ 5, 10,

    15, 20, 25 ]; d3.select("body").selectAll("p") .data(dataset) .enter() .append("p") .text(function(d) { return d; });
  18. BEYOND TEXT BEYOND TEXT .style("color", "red"); .style("color", function(d) { if

    (d > 15) { //Threshold of 15 return "red"; } else { return "black"; } });
  19. PLAY WITH DATA PLAY WITH DATA var dataset = [

    25, 7, 5, 26, 11, 8, 25, 14, 23, 19, 14, 11, 22, 29, 11, 13, 12, 1 7, 18, 10, 24, 18, 25, 9, 3 ]; d3.select("body").selectAll("div") .data(dataset) // <-- The answer is here! .enter() .append("div") .attr("class", "bar") .style("height", function(d) { var barHeight = d * 5; return barHeight + "px"; });
  20. MAKING A BAR CHART MAKING A BAR CHART var dataset

    = [ 5, 10, 13, 19, 21, 25, 22, 18 , 15, 13, 11, 12, 15, 20, 18, 17, 16, 1 8, 23, 25 ];
  21. MAKING A BAR CHART MAKING A BAR CHART svg.selectAll("rect") .data(dataset)

    .enter() .append("rect") .attr("x", 0) .attr("y", 0) .attr("width", 20) .attr("height", 100);
  22. MAKING A BAR CHART MAKING A BAR CHART .attr("x", function(d,

    i) { return i * 21; //Bar width of 20 plus 1 f or padding })
  23. MAKING A BAR CHART MAKING A BAR CHART .attr("y", function(d)

    { return h - d; //Height minus data value }) .attr("height", function(d) { return d * 4; //Just the data value });
  24. MAKING A BAR CHART MAKING A BAR CHART .attr("fill", function(d)

    { return "rgb(0, 0, " + (d * 10) + ")"; });
  25. MAKING A BAR CHART MAKING A BAR CHART svg.selectAll("text") .data(dataset)

    .enter() .append("text") .text(function(d) { return d; }) .attr("text-anchor", "middle") .attr("x", function(d, i) { return i * (w / dataset.length) + (w / dataset.length - barPadding) / 2; }) .attr("y", function(d) { return h - (d * 4) + 14; }) .attr("font-family", "sans-serif") .attr("font-size", "11px") .attr("fill", "white");
  26. DATA DATA [{ "name": "Angola", "region": "Sub-Saharan Africa", "income": [

    [1800, 359.93], [1820, 359.93], [1913, 556.12], [1950, 3363.02], [1951, 3440.9], [1952, 3520.61], [1953, 3598.81], [1954, 3450.82], [1955, 3672.08], [1956, 3549.04],
  27. TRANSITION TRANSITION // Start a transition that interpolates the d

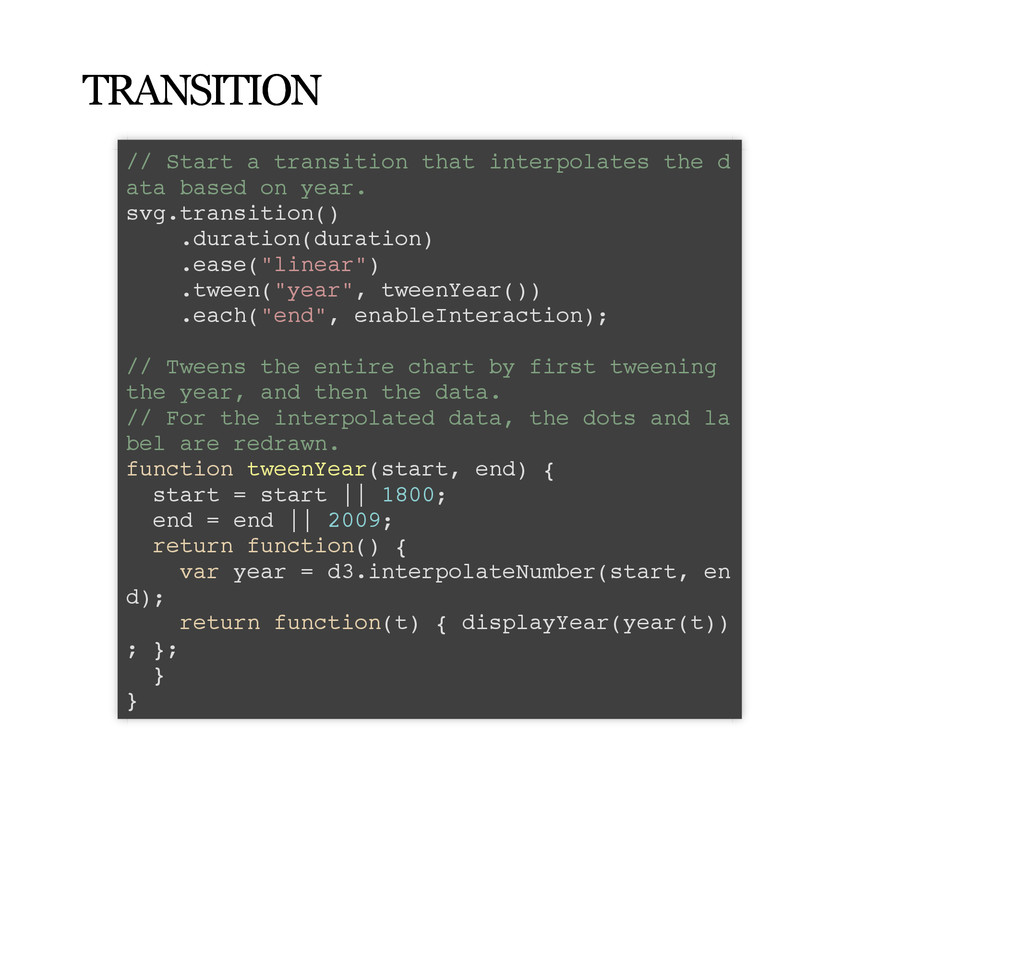
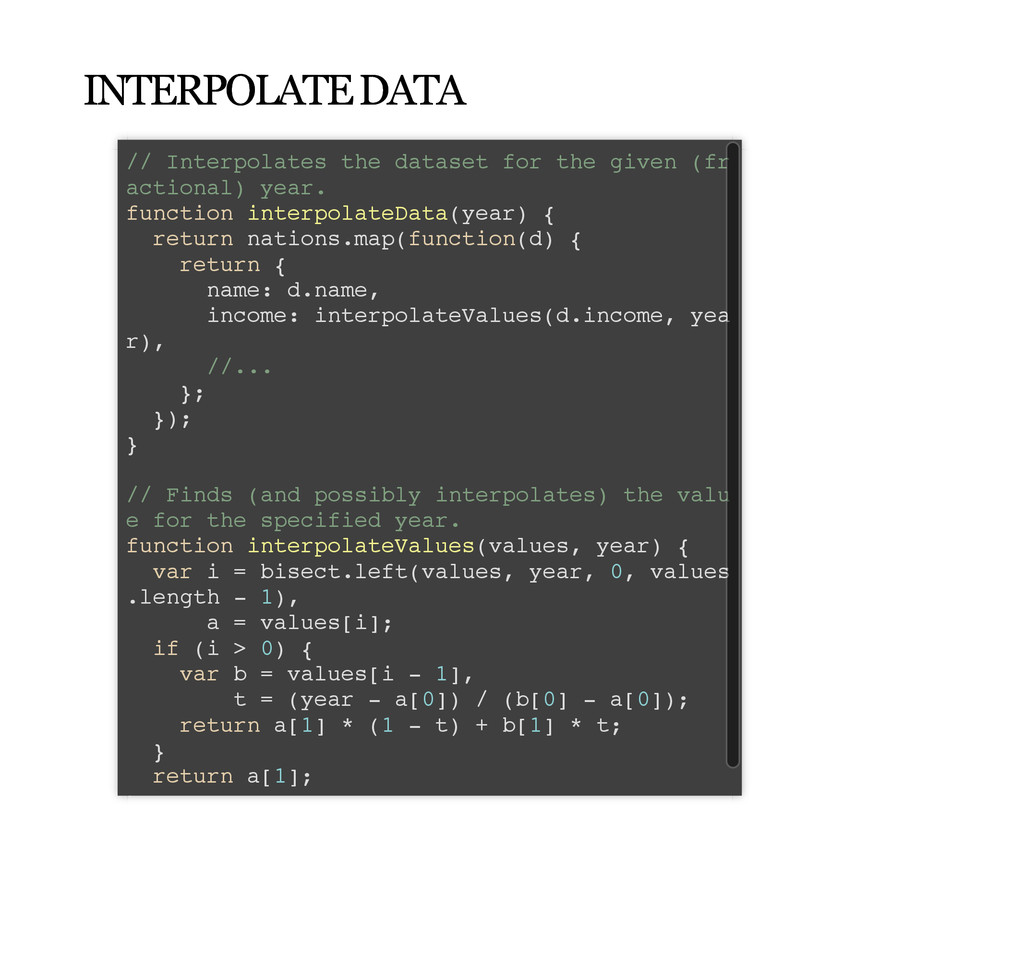
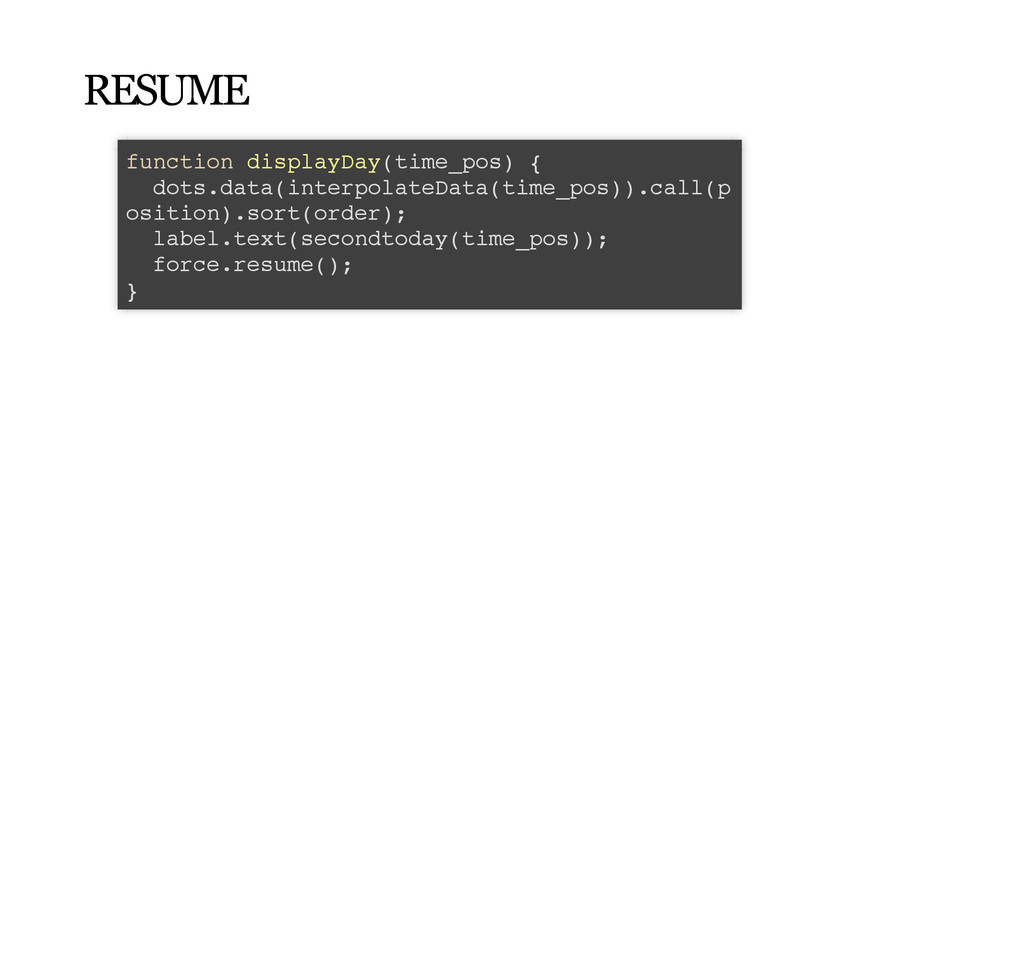
    ata based on year. svg.transition() .duration(duration) .ease("linear") .tween("year", tweenYear()) .each("end", enableInteraction); // Tweens the entire chart by first tweening the year, and then the data. // For the interpolated data, the dots and la bel are redrawn. function tweenYear(start, end) { start = start || 1800; end = end || 2009; return function() { var year = d3.interpolateNumber(start, en d); return function(t) { displayYear(year(t)) ; }; } }
  28. INTERPOLATE DATA INTERPOLATE DATA // Interpolates the dataset for the

    given (fr actional) year. function interpolateData(year) { return nations.map(function(d) { return { name: d.name, income: interpolateValues(d.income, yea r), //... }; }); } // Finds (and possibly interpolates) the valu e for the specified year. function interpolateValues(values, year) { var i = bisect.left(values, year, 0, values .length - 1), a = values[i]; if (i > 0) { var b = values[i - 1], t = (year - a[0]) / (b[0] - a[0]); return a[1] * (1 - t) + b[1] * t; } return a[1]; }
  29. DATA DATA "total": [ [1303115788, 2], [1303182050, 6], [1303194454, 18],

    [1303210228, 28], [1303267612, 40], //... ], "qwang": [ [1335869108, 0], [1335869108, 9], [1335869340, 2], [1335954367, 33], //...
  30. LAYOUT LAYOUT force = d3.layout.force() .gravity(.5) .charge(function(d, i){ return i

    ? 0 : -20; }) .nodes(users) .size([width, height]); force.start(); force.on("tick", function(e) { var q = d3.geom.quadtree(users), i = 0, n = users.length; while (++i < n) { q.visit(collide(users[i])); } dot.selectAll("g") .attr("transform", function(d) { return "translate(" + d.x + ", " + d.y + ")"} ); //... Update others elements });
  31. COLLISION COLLISION function collide(node) { var rr = r(node), nx1

    = node.x - rr, nx2 = node.x + rr, ny1 = node.y - rr, ny2 = node.y + rr; return function(quad, x1, y1, x2, y2) { if (quad.point && (quad.point !== node)) { var x = node.x - quad.point.x, y = node.y - quad.point.y, l = Math.sqrt(x * x + y * y), rr = r(node) + r(quad.point); if (l < rr) { l = (l - rr) / l * .5; node.x -= x *= l; node.y -= y *= l; quad.point.x += x; quad.point.y += y; } } return x1 > nx2 || x2 < nx1 || y1 > ny2 || y2 < ny1; }; }
  32. RESOURCES RESOURCES D3js Wiki Paper:D3: Data-Driven Documents Mike Bostock Visual.ly

    David McCandless: The beauty of data visualization GapMinder - for a fact-based world view