Upgrade to Pro
— share decks privately, control downloads, hide ads and more …
Speaker Deck
Features
Speaker Deck
PRO
Sign in
Sign up for free
Search
Search
The Introduction of Data Visualization
Search
Sponsored
·
Ship Features Fearlessly
Turn features on and off without deploys. Used by thousands of Ruby developers.
→
Dreampuf
September 21, 2012
Technology
380
1
Share
Embed
Copy iframe code
Copy JS code
Copy link
Start on current slide
The Introduction of Data Visualization
This slide is talk about the data visualization
Dreampuf
September 21, 2012
More Decks by Dreampuf
See All by Dreampuf
Python Magic Methods
dreampuf
6
480
D3Js
dreampuf
2
210
Pythonic
dreampuf
34
2.5k
PythonProfiling.pdf
dreampuf
4
210
Other Decks in Technology
See All in Technology
AIレビューはどこまで任せられるのか?自動化と人が背負うレビューの境界
sansantech
PRO
3
870
Gen3R: 3D Scene Generation Meets Feed-Forward Reconstruction
spatial_ai_network
0
130
Type-safe IaC for Dart
coborinai
0
110
アカウントが増えてからでは遅い? ~ マルチアカウント統制の勘所 ~
kenichinakamura
0
230
Claude Code公式skillで 自分の仕事を少しずつ手放そう!(Claude Code開発ノウハウ大公開スペシャル by クラスメソッド)
kaym
1
350
10年目を迎えた「ABEMA」がどのように AI 活用を推進して、AI 駆動開発にシフトしているのか / How ABEMA, entering its 10th year, is promoting the use of AI and shifting toward AI-driven development
miyukki
0
150
壊して学ぶAWS CDK: そのcdk deployで消えるもの、残るもの
k_adachi_01
0
180
「早く出す」より「事業に効く」 ── 顧客の業務サイクルから逆算するAI時代の二重ループ開発と「変化の設計者」 / devsumi2026
rakus_dev
1
260
CSに"SLO"は要らない、経営層に"99.9%"は伝わらない - SREを全社に"翻訳"する3原則
cscengineer
PRO
1
4.6k
美しいコードを書くためにF#を学んでみた話
yud0uhu
1
420
Alphaモジュール使っていいのかい!?いけないのかい!?どっちなんだいっ!?
watany
1
160
Making sense of Google’s agentic dev tools
glaforge
1
210
Featured
See All Featured
Music & Morning Musume
bryan
47
7.3k
KATA
mclloyd
PRO
35
15k
コードの90%をAIが書く世界で何が待っているのか / What awaits us in a world where 90% of the code is written by AI
rkaga
62
44k
Creating an realtime collaboration tool: Agile Flush - .NET Oxford
marcduiker
35
2.5k
Collaborative Software Design: How to facilitate domain modelling decisions
baasie
1
260
Thoughts on Productivity
jonyablonski
76
5.2k
Why Mistakes Are the Best Teachers: Turning Failure into a Pathway for Growth
auna
0
180
Unsuck your backbone
ammeep
672
58k
Testing 201, or: Great Expectations
jmmastey
46
8.2k
The untapped power of vector embeddings
frankvandijk
2
1.8k
The SEO Collaboration Effect
kristinabergwall1
1
500
The Straight Up "How To Draw Better" Workshop
denniskardys
239
140k
Transcript
The Introduction of Data Visualization Dreampuf Aug, 2012
Agenda •数据可视化 •可视化实例 •颜色搭配 •目前工作
None
None
None
None
None
None
None
数据可视化 “利用图形、图像处理、计算机视觉以及用户界面,通过 表达、建模以及对立体、表面、属性以及动画的显示, 对数据加以可视化解释。” Paul Reilly, S. P. Q. Rahtz
(eds.) 1992. Archaeology and the Information Age: A Global Perspective. p.92.
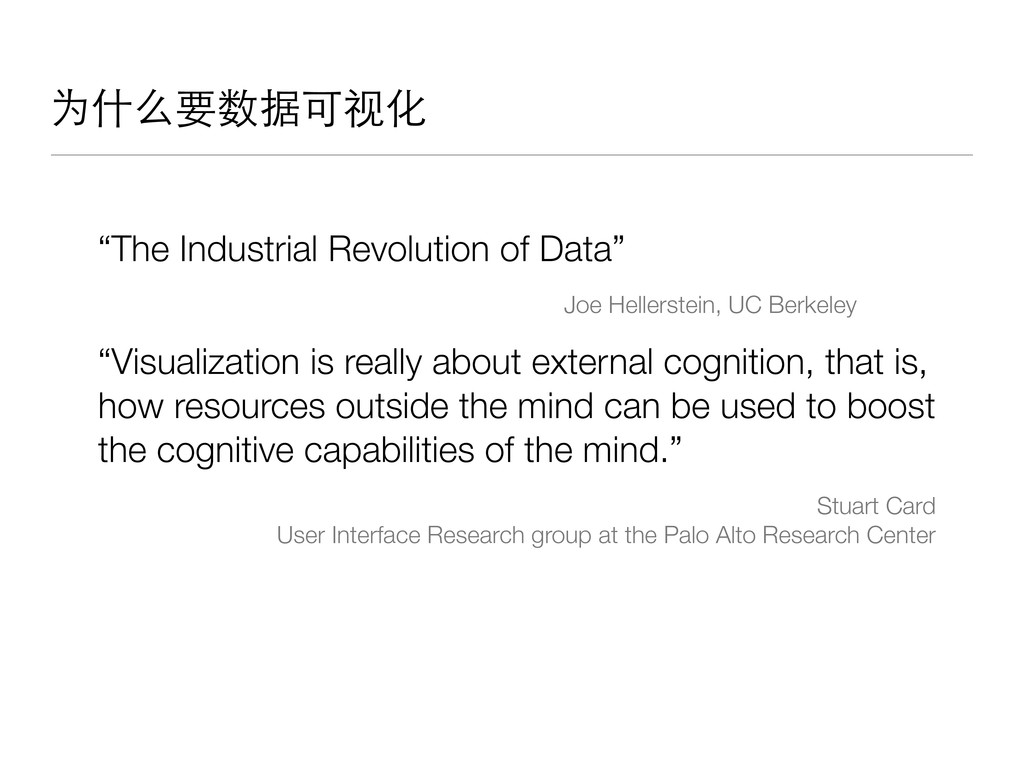
为什么要数据可视化 “The Industrial Revolution of Data” Joe Hellerstein, UC Berkeley
“Visualization is really about external cognition, that is, how resources outside the mind can be used to boost the cognitive capabilities of the mind.” Stuart Card User Interface Research group at the Palo Alto Research Center
为什么要数据可视化 •帮助思考 •感性表达 •增强认知 •用户交互
数据可视化领域划分 •信息可视化 •科学可视化 •可视分析 •交互界面
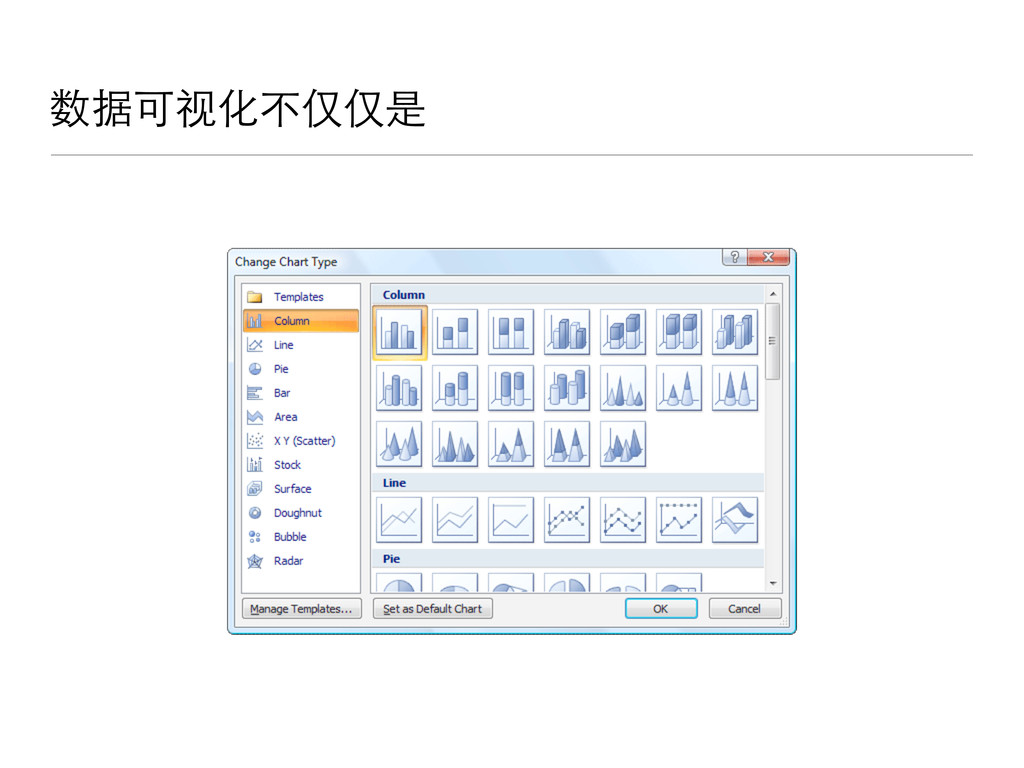
数据可视化不仅仅是
None
None
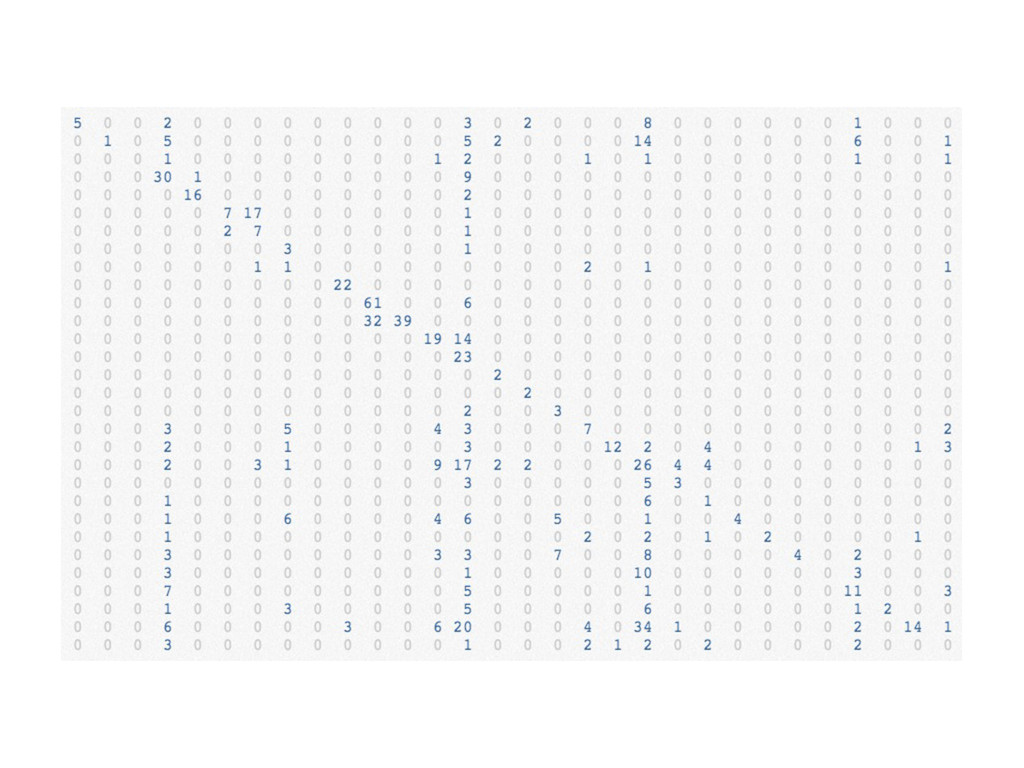
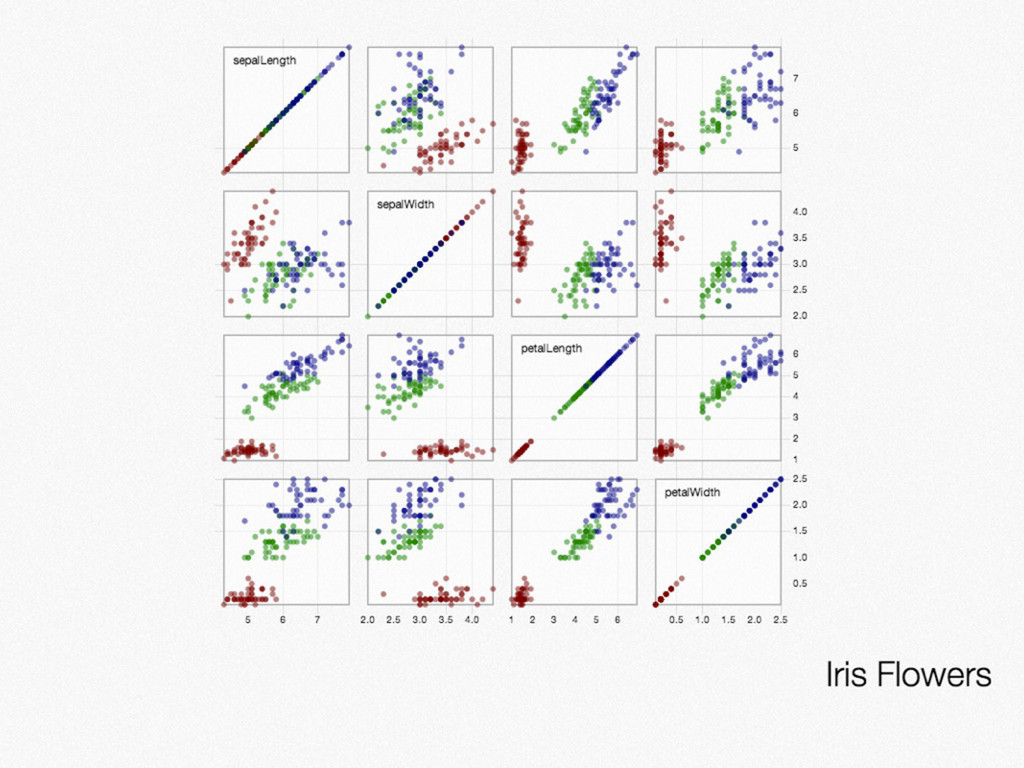
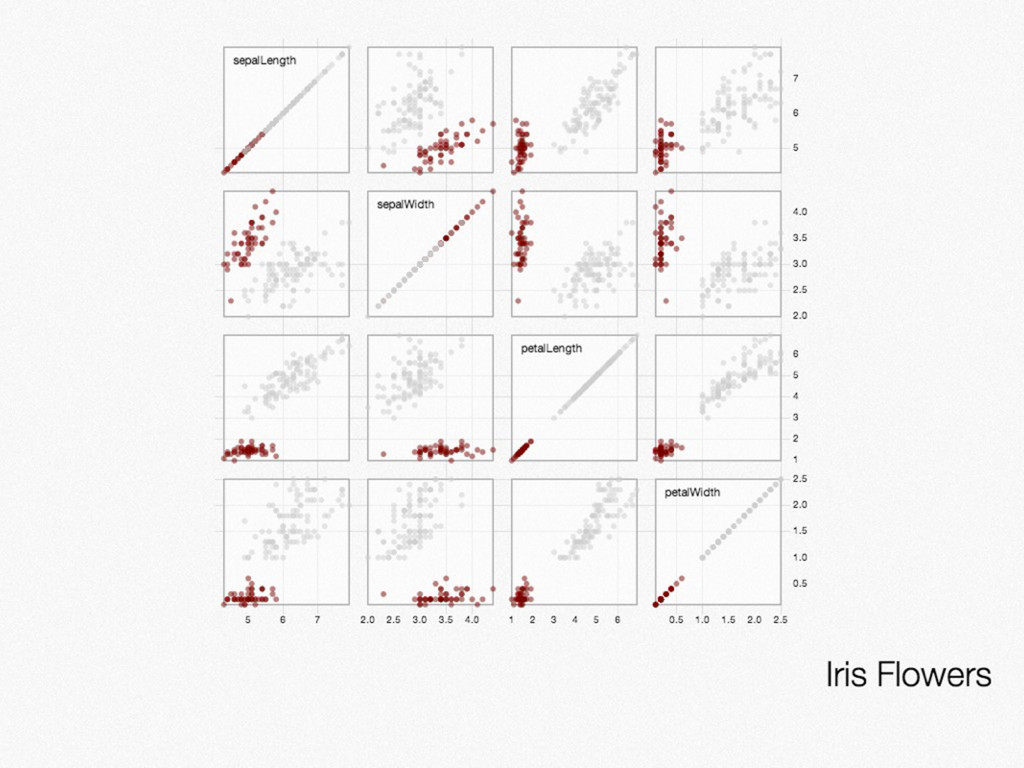
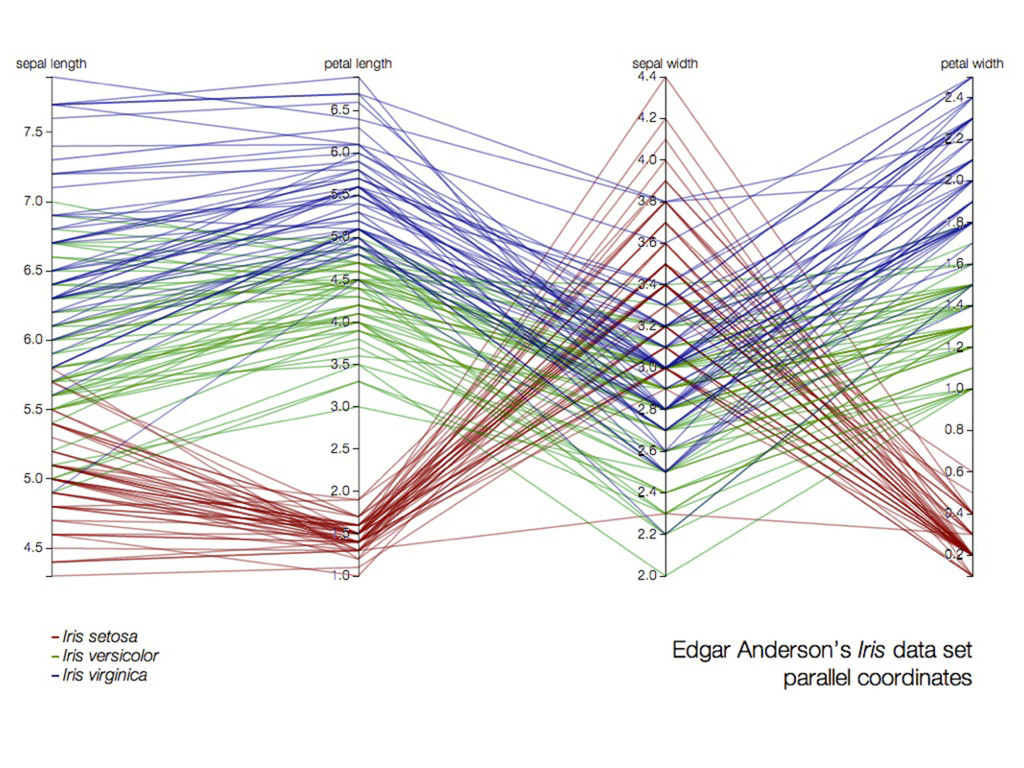
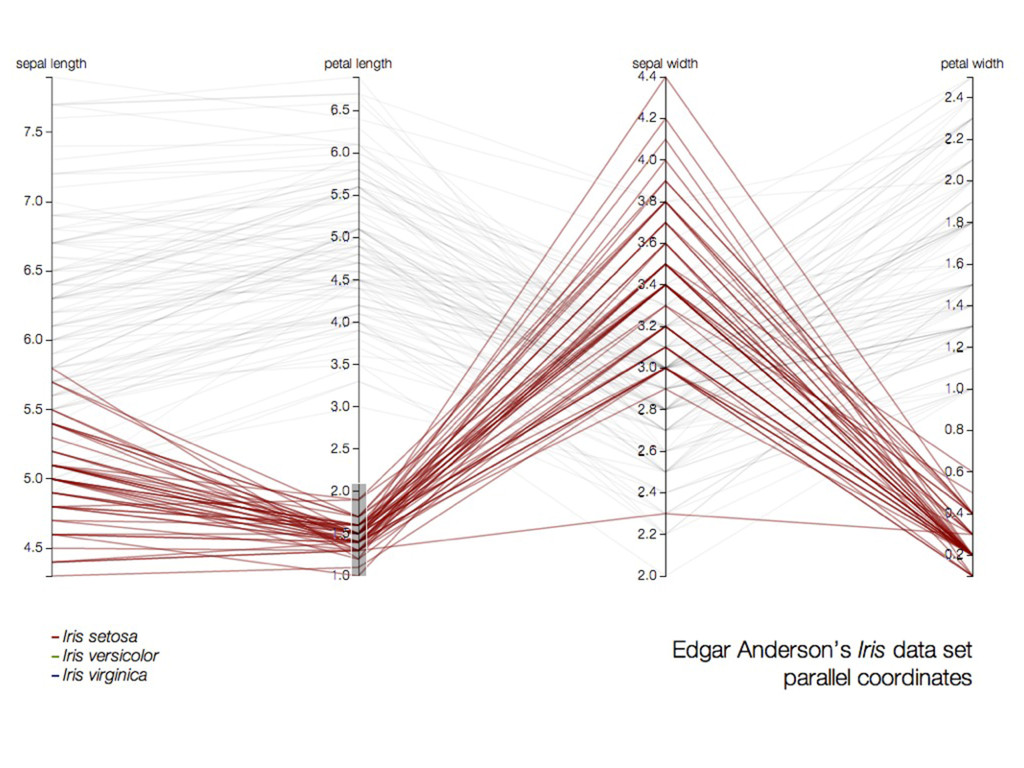
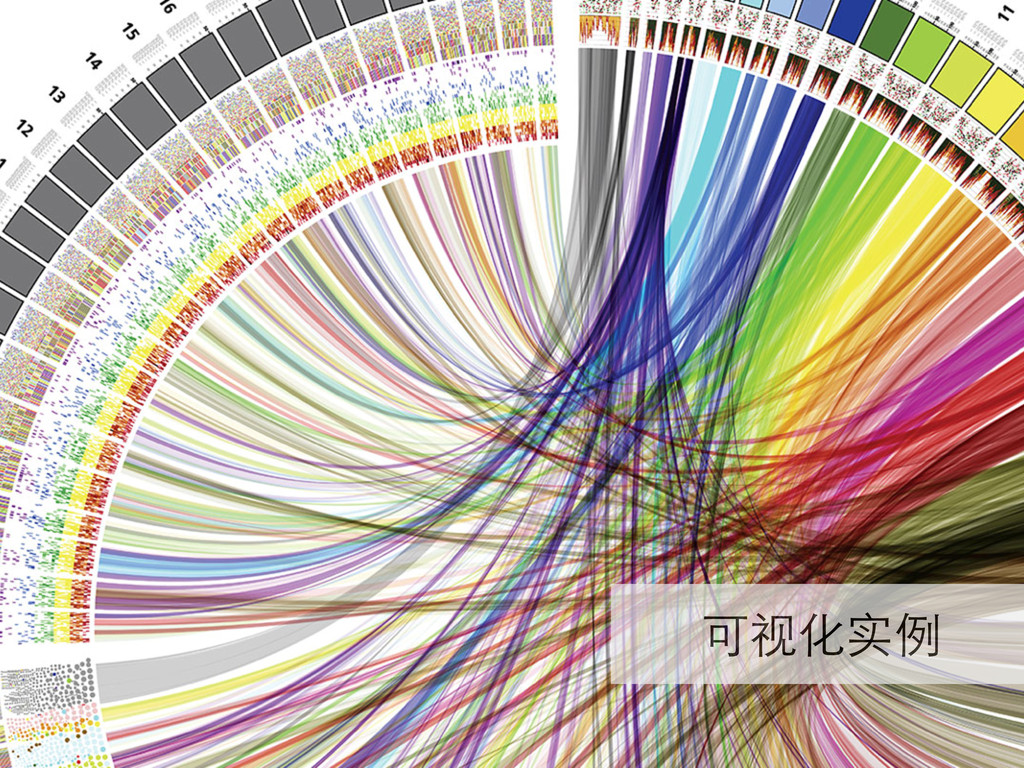
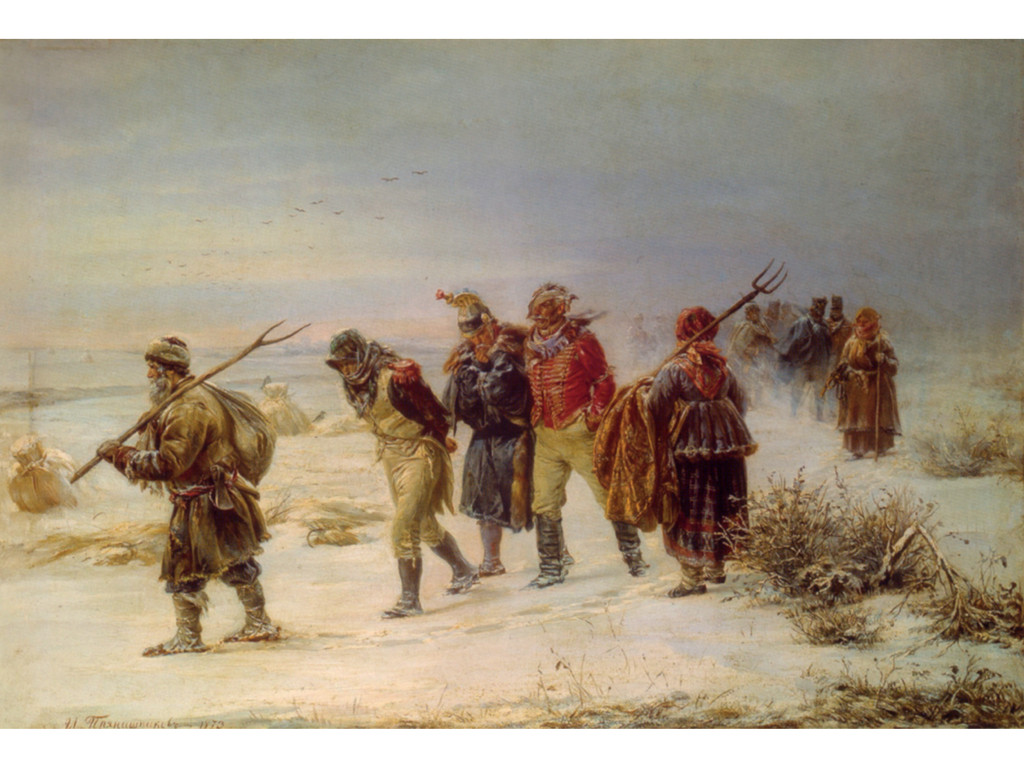
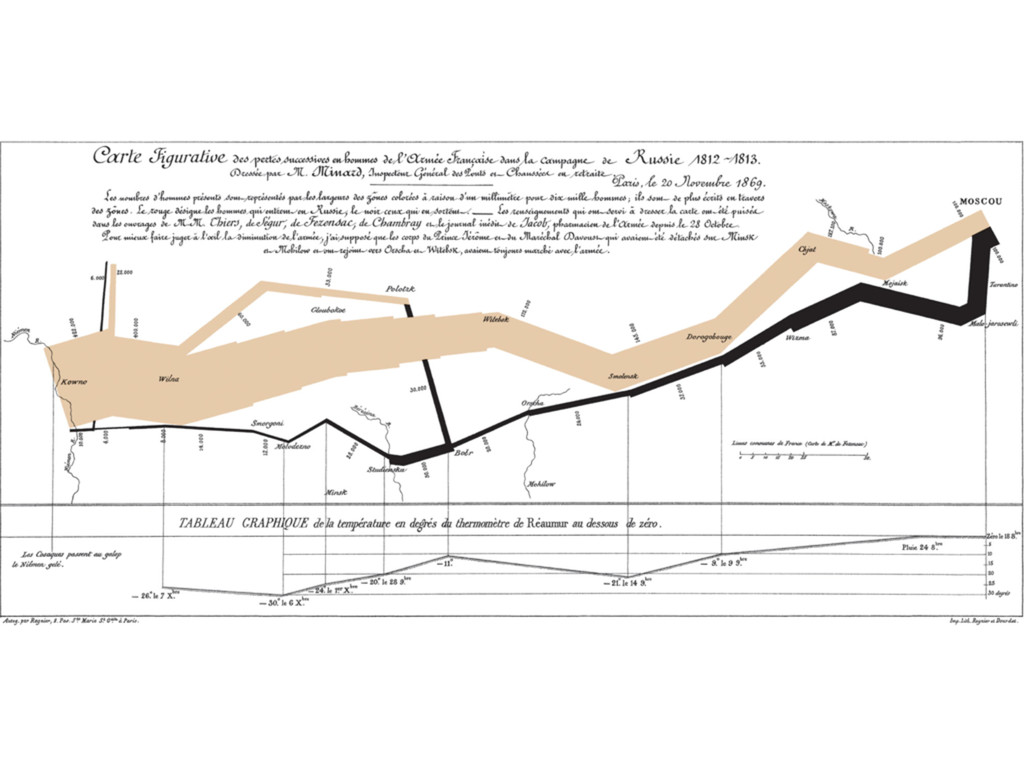
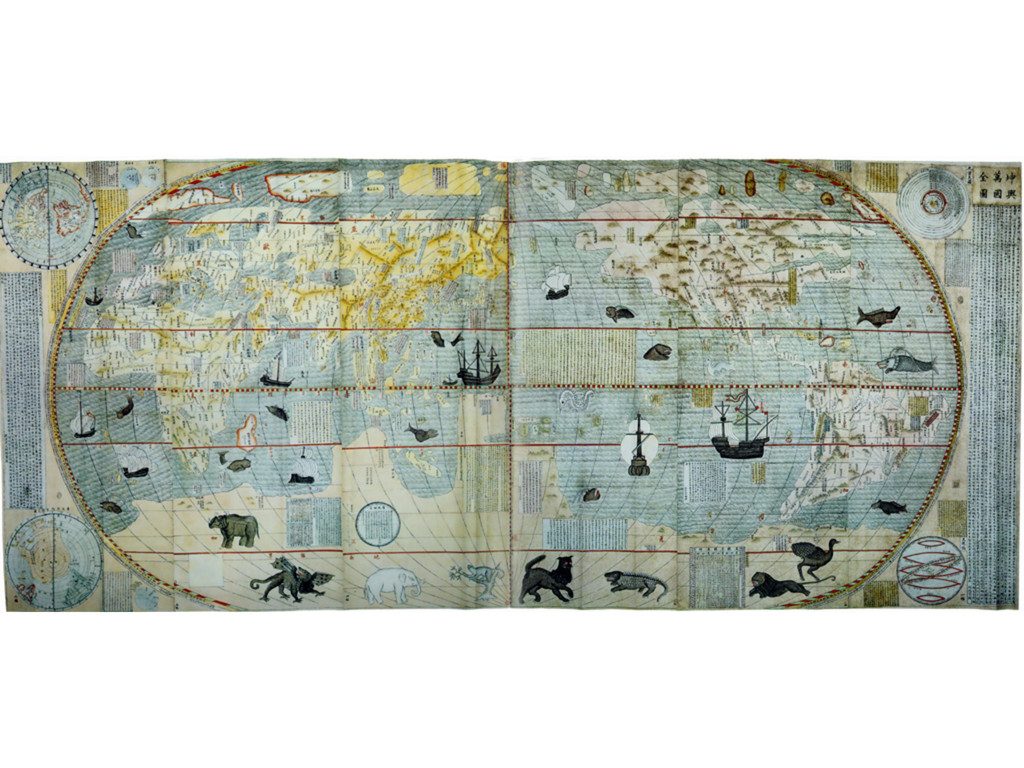
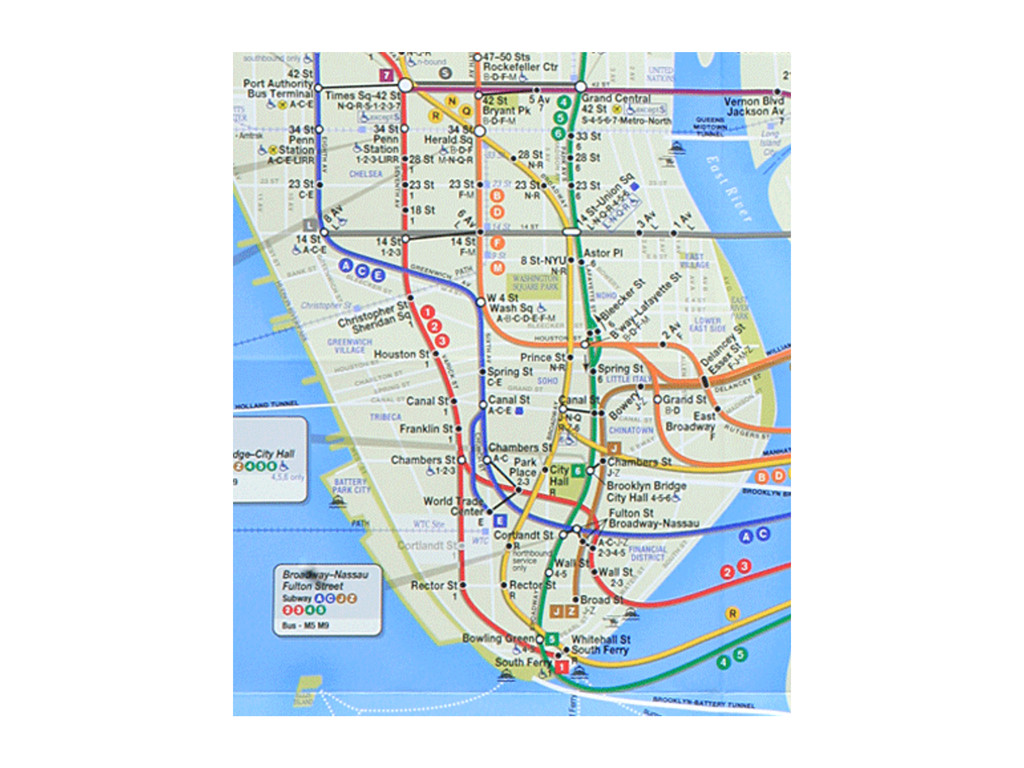
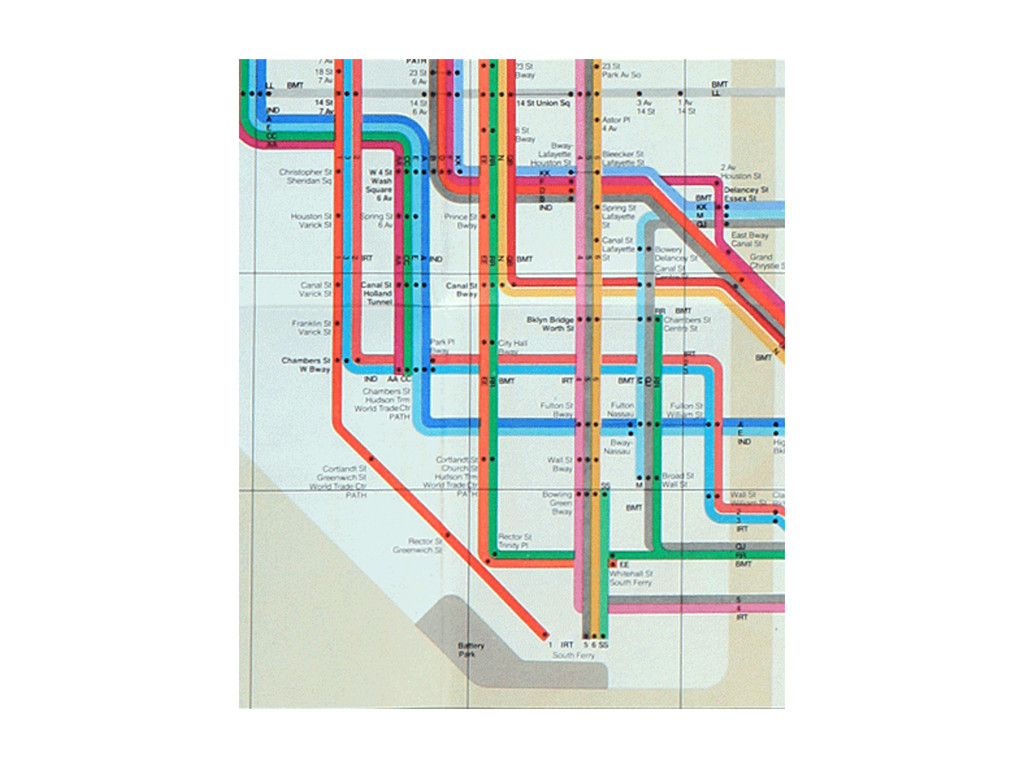
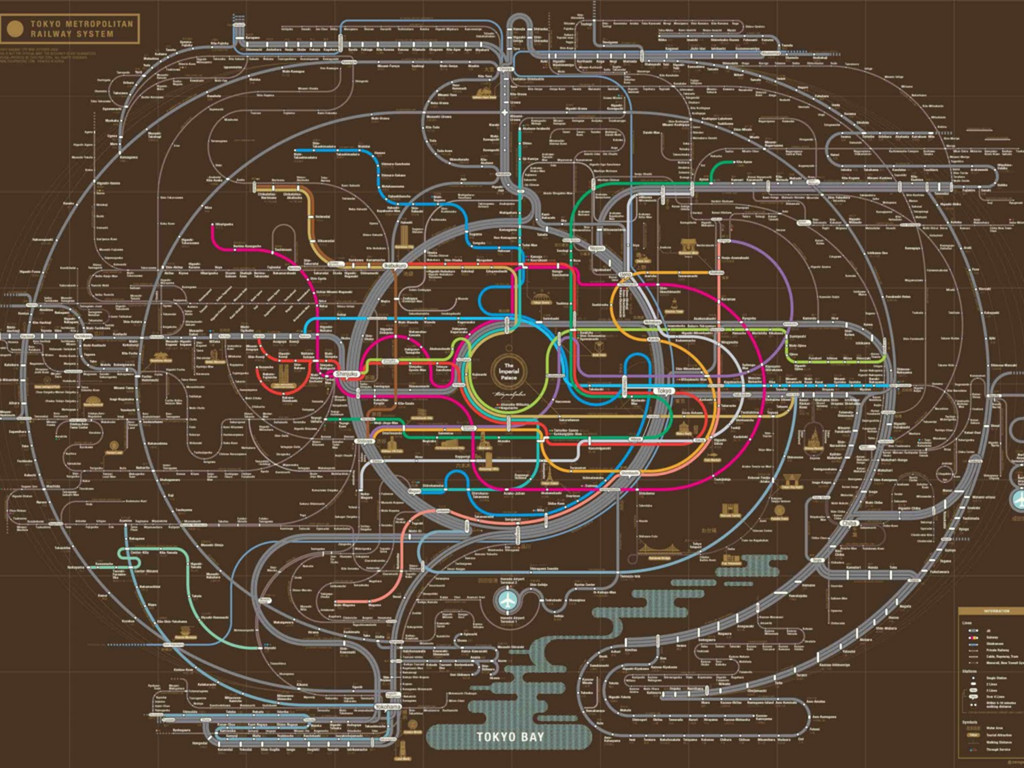
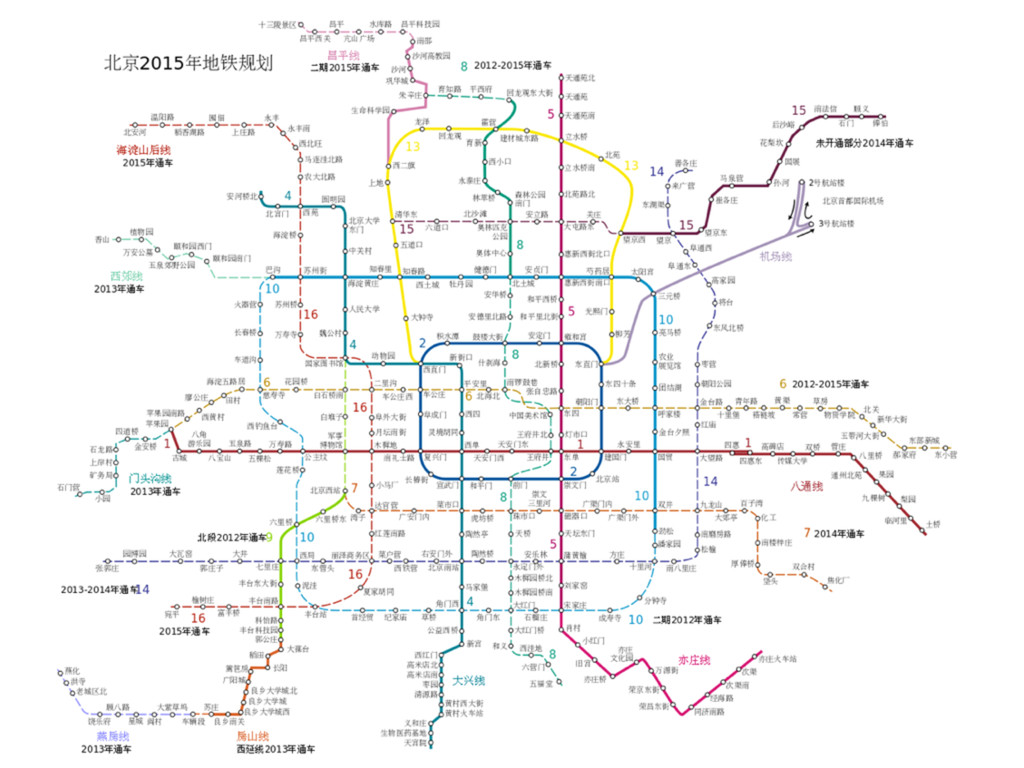
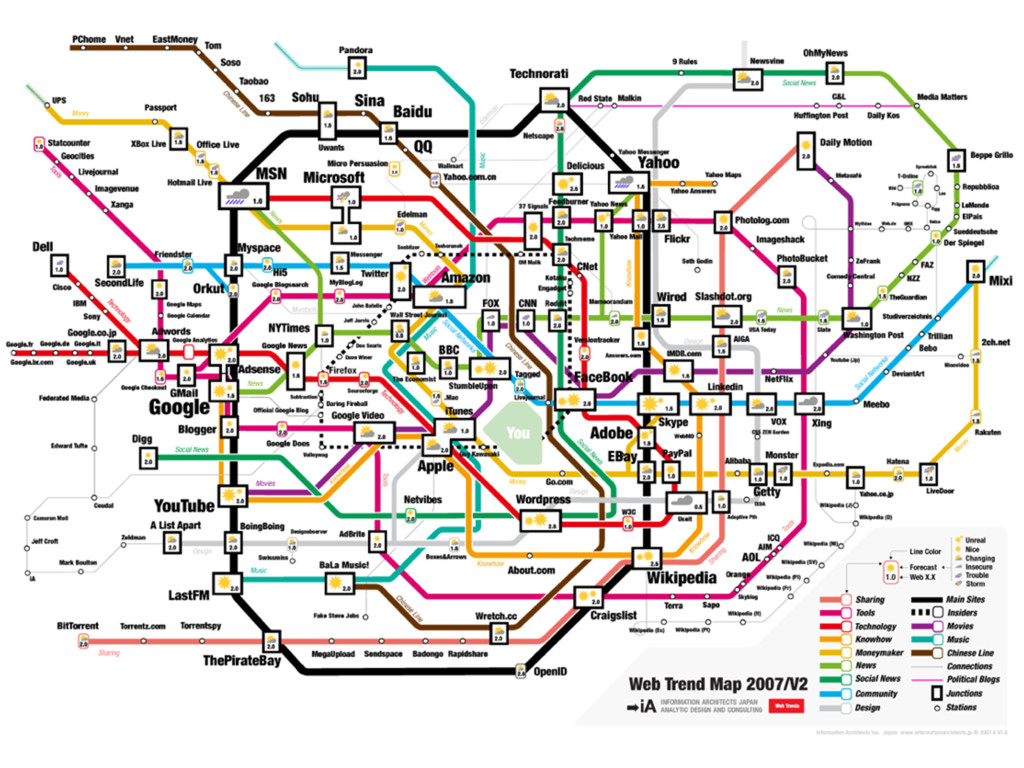
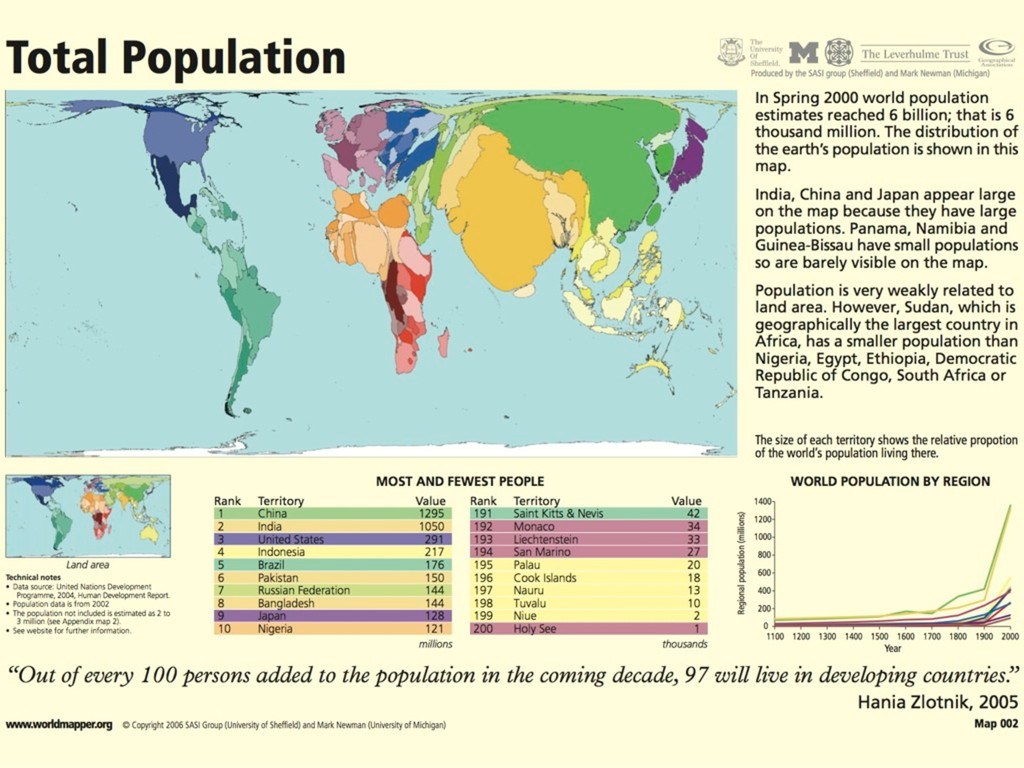
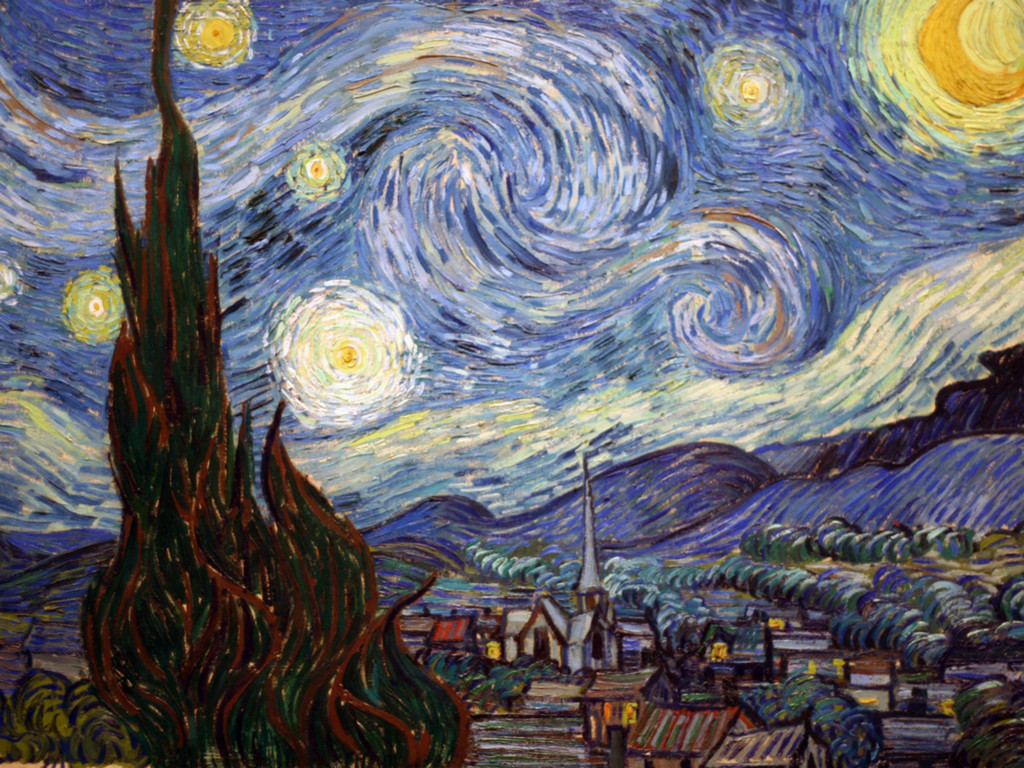
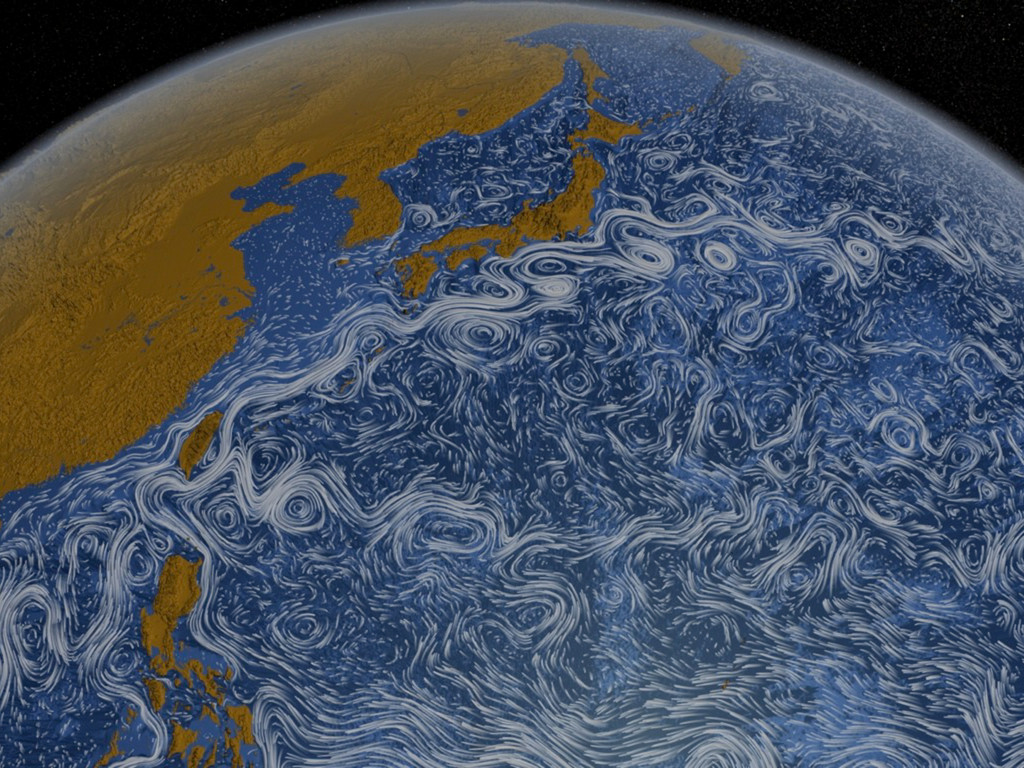
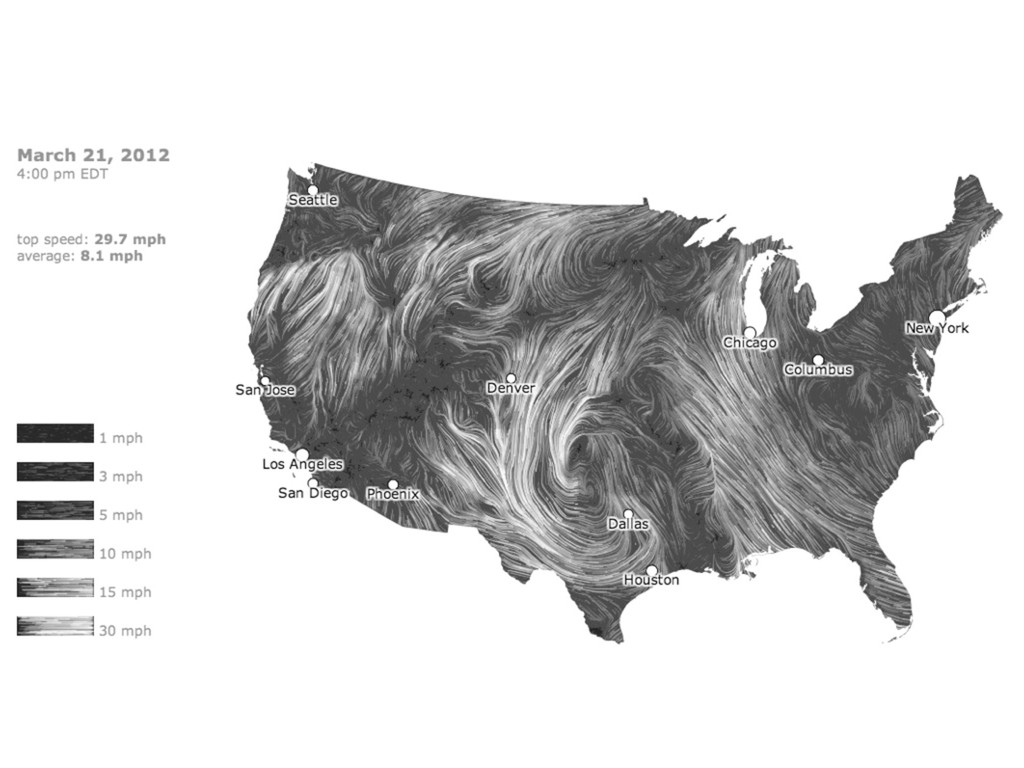
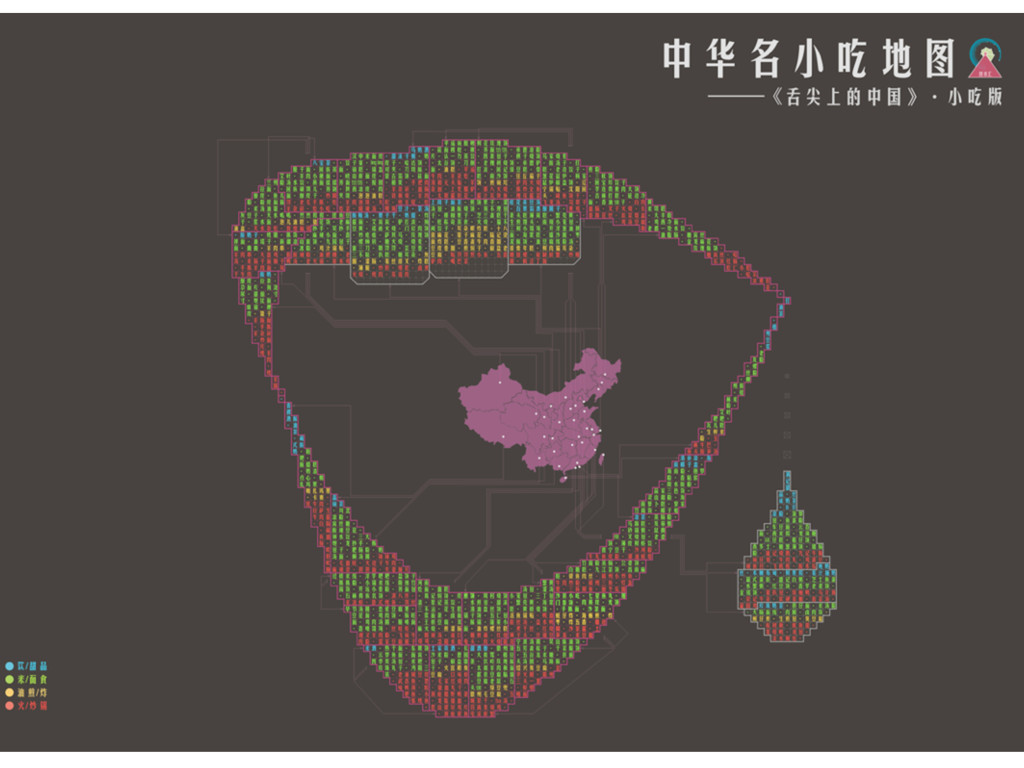
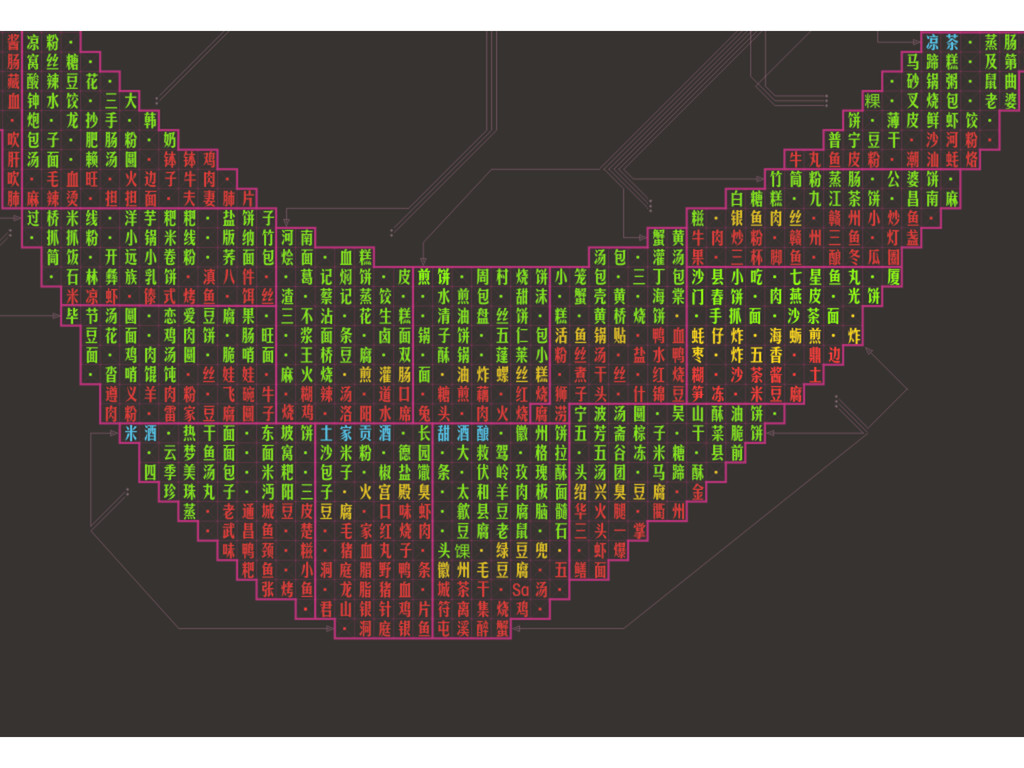
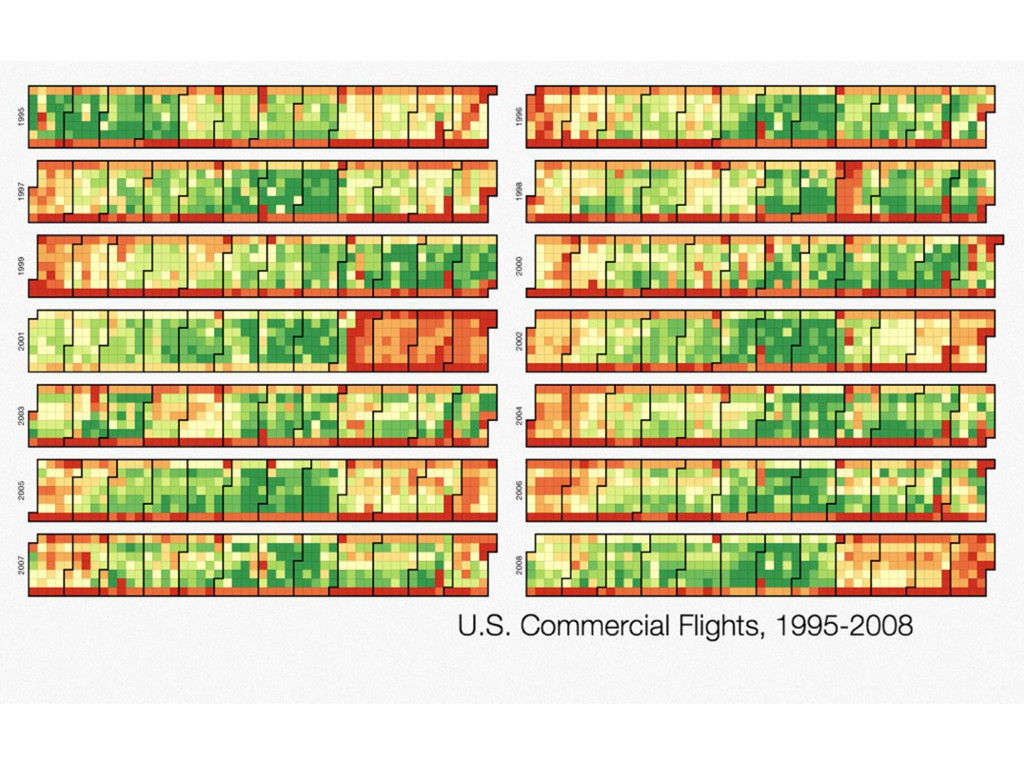
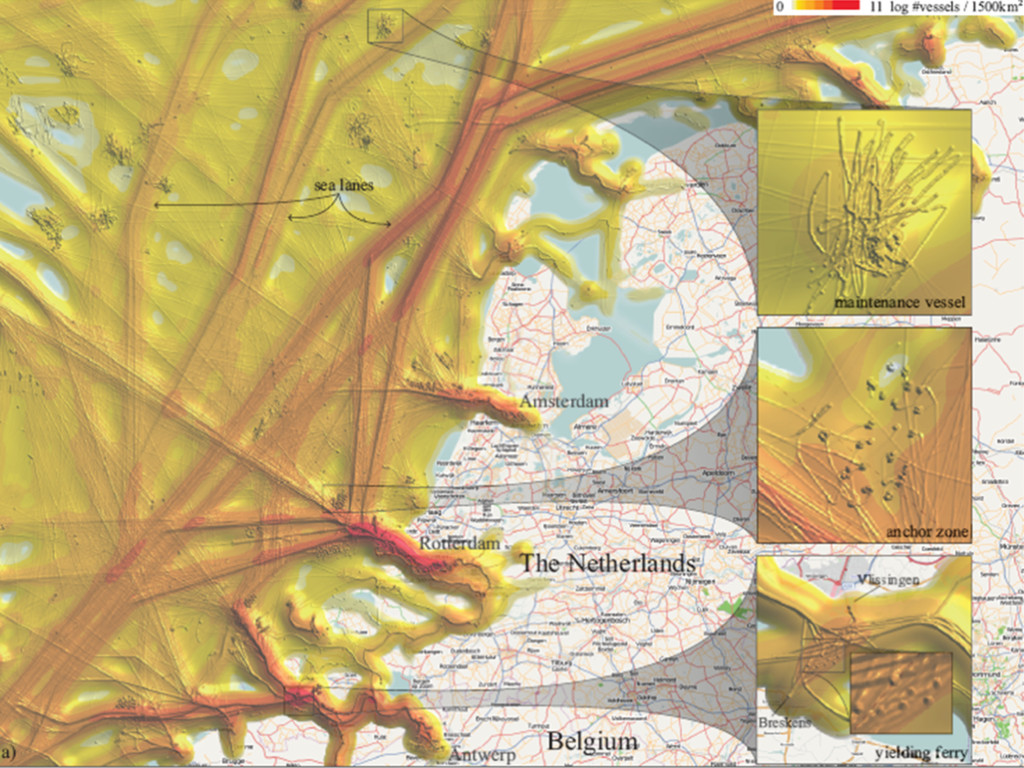
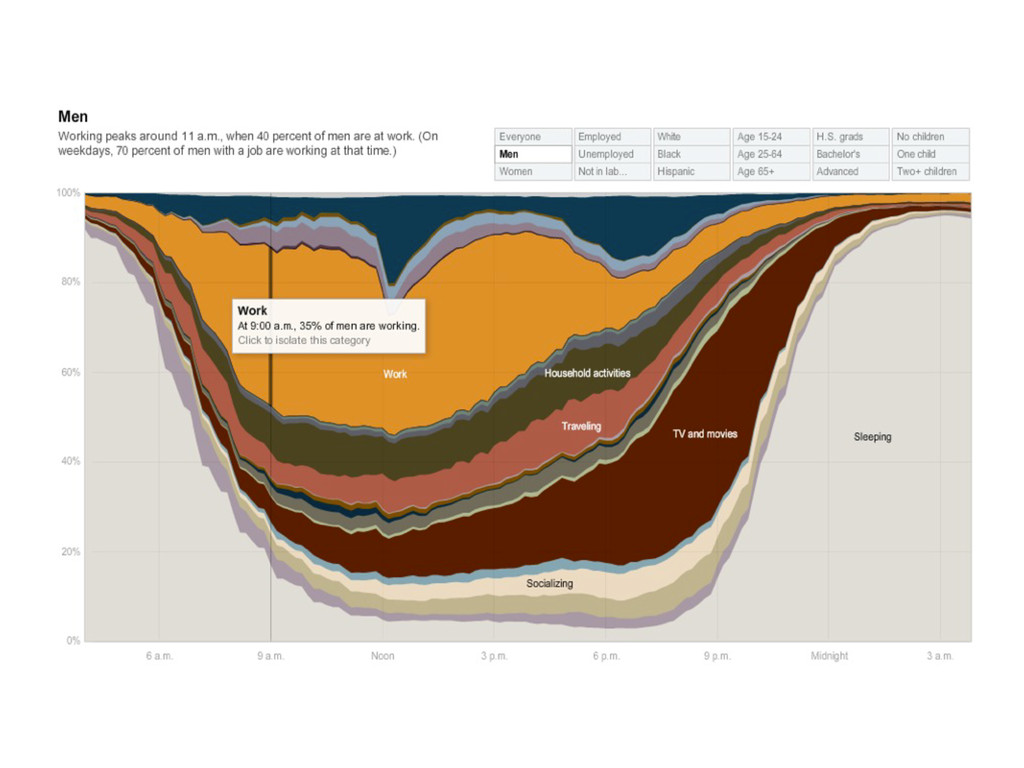
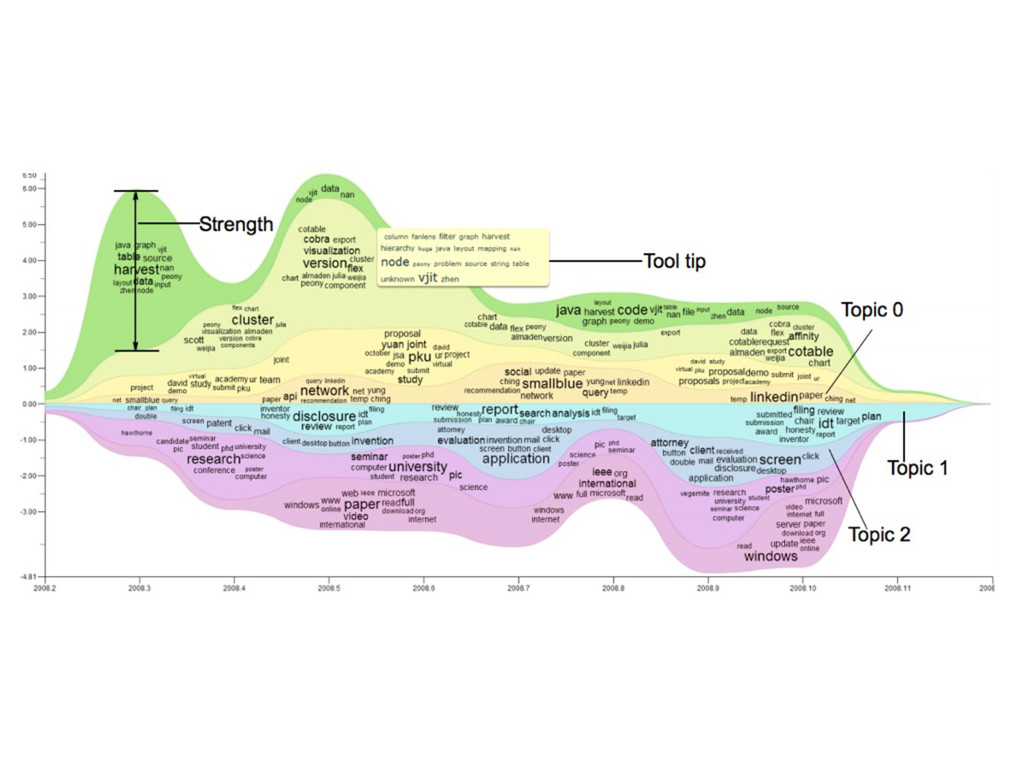
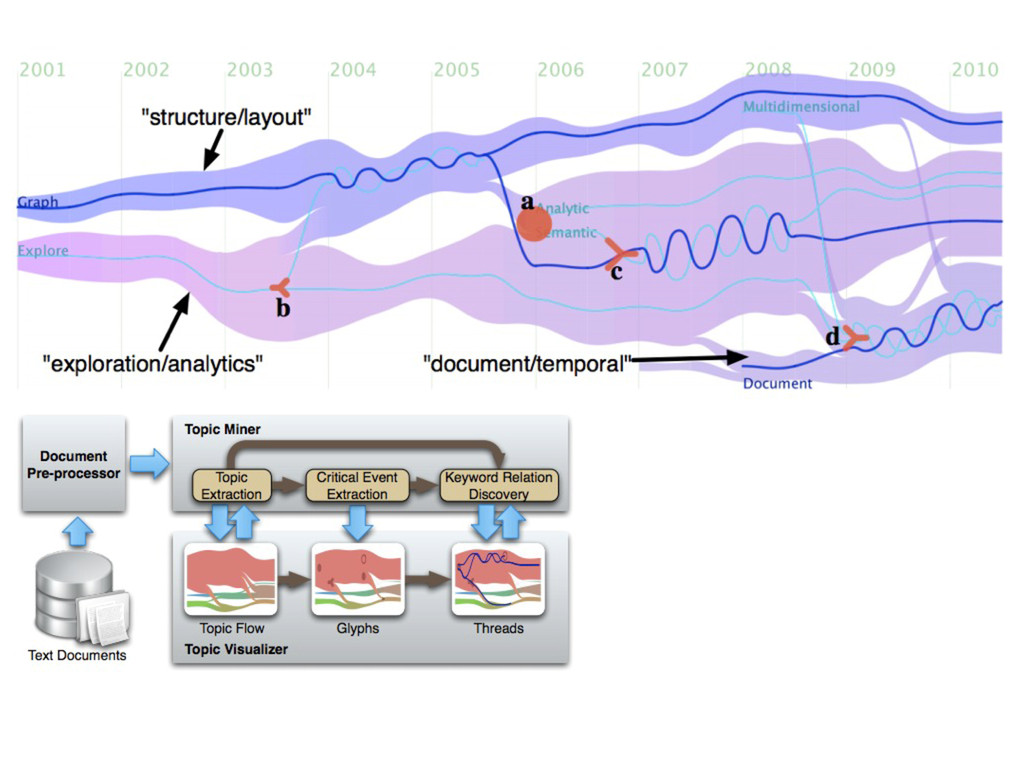
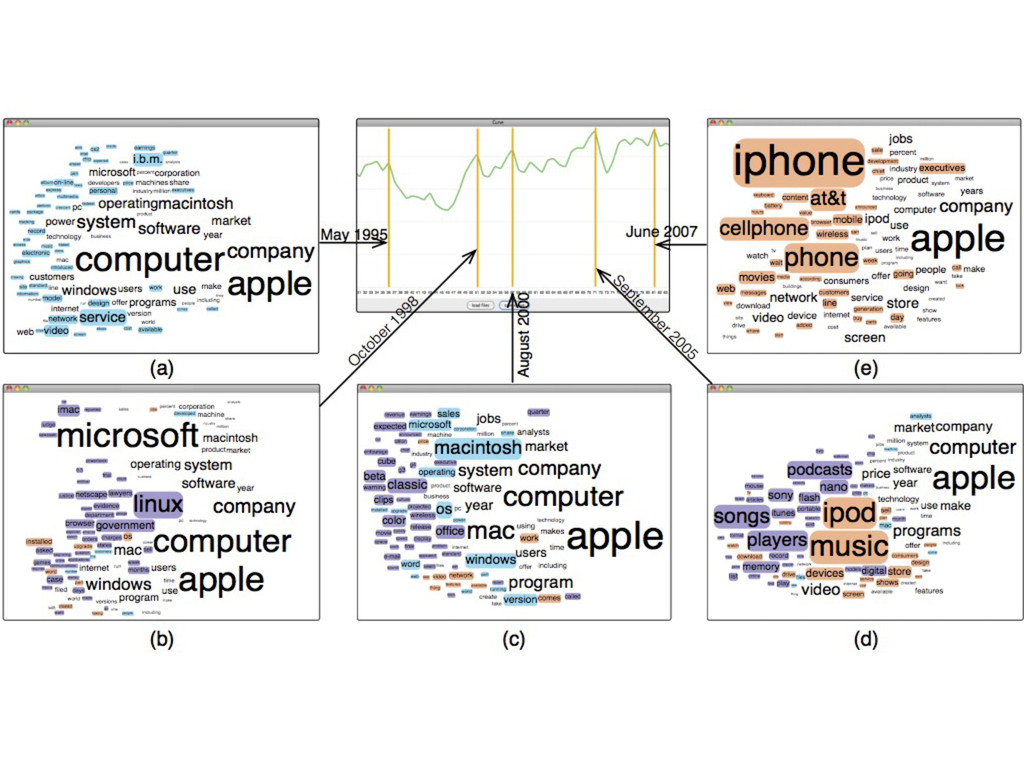
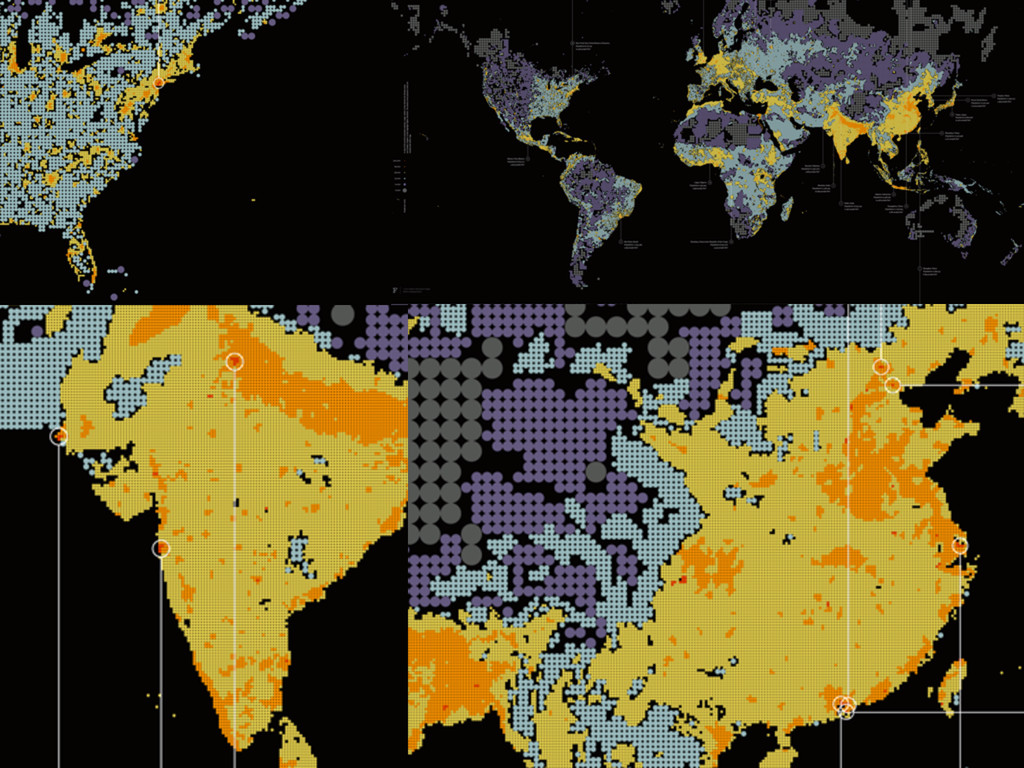
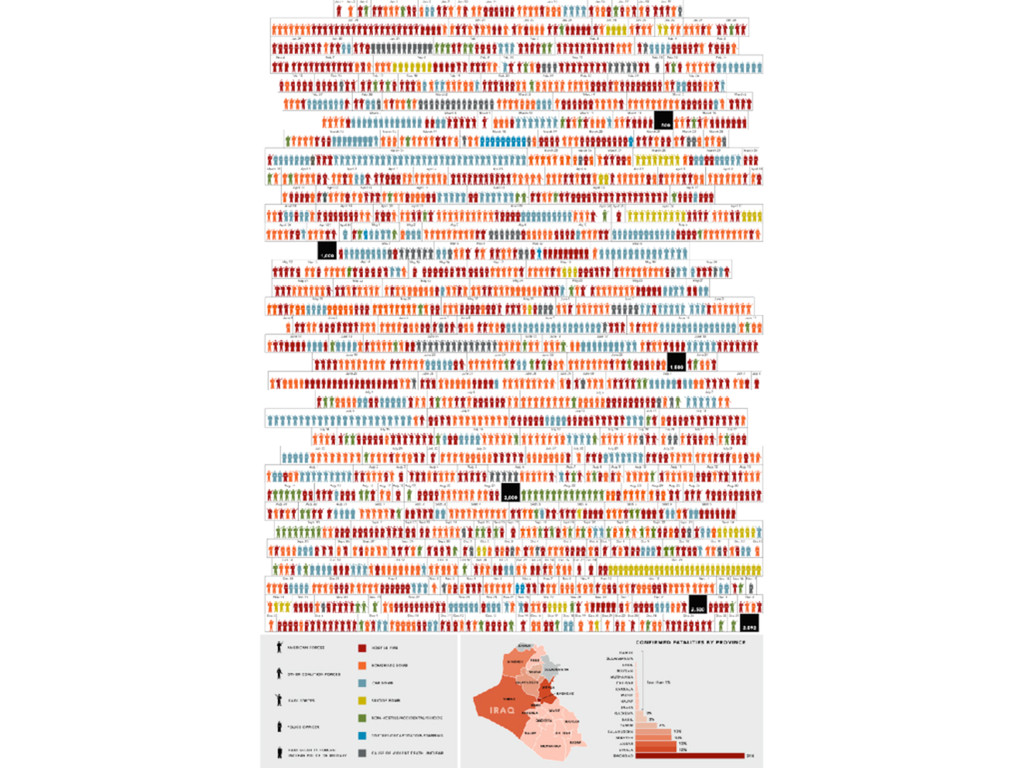
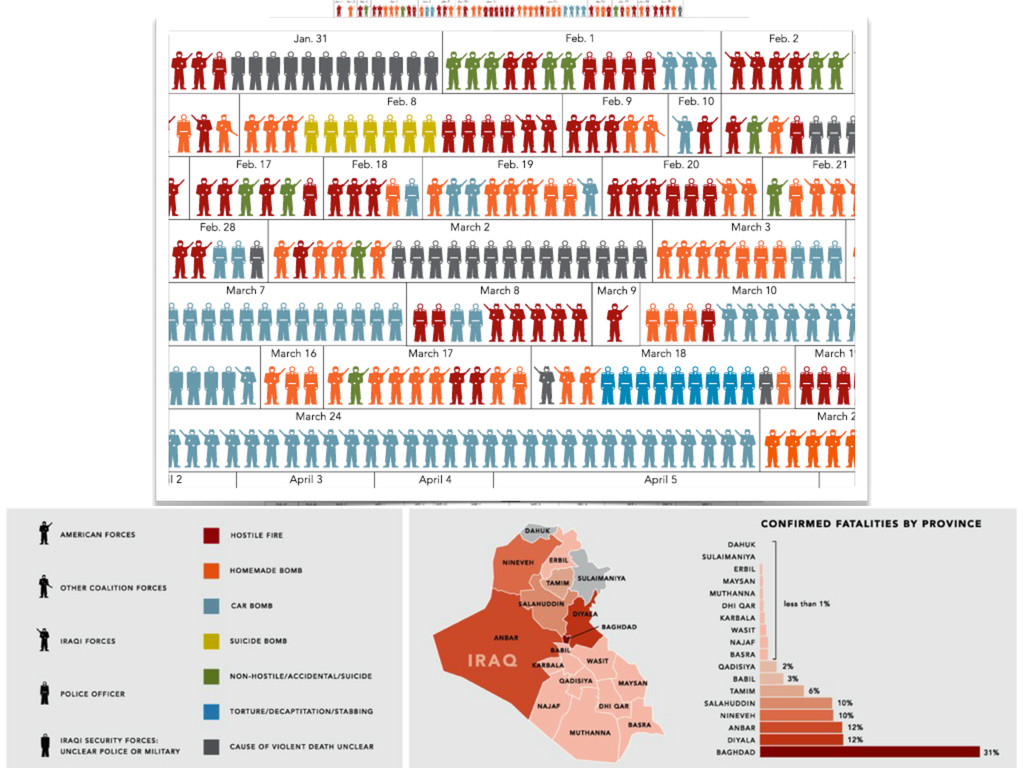
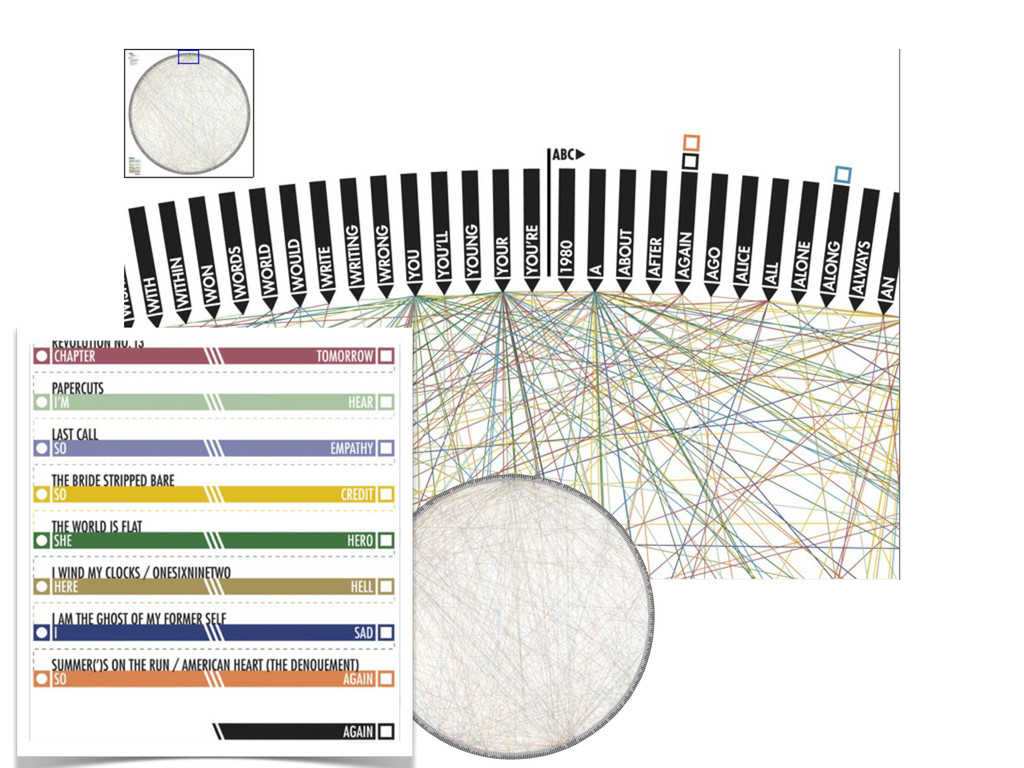
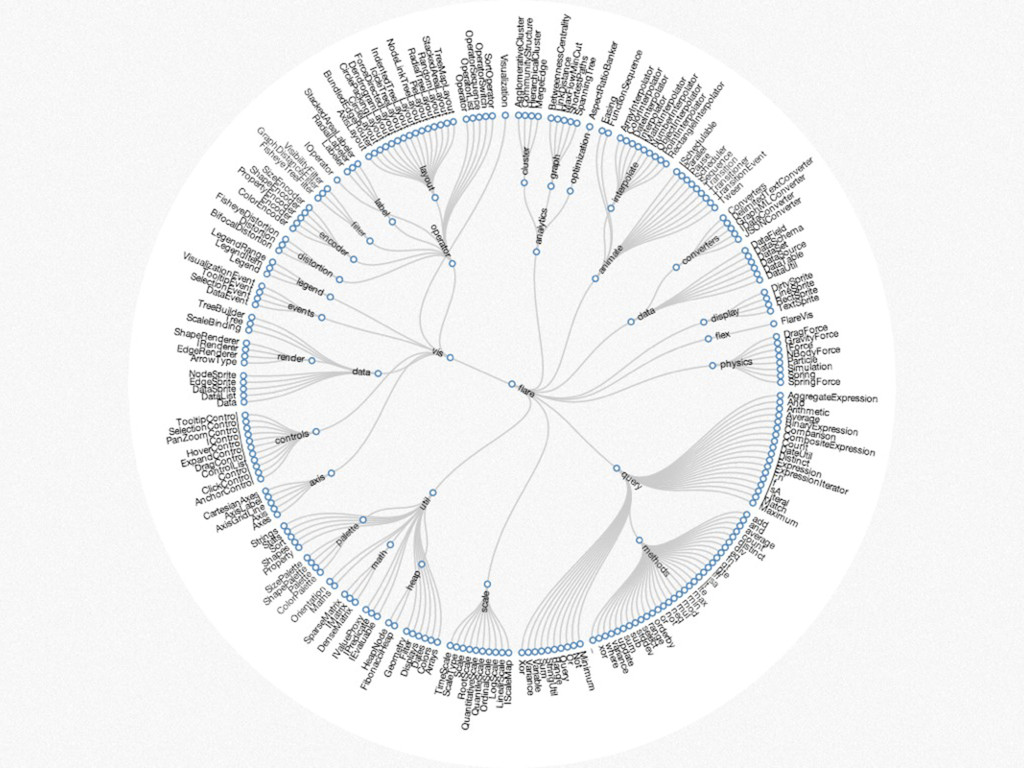
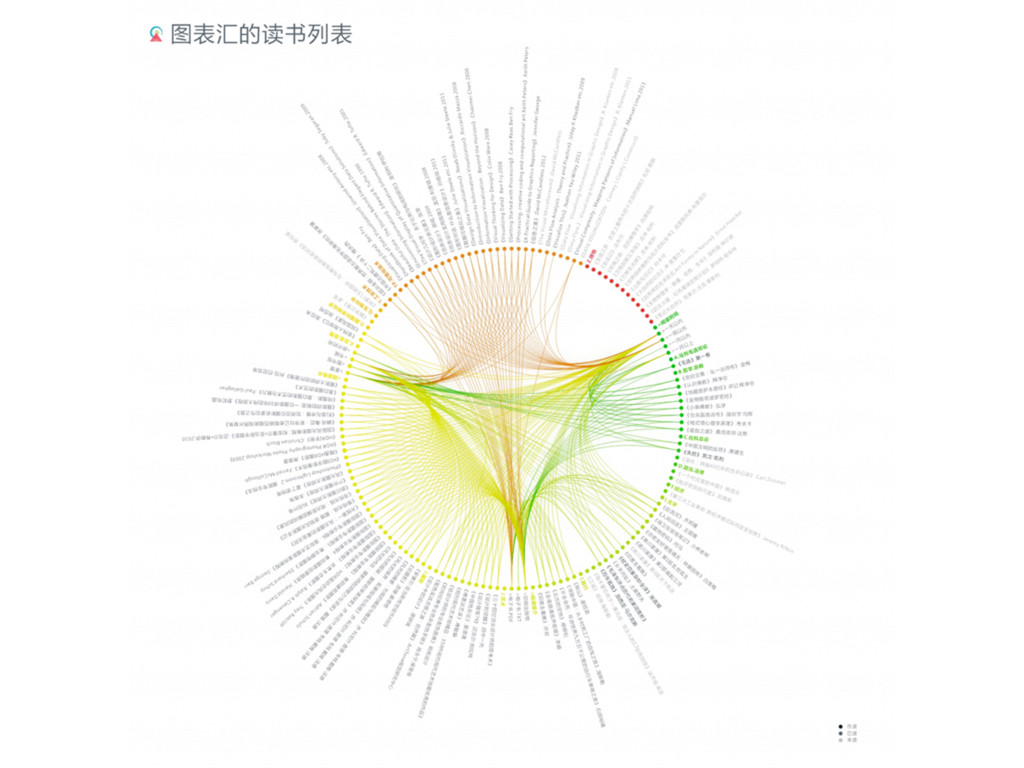
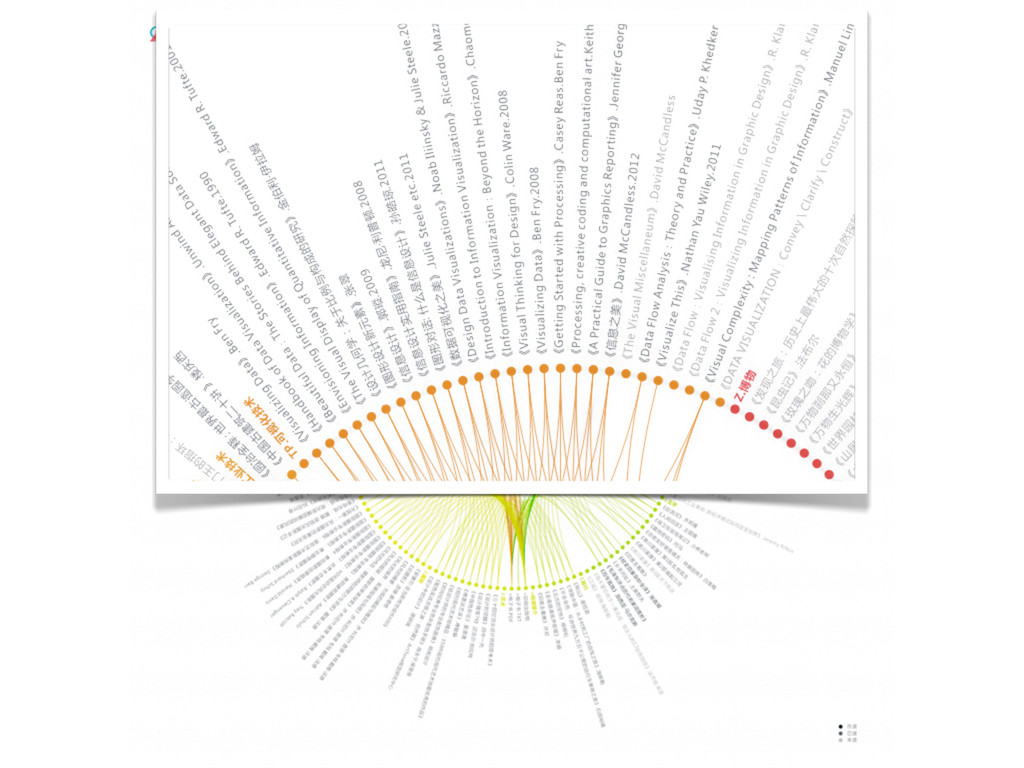
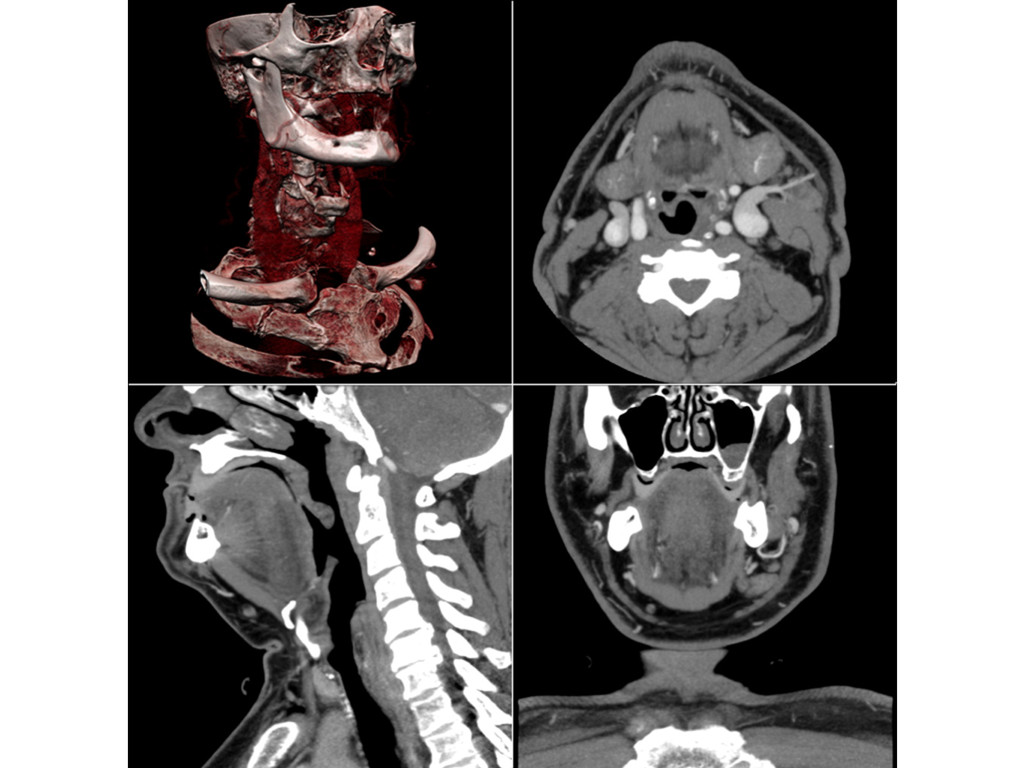
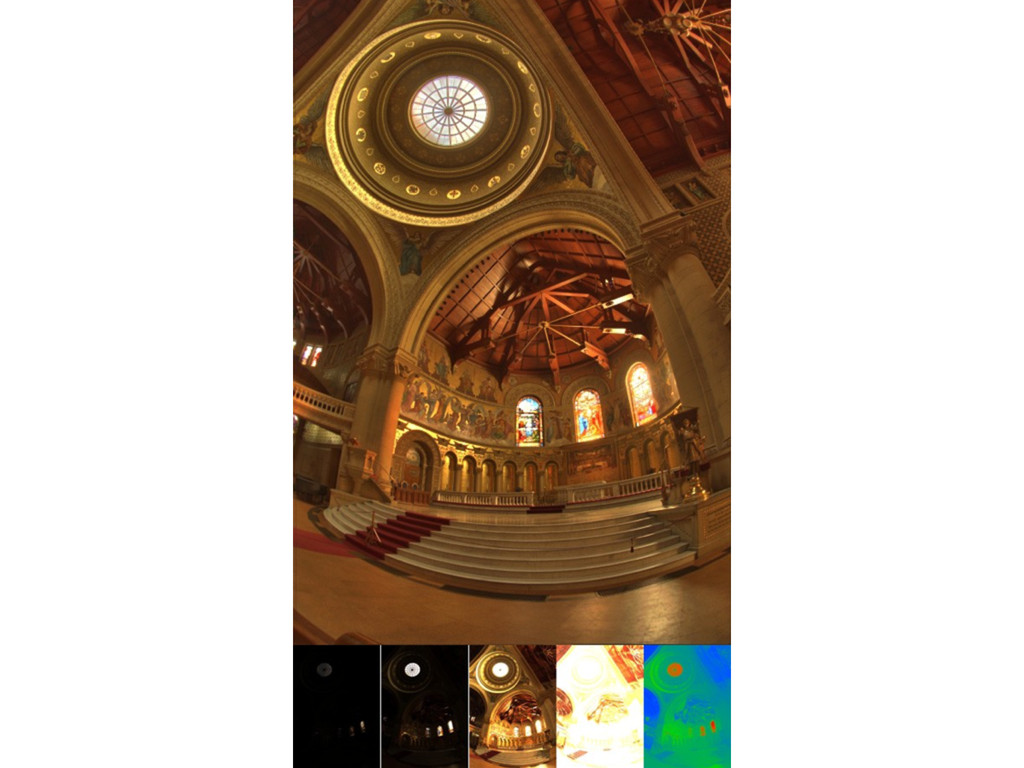
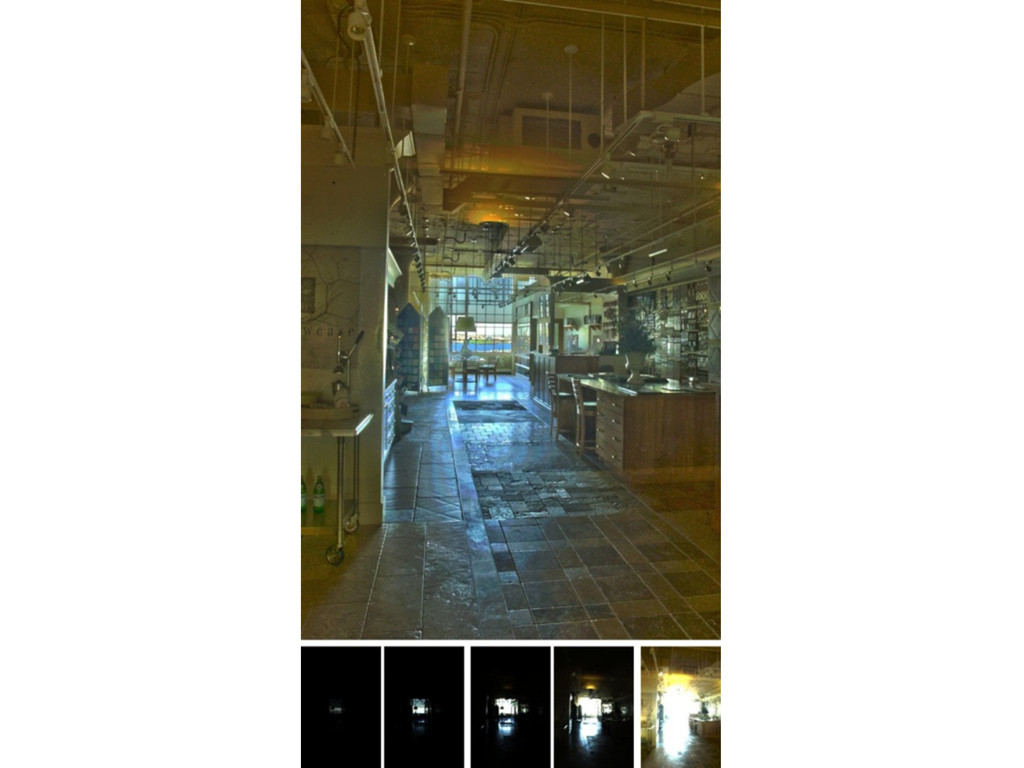
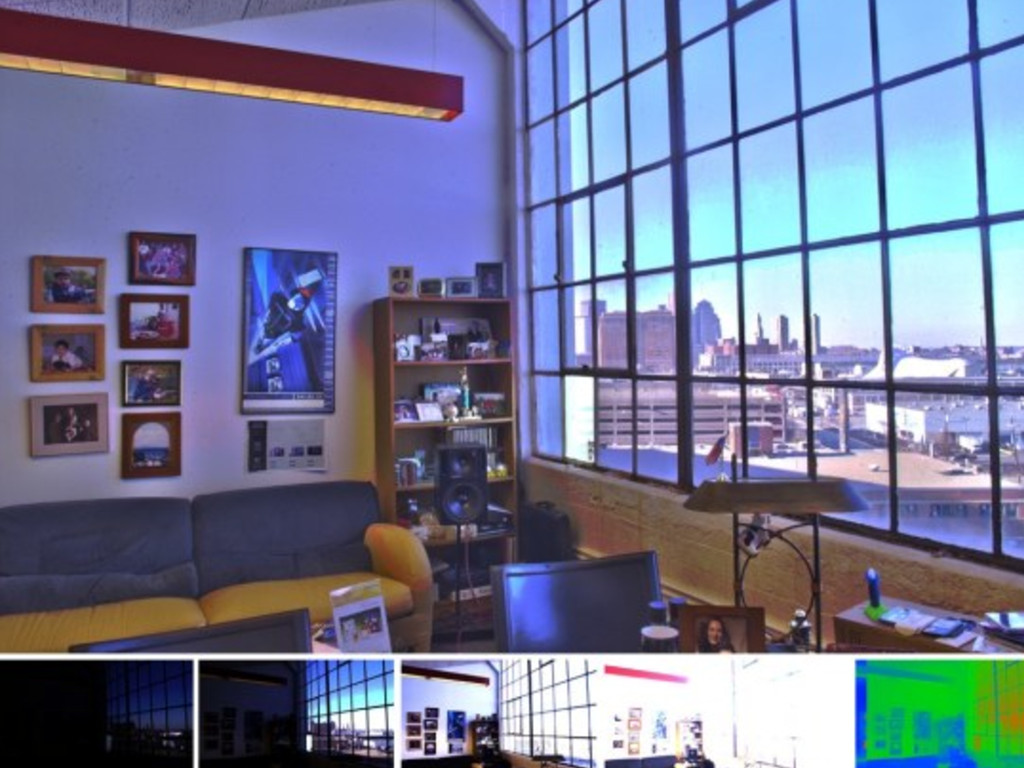
可视化实例
None
None
None
None
None
None
None
None
None
None
None
None
None
None
None
None
None
None
None
None
None
None
None
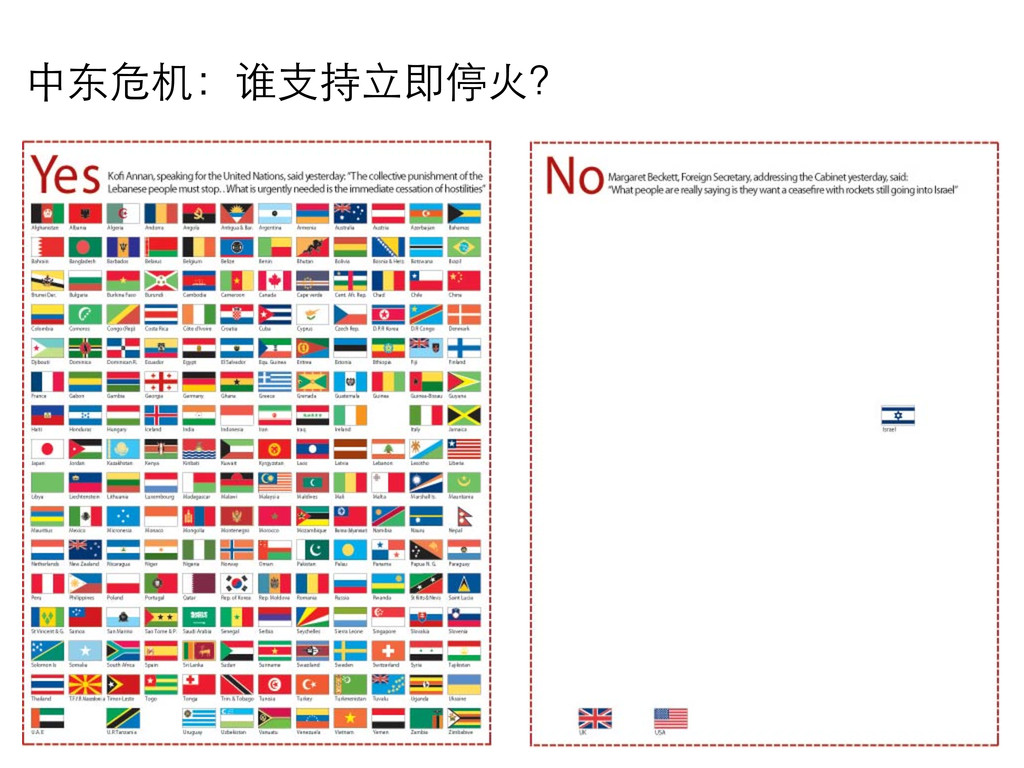
中东危机:谁支持立即停火?
None
None
None
None
None
None
None
None
None
None
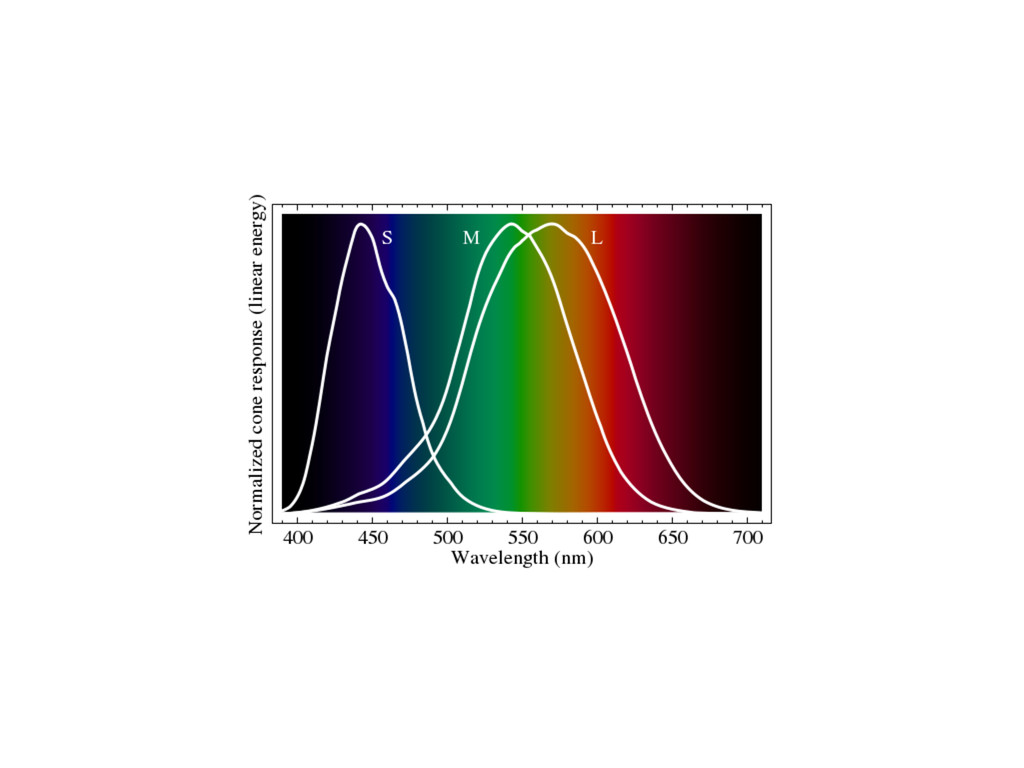
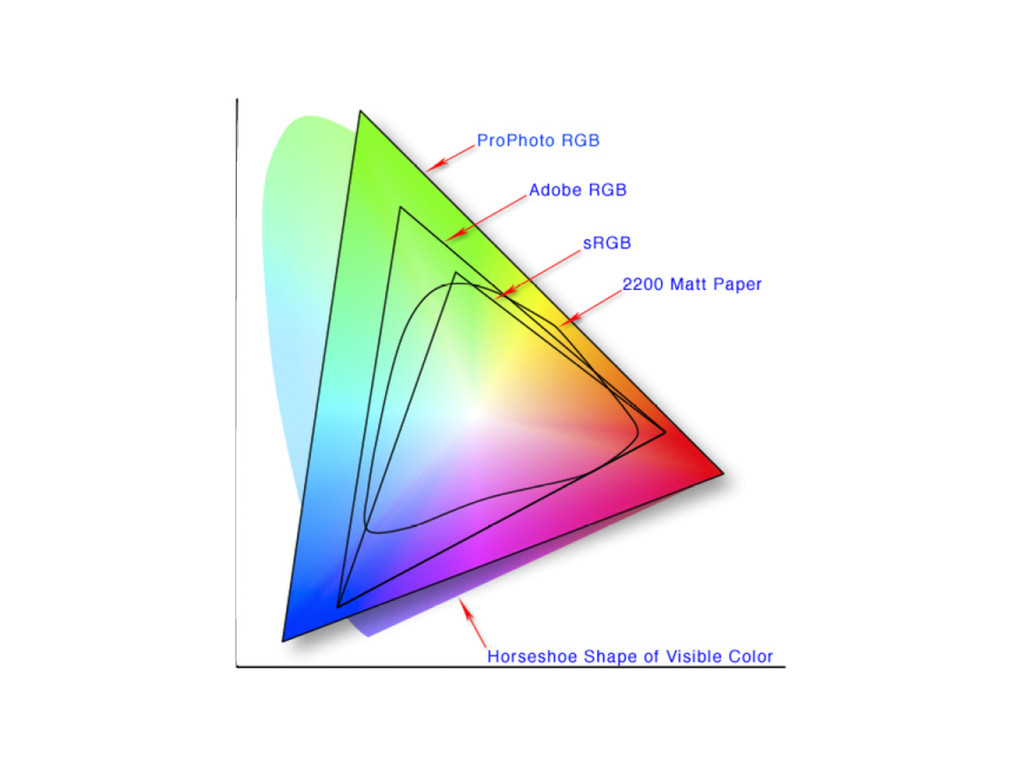
色彩
LOOK AT ME
LOOK AT ME
None
None
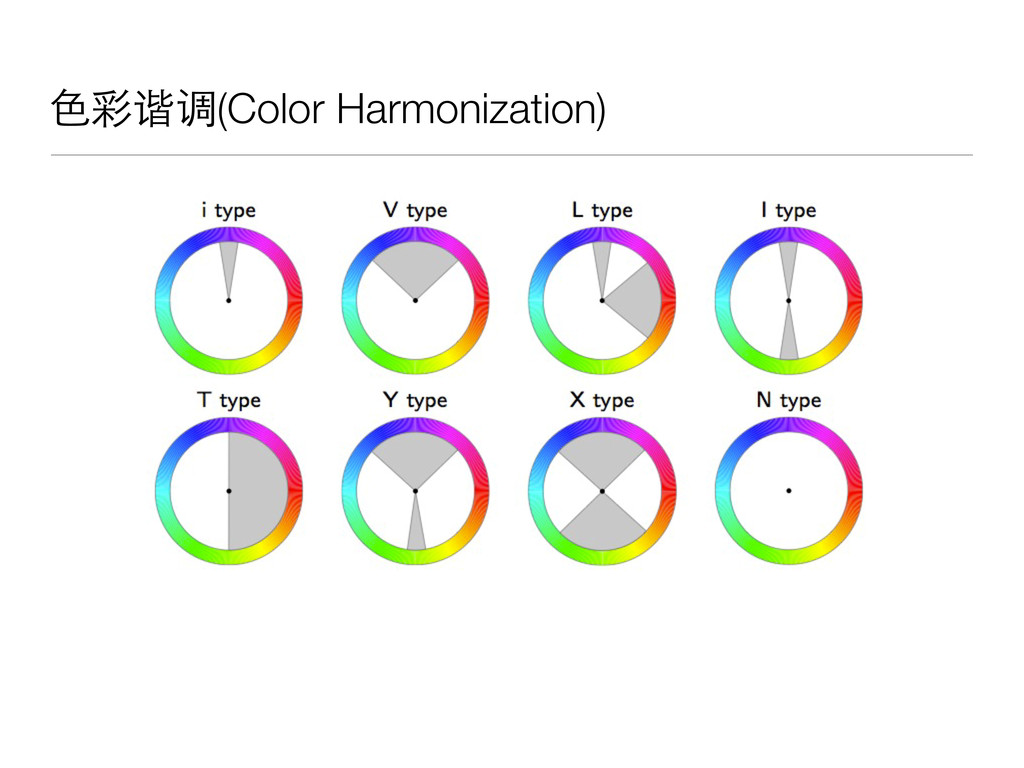
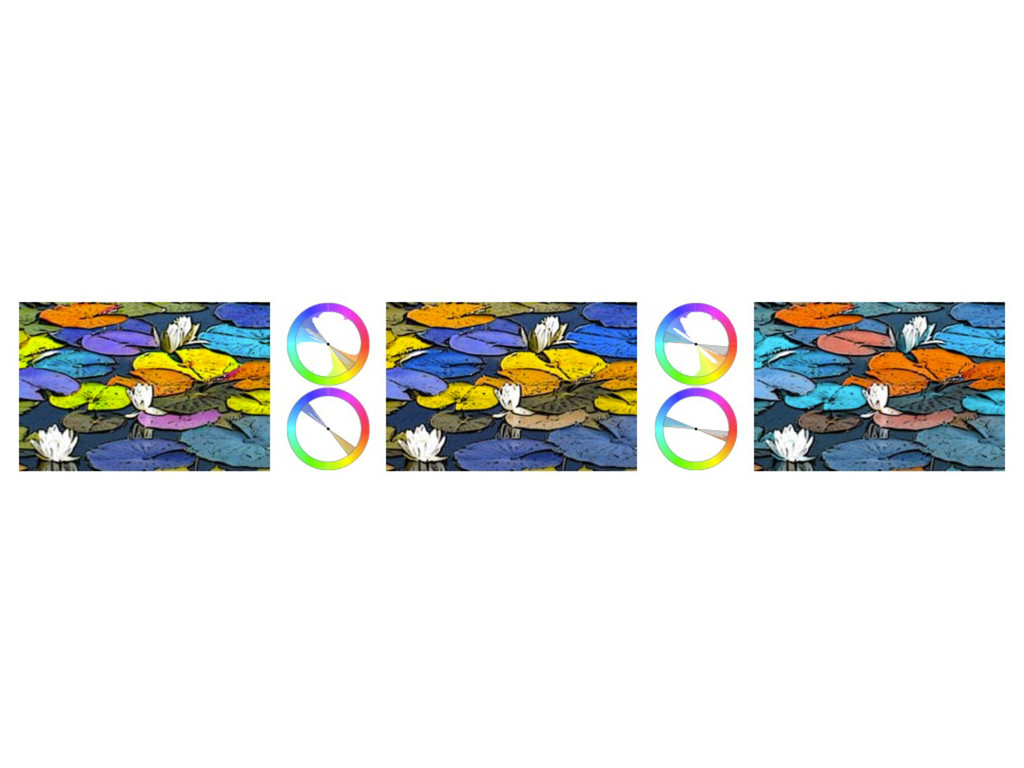
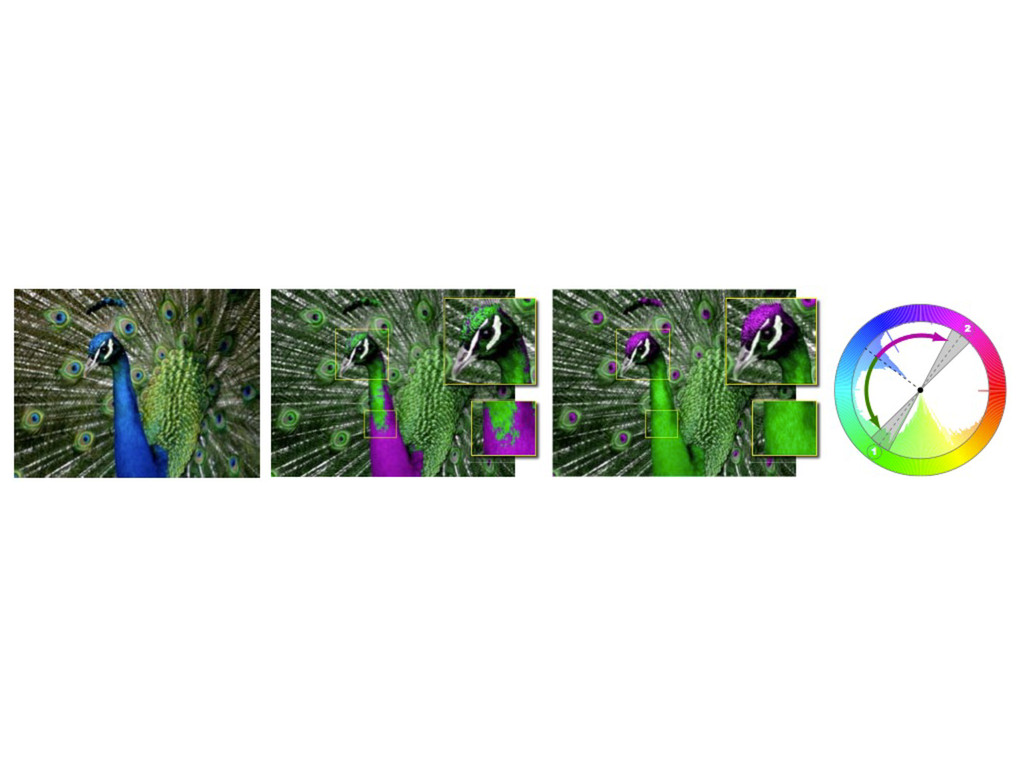
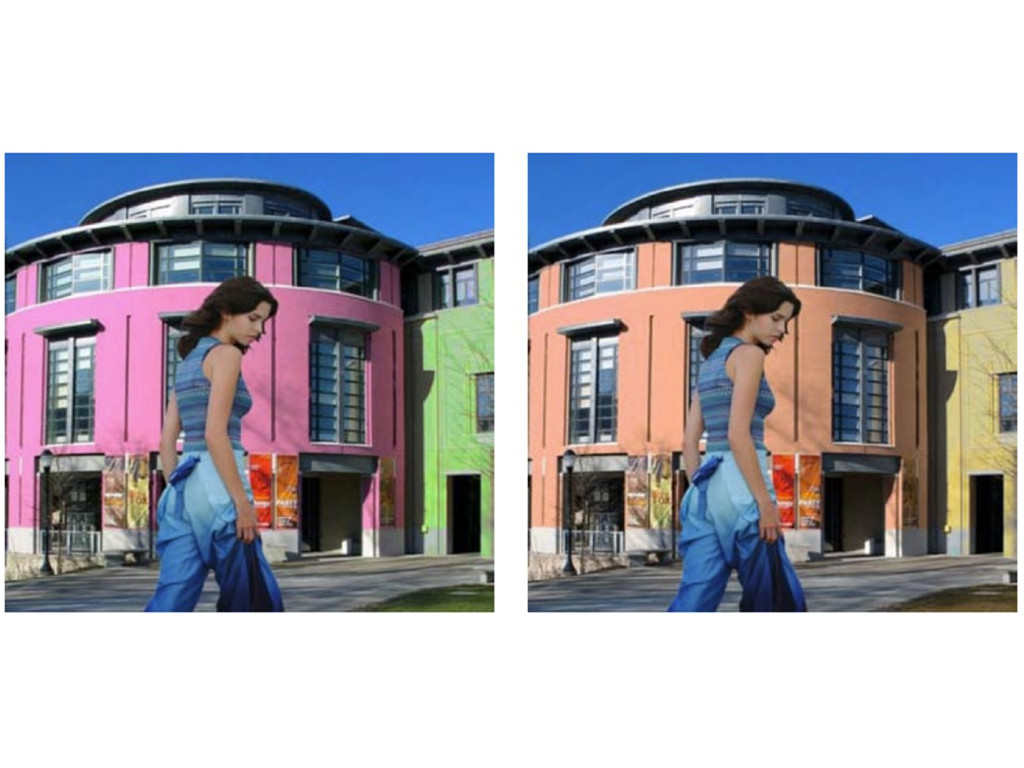
色彩谐调(Color Harmonization)
None
None
None
None
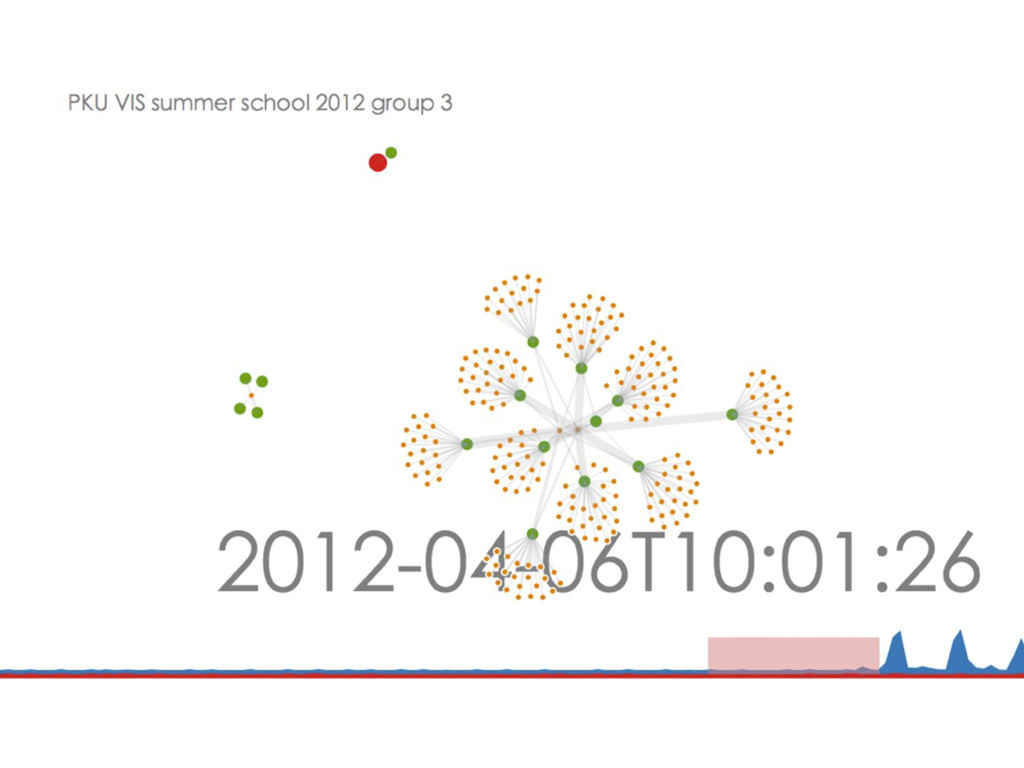
目前工作
None
None
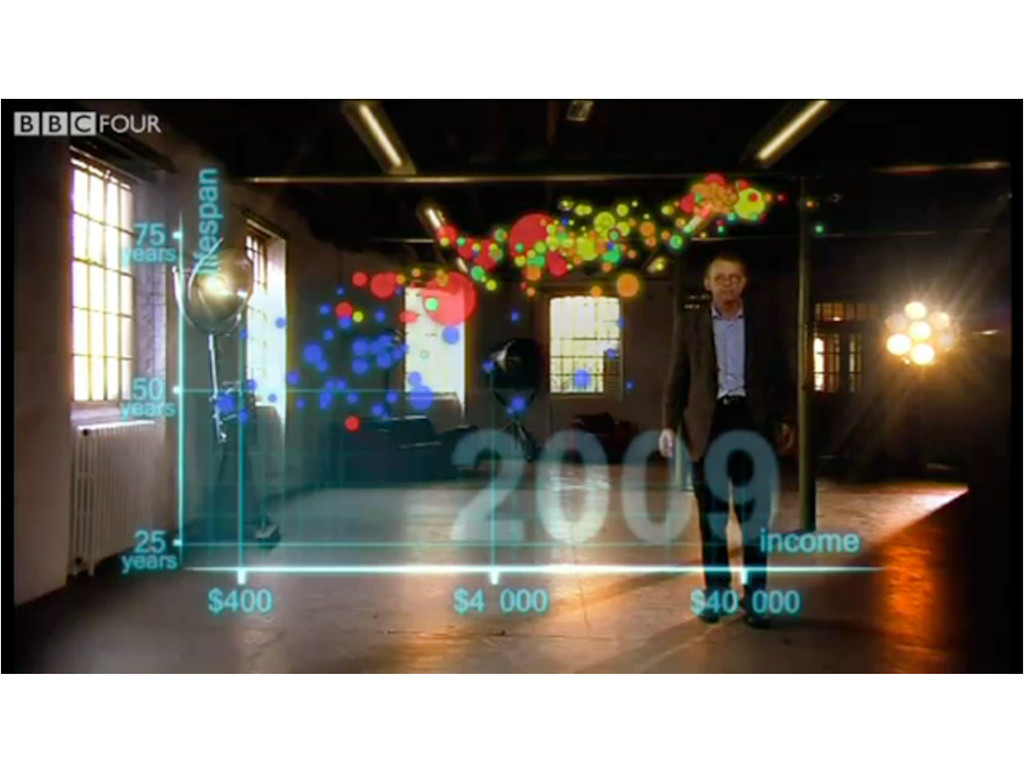
Guokr GapMinder Demo
Thank you!
None
None
None
None
None
None