Upgrade to Pro — share decks privately, control downloads, hide ads and more …

Maria_Shobeiry_statement_of_the_problem.pdf

 Maria_Shobeiry_statement_of_the_problem.pdf

Dr. Maria Shobeiry

November 10, 2022
Tweet

More Decks by Dr. Maria Shobeiry

Other Decks in Education

Transcript

  1. “ Investment Fluctuations of the Immigrant ESL Learners in New

    Zealand: A Problem Statement and Proposed Methodology Maria Shobeiry, PhD University of Tehran Sayyed Mohammad Alavi, PhD University of Tehran Shiva Kaivanpanah, PhD University of Tehran
  2. Immigrants and Investment Groups of people who moved out from

    their country of origin and settled down in a host country where acquisition of the official language is essential for any cultural integration, education, and meaningful employment endeavors (Gimeno-Feliu, Calderón-Larrañaga, & Díaz, 2019). A concept proposed by Norton (1995), for the first time, as the language learners' commitment to their language learning practice.
  3. What is the problem? It is a common practice in

    New Zealand that language teachers get-together on a regular basis and talk about any problems that could affect their teaching practice. No compensatory local remedy was found to help with this issue ( for example, changing teaching methods, using different classroom activities, and so forth) so they felt disappointed, frustrated, and perplexed. In three sessions of these get-togethers 24 ESL teachers (focus group interview sessions) in Auckland city-New Zealand unanimously complained about unexplainable investment fluctuations in their immigrant ESL learners
  4. Theoretical framework Darvin and Norton's (2015) model of investment In

    Darvin and Norton's (2015) model of investment, investment is the result of a dynamic interaction among ideology, capital, and language learners' identity. It means that the dominant ways of thinking in a certain community, called ideologies, are highly influenced by the political and social power, called capitals, which all highly influence the acceptability of the identity-related features of the members of that community.
  5. 1. To see whether the investment fluctuation in language learners

    is statistically significant . 2. Proposing a methodological framework for future studies in different context on this issue. What is the purpose?
  6. Methods 6 In order to fulfil the purposes of this

    study, the data were collected and analyzed in two phases: 1. English language teachers (various nationalities) 2. Immigrant English learners (Iranian)
  7. Participnats 24 English teachers ( two language schools) 193 Iranian

    English learners (five language schools) Total number N=24 Gender 15 women 9 men Nationality Iranian2 New Zealander11 Canadian 4 Korean 1 Australian 5 Swiss 1 Total number =193 (71 women,122 men) Participants at each level of English proficiency at the beginning of the study 37 B1 98 B2 58 C1 Education degree Various groups of humanities MA 29 PhD 19 Various groups of engineering MSc 32 PhD 28 Biotechnology, Microbiology, and Genetics MSc 26 PhD 29 Nursing BSc 13 Doctorate degree in Dentistry and Veterinary 17
  8. ➢ The first phase was conducted through three focus-group interview

    sessions in Auckland New Zealand ➢ The purpose of the first phase was to extract the visible signs of investment from the teachers' perspective ➢ This phase was an attempt to enrich the literature on this issue as there found to be no classified mentioning of the visible signs of investment in language learners in the previous literature. The first phase
  9. The Focus group data There were three main questions around

    which the focus-group interviews revolved: 1. How do you describe your students' commitment to language learning? 2. What visible features in the students can present that they care about language learning? 3. On what basis do you say that your students are less or more committed to language learning? The interviews were audio recorded and transcribed and coded 9
  10. Coding, thematic analysis, and results of the first phase 1)

    volunteering for any possible classroom activities 2) being focused in the classroom 3) note-taking and summarizing 4) proactively interacting with the peers 10 A coding scheme was developed based on the main features that the language teachers considered as the visible signs of investment in their students. A thematic analysis ,informed by Clarke and Braun (2013), on the coded data resulted in extracting the visible signs of investment as :
  11. ➢ Relying on the results of the first phase, the

    second phase was conducted ➢ It included observation of their English language classrooms and semi-structured interviews ➢ The purpose was to explore and track their visible signs of investment to discover the investment pattern that they presented in ten months. The second phase
  12. Observation of the classrooms Since all of the classrooms in

    the language schools were equipped with some sort of security camera system, we were provided with the video recordings of the classrooms in which the participants attended from 12 March 2015 till 12 July 2016 through the appreciated generous cooperation of the language schools' authorities. The video recordings were observed to explore any changes in the participants' observable signs of investment in the period of ten months through completing a 5- point Likert scale based on a rating system designed and developed for the purpose of this study. In order to categorize the huge amount of video recorded data, first, the video files were categorized based on the time of recording as they were grouped in 6 categories of three months. Then, for each participant, three sessions of the classes in which they attended were randomly selected and observed within each time category.
  13. Reliability of the observation Likert scale In order to test

    the reliability of the Likert scale two independent observers watched the same videos and completed the Likert items based in the scoring system separately A Cohen's Kappa test of inter-rater reliability and Spearman test of consistency were run. The values showed that there found to be a high level of consistency between the two raters' results.
  14. Cohen's Kappa test of inter-rater reliability and Spearman test of

    consistency Items and time categories Kappa value Sig Spearman correlation value Sig Q1C1 * RAQ1C1 .876 .000 .894 .000 Q2C1 * RAQ2C1 .855 .000 .787 .000 Q3C1 * RAQ3C1 .894 .000 .831 .000 Q4C1 * RAQ4C1 .858 .000 .895 .000 Q5C1 * RAQ5C1 .867 .000 .915 .000 Q6C1 * RAQ6C1 .792 .000 .855 .000 Q7C1 * RAQ7C1 .784 .000 .816 .000 Q8C1 * RAQ8C1 .815 .000 .838 .000 Q1C2 * RAQ1C2 .723 .000 .820 .000 Q2C2 * RAQ2C2 .737 .000 .786 .000 Q3C2 * RAQ3C2 .790 .000 .794 .000 Q4C2 * RAQ4C2 .650 .000 .718 .000 Q5C2 * RAQ5C2 .824 .000 .862 .000 Q6C2 * RAQ6C2 .736 .000 .809 .000 Q7C2 * RAQ7C2 .791 .000 .831 .000 Q8C2 * RAQ8C2 .709 .000 .728 .000 Q1C3 * RAQ1C3 .686 .000 .773 .000 Q2C3 * RAQ2C3 .711 .000 .794 .000 Q3C3 * RAQ3C3 .770 .000 .820 .000 Q4C3 * RAQ4C3 .779 .000 .818 .000 Q5C3 * RAQ5C3 .711 .000 .816 .000 Q6C3 * RAQ6C3 .645 .000 .795 .000 Q7C3 * RAQ7C3 .642 .000 .623 .000 Q8C3 * RAQ8C3 .753 .000 .764 .000 Q1C4 * RAQ1C4 .711 .000 .801 .000 Q2C4 * RAQ2C4 .689 .000 .640 .000 Q3C4 * RAQ3C4 .649 .000 .631 .000 Q4C4 * RAQ4C4 .806 .000 .847 .000 Q5C4 * RAQ5C4 .702 .000 .738 .000 Q6C4 * RAQ6C4 .734 .000 .758 .000
  15. Semi-structured interviewing 15 At the end of the observation procedure,

    a semi-structured interview was conducted with each of the 193 language learners for 40 minutes to triangulate the data .The interview questions revolved around the visible signs of investment observed in the classrooms to support the observation data.
  16. ➢ A Chi-square test was run on the observation data.

    ➢ Considering the scores of 5 for extremely active, 4 for active, 3 for sometimes active, 2 for hardly active, and 1 for extremely inactive in the Likert scale completed by the two observers, the results revealed that in the first and second time categories of the observation, the mean score of the observed data was above the average point of 2.5 (mean > 2.5) which presents a high level of investment in the participants at the beginning of this study. Then, in the third and fourth time categories, the mean score dropped down (mean < 2.5) which illustrates a drastic reduction in the participants' amount of investment in this period of time. Again, in the fifth and sixth time categories the mean scores bounced back (mean > 2.5) . This results suggest a U-shaped pattern in the participants investment which is named the U-shaped model of investment in this study. Data analysis and results of the second phase
  17. N Mean Std. Deviation Minimum Maximum Q1C1 193 4.7306 .58626

    2.00 5.00 Q2C1 193 4.7668 .57964 2.00 5.00 Q3C1 193 4.5440 .85961 2.00 5.00 Q4C1 193 4.1606 .72176 2.00 5.00 Q5C1 193 3.9326 .79754 2.00 5.00 Q6C1 193 4.5285 .89003 2.00 5.00 Q7C1 193 4.7047 .68528 2.00 5.00 Q8C1 193 3.9430 .79835 2.00 5.00 Q1C2 193 3.9067 .73712 2.00 5.00 Q2C2 193 4.4715 .75723 2.00 5.00 Q3C2 193 4.1710 .76838 2.00 5.00 Q4C2 193 3.1969 .63129 2.00 5.00 Q5C2 193 3.7254 .72329 2.00 5.00 Q6C2 193 3.7202 .73205 2.00 5.00 Q7C2 193 3.4767 .73649 2.00 5.00 Q8C2 193 3.4922 .70798 2.00 5.00 Q1C3 193 2.9430 .44706 2.00 4.00 Q2C3 193 2.9378 .45216 2.00 4.00 Q3C3 193 2.7772 .57473 2.00 4.00 Q4C3 193 2.4715 .62954 1.00 4.00 Q5C3 193 2.2591 .68862 1.00 3.00 Q6C3 193 2.1813 .70213 1.00 3.00 Q7C3 193 1.9326 .58685 1.00 3.00 Q8C3 193 1.9741 .59892 1.00 3.00 Q1C4 193 2.0000 .60381 1.00 3.00 Q2C4 193 2.0207 .62047 1.00 3.00 Q3C4 193 1.9896 .60372 1.00 3.00 Q4C4 193 1.7668 .58855 1.00 3.00 Q5C4 193 1.7565 .51818 1.00 3.00 Q6C4 193 1.6839 .57609 1.00 3.00 Q7C4 193 1.8187 .58029 1.00 3.00 Q8C4 193 1.6788 .61272 1.00 3.00 Q1C5 193 3.0777 .56750 2.00 4.00 Q2C5 193 3.3990 .49096 3.00 4.00 Q3C5 193 4.1088 .48259 3.00 5.00 Q4C5 193 4.0829 .56215 3.00 5.00 Q5C5 193 4.0622 .60058 3.00 5.00 Q6C5 193 4.2487 .51063 3.00 5.00 Q7C5 193 4.3731 .58247 3.00 5.00 Q8C5 193 4.4560 .58575 3.00 5.00 Q1C6 193 4.6995 .64779 3.00 5.00 Q2C6 193 4.8342 .48248 3.00 5.00 Q3C6 193 4.7202 .57233 3.00 5.00 Q4C6 193 4.7720 .54947 3.00 5.00 Q5C6 193 4.7513 .51063 3.00 5.00 Q6C6 193 4.7772 .53726 3.00 5.00 Q7C6 193 4.8497 .44862 3.00 5.00 Q8C6 193 4.7513 .54992 3.00 5.00 Chi-square descriptive Statistics for observation data of New Zealand
  18. Analysis of the semi-structured interview dataset To analyze this dataset,

    the answers were categorized in three time categories and were coded based on the most salient features found in their responses. First three months in the participants' narrations The number of found codes in this category = 159 Second three months in the participants' narrations The number of found codes in this category= 141 Third three months in the participants' narrations The number of found codes in this category= 158 Theme (hope for assimilation to the New Zealand community )Total number=133 Theme ( frustration) Total number= 127 Theme (New Zealand as the second home) Total number =146 I wanted to be part of the New Zealand society, so I try to learn their language well. I am always a foreigner in New Zealand no matter how hard I try New Zealand is my second home so I should speak the official language of my second home well I want for this country to give me the citizenship and be proud my achievements My accent, my appearance, my background all yells that I am not a New Zealander Doesn't matter I look different than white people. New Zealand is my home as much as is theirs I'd like to hang out more with New Zealanders than other nationalities to become part of them, I need to learn how to communicate with them. I can never speak like a New Zealander no matter how hard I try I am tired of being looked at as a foreigner My accent and my grammar will always show that I am an immigrant here, but I need to communicate effectively in my second home I try to speak like them and learn their culture so they will accept me as one of them I do not know who I am here in this country, language is the last issue New Zealanders are very nice people, I am happy of speaking their language and living in their country
  19. Findings of the semi-structured interview The coded interview data supported

    the observation data and confirmed the U-shaped model of investment in the language learners. then, they stated that they faced a phase of frustration in all aspects of their lives in New Zealand including language learning since they realized that assimilation to the New Zealand community will never happen to them (127 out of 141 codes ~ 90%). Finally, the number of codes in the third three months of the data showed that the participants' investment bounced back to a high level of commitment as in this period of time they considered New Zealand as their second home and English as the language of their home (146 out of 158 codes~ 92%) First the language learners showed a high level of enthusiasms to learn English as they tried to integrate into the New Zealand community (133 out of 159 codes ~ 83.6%)
  20. What to focus on in future studies? 1. Darvin and

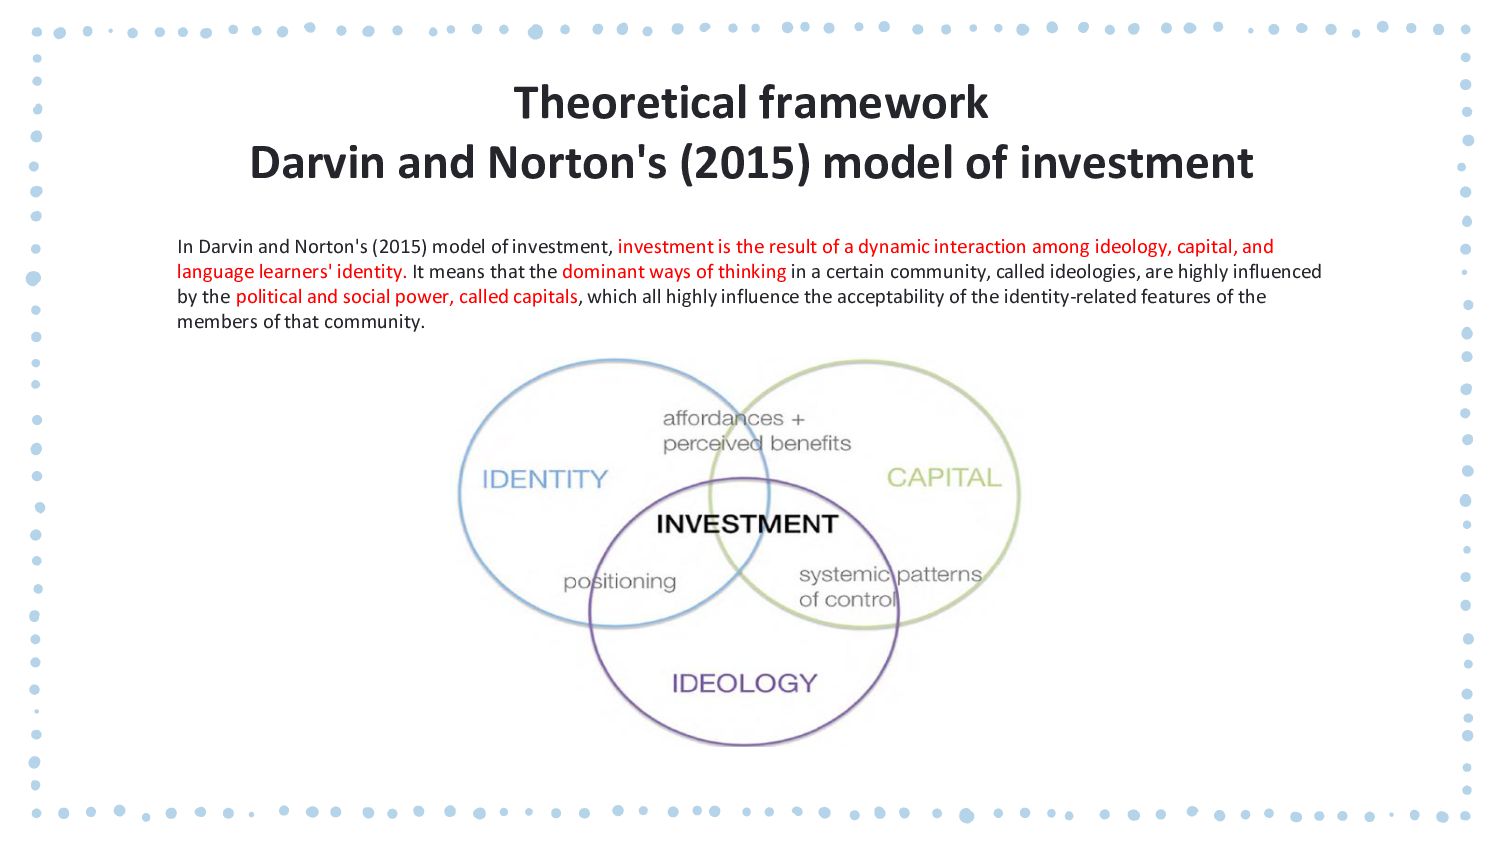
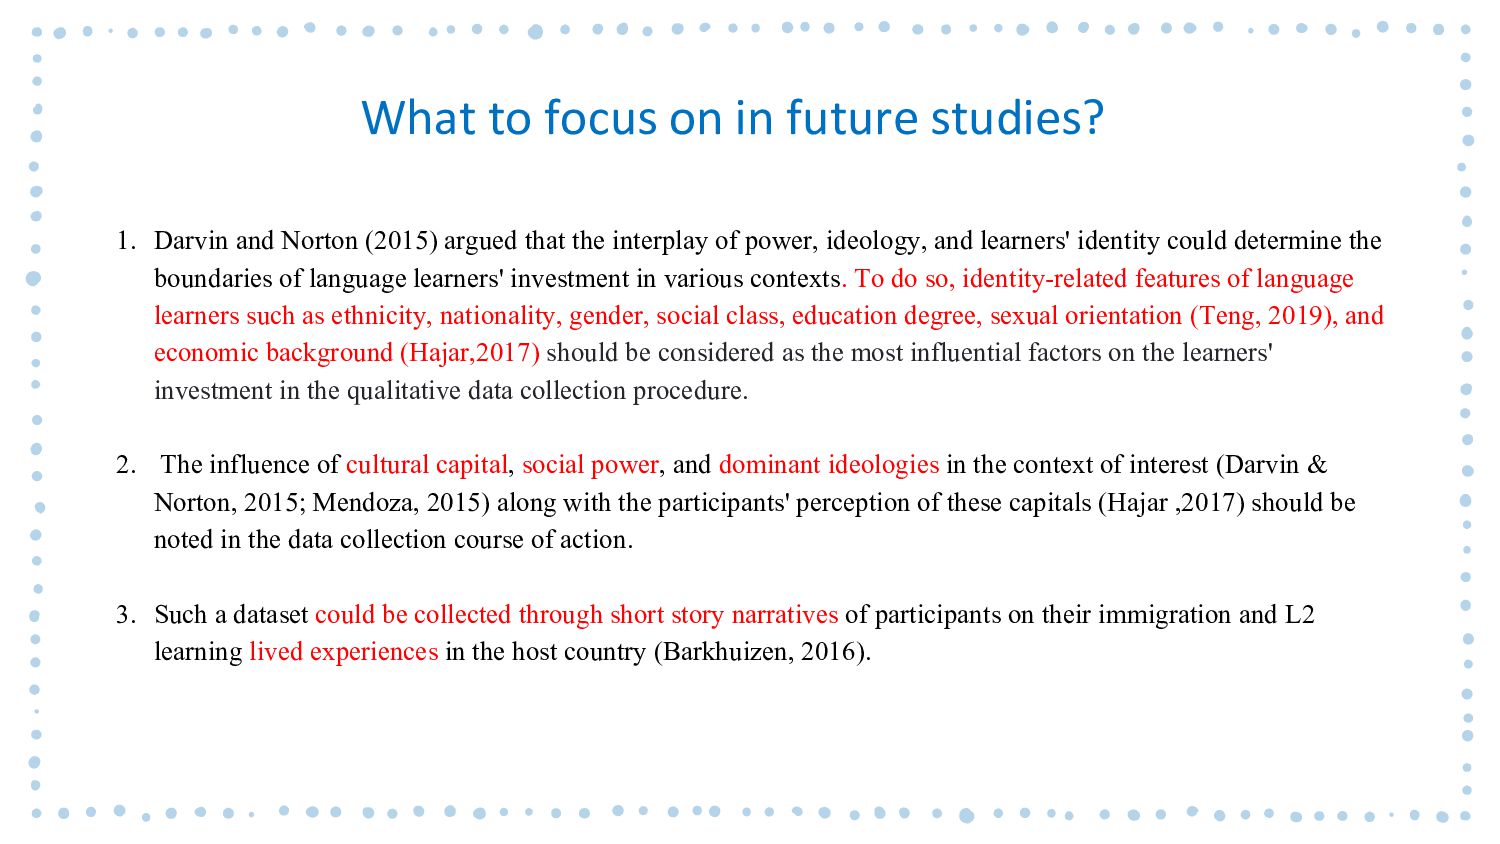
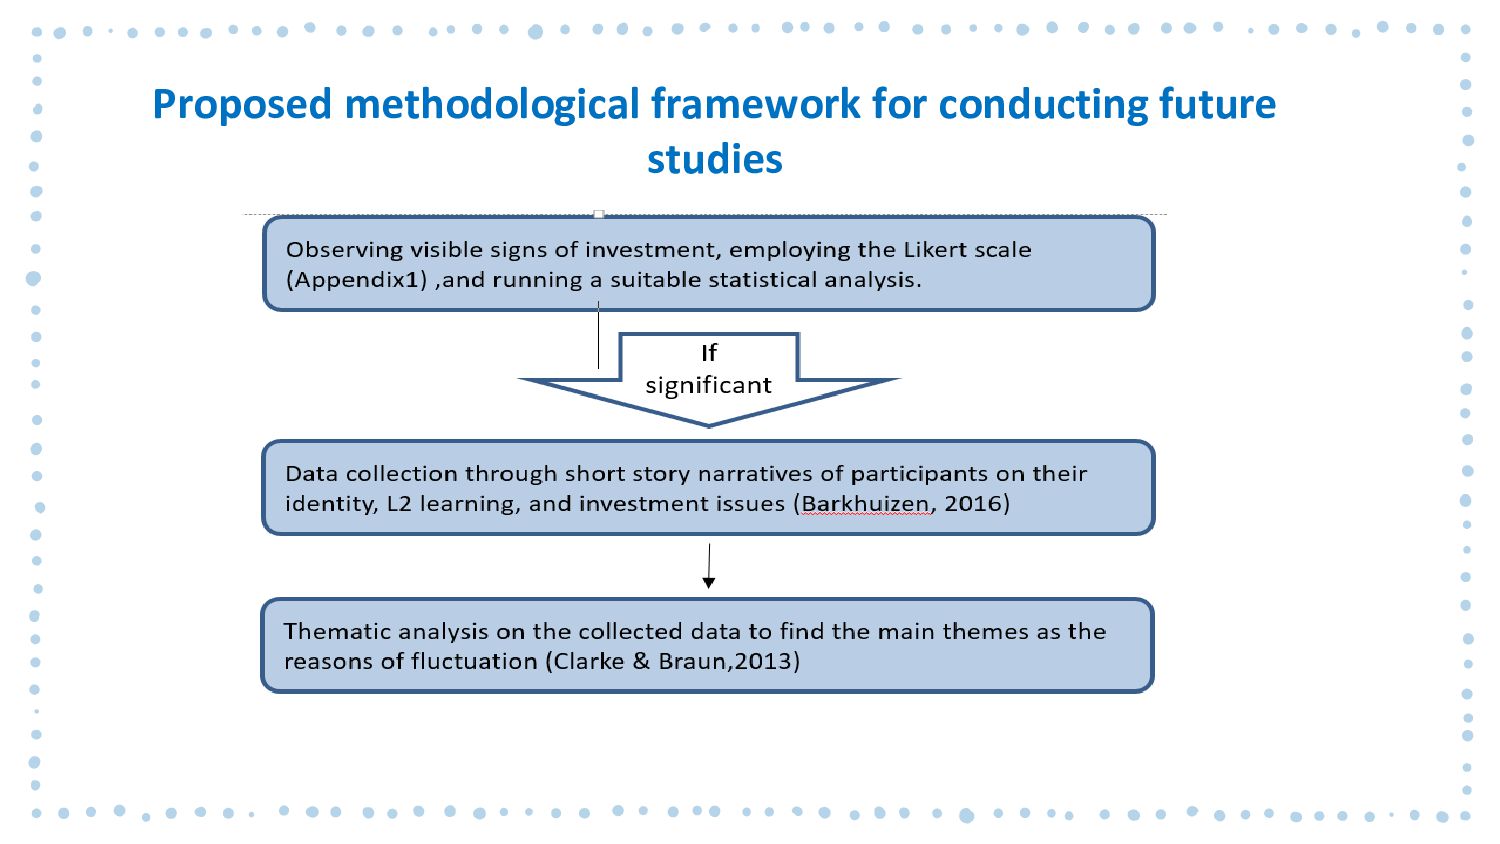
    Norton (2015) argued that the interplay of power, ideology, and learners' identity could determine the boundaries of language learners' investment in various contexts. To do so, identity-related features of language learners such as ethnicity, nationality, gender, social class, education degree, sexual orientation (Teng, 2019), and economic background (Hajar,2017) should be considered as the most influential factors on the learners' investment in the qualitative data collection procedure. 2. The influence of cultural capital, social power, and dominant ideologies in the context of interest (Darvin & Norton, 2015; Mendoza, 2015) along with the participants' perception of these capitals (Hajar ,2017) should be noted in the data collection course of action. 3. Such a dataset could be collected through short story narratives of participants on their immigration and L2 learning lived experiences in the host country (Barkhuizen, 2016).
  21. 1. Thematic analysis is widely used to analyze qualitative data

    on individuals' lived experiences, feelings, and understandings of particular phenomena (Hajar, 2017). 2. The guideline of Clarke and Braun (2013) provides a flexible theoretical framework for analyzing various types of qualitative data in order to find main themes about the construct of interest How to analyze the collected data? The thematic analysis informed by the guideline of Clarke and Braun (2013) is proposed
  22. Clarke and Braun’s (2013) Thematic analysis Phase What to do

    1.Familiarization with the data Researchers must immerse themselves in the data through reading and re-reading the transcriptions. 2.Coding Generating brief labels for important features of the data relevant to the research questions.. 3.Searching for themes A theme is a coherent and meaningful pattern in the dataset relevant to the research question. to identify similarities in the data. Searching for themes is a bit like coding your codes 4.Reviewing themes The researcher should reflect on whether the themes tell a convincing story about the whole dataset. 5.Defining themes Identifying the ‘essence’ of each theme and constructing a concise and informative name for each theme. 6.Writing up Writing-up involves telling the story that the data narrate. It should be coherent and persuasive in accordance with the context of data collection.