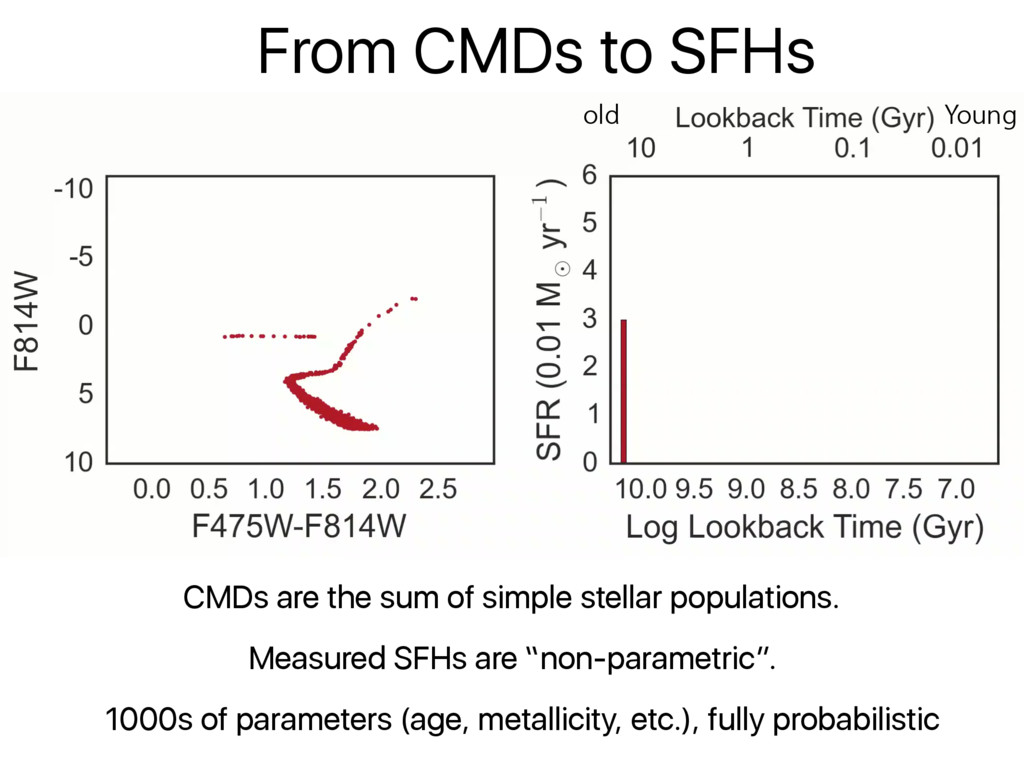
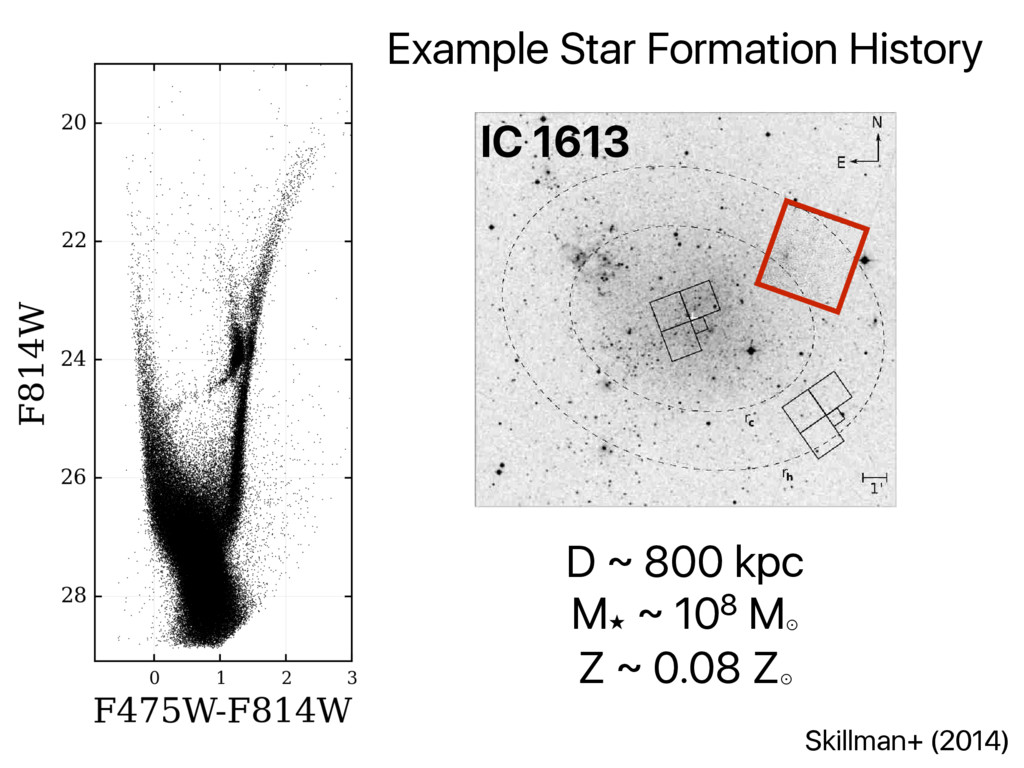
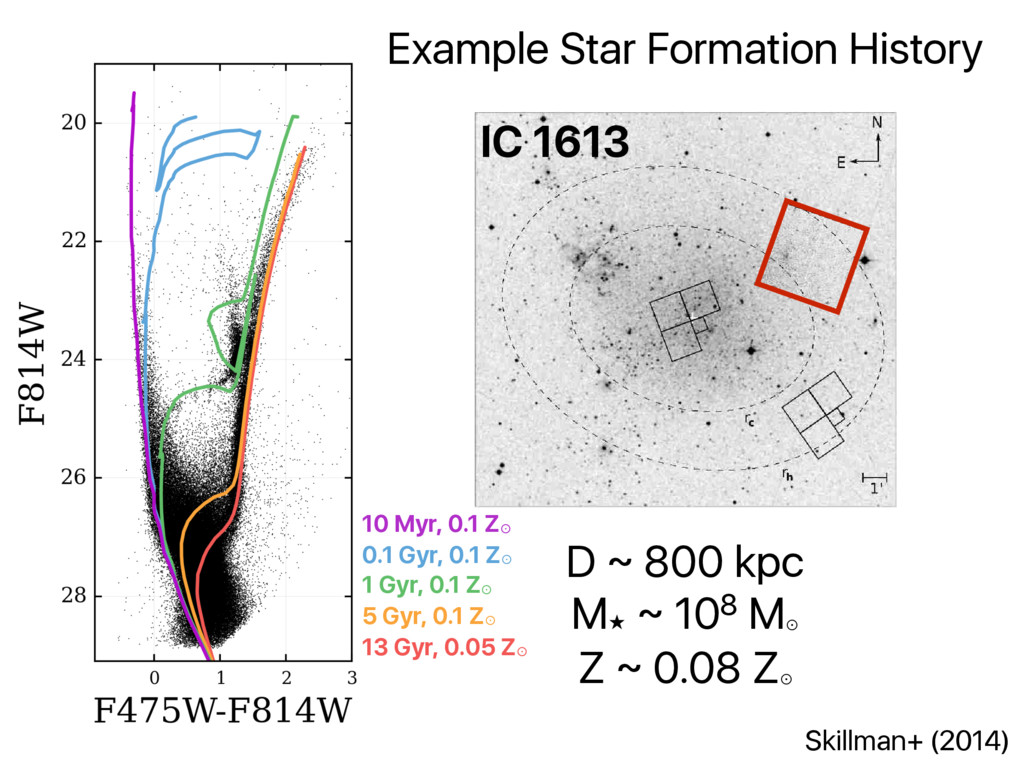
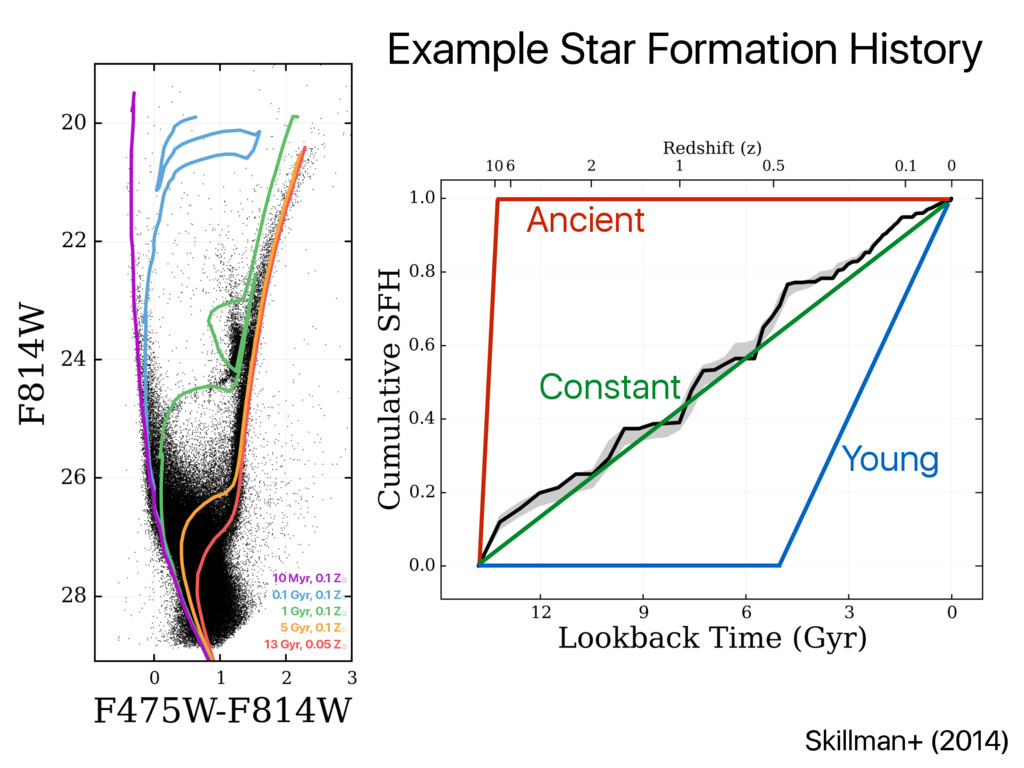
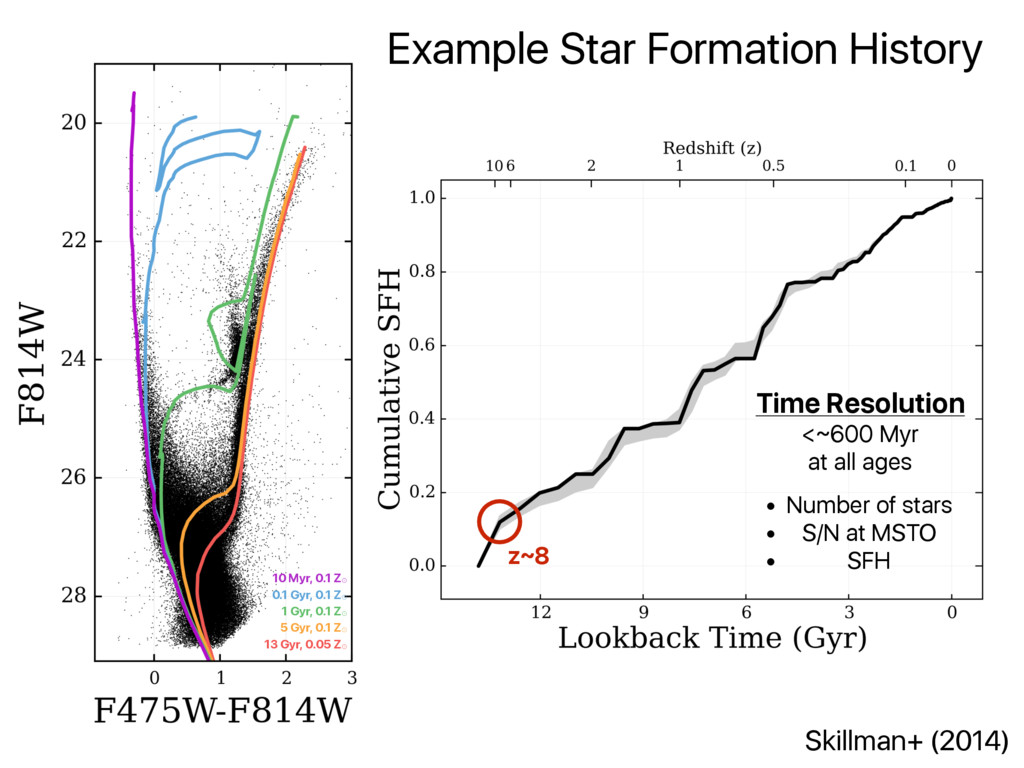
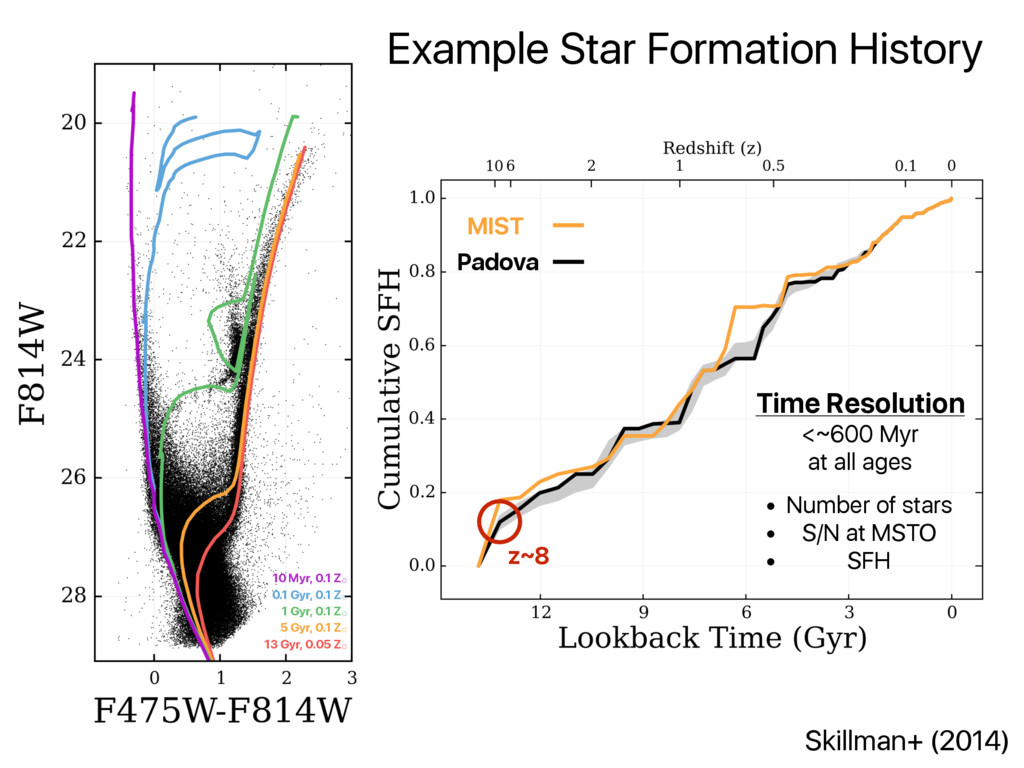
conducted a wide field optical survey of IC 1613, and trace red giant branch (RGB) stars out to radii 16.5 arcminutes ( ⇠ 3.6 kpc), showing the galaxy to be more extended than previously thought. The resolved stellar populations of IC 1613 have been studied with the HST twice in the past, both times us- ing the WFPC2 camera. Cole et al. (1999) studied a central field and found IC 1613 to be a smoothly evolv- ing galaxy with a relatively constant SFR over the last Gyr. Horizontal branch (HB) stars were detected, indi- cating the presence of an old population. Skillman et al. (2003a) obtained deep imaging for a field located 7.4 arcminutes southwest of the center. While that imaging was not quite deep enough to reach to the oldest main sequence turno↵ stars, greatly limiting the time resolu- tion at the oldest ages, the derived SFRs were constant within a factor of three over the entire lifetime of the galaxy. In this paper, we present the SFH of IC 1613 obtained from observations with the ACS on the HST. The pho- tometry reaches the oldest main sequence turn-o↵s of the galaxy, allowing us to obtain an accurate SFH even for the oldest stellar populations. Bernard et al. (2010) have already used these observations to conduct a study of the variable star content of IC 1613. The structure of the paper is as follows: in § 2 the obser- vations and data reduction are discussed and the CMD is presented. The derived SFH of IC 1613 is presented in § 3 and is compared with those of other LCID galaxies in § 4. The implications of the SFH of IC 1613 for galaxy mod- eling, and, in particular, the over-cooling problem are discussed in § 5. The main conclusions of the work are summarized in § 6. As with the previous LCID papers, cosmological parameters of H0 = 70.5 km s 1 Mpc 1, ⌦ = 0.273, and a flat Universe with ⌦ = 1 ⌦ are Fig. 1.— The location of the newly observed HST ACS field in IC 1613 (rectangle, upper right). The optical center of the galaxy is indicated by the white cross. The two dashed ellipses correspond to the core radius (rc) at 4. 05 (⇠ 1.0 kpc) and the half-light radius (rh ) at 6. 05 (⇠ 1.4 kpc). As can be seen from the figure, the HST ACS field is located between the two. Also indicated are the positions of the two previous HST WFPC2 fields (chevrons) from Cole et al. (1999) (inner) and Skillman et al. (2003a) (outer). DOLPHOT (Dolphin 2000), were used independently to obtain the photometry of the resolved stars. Non-stellar objects and stars with discrepant and large uncertainties were rejected based on estimations of profile sharpness and goodness of fit. See Monelli et al. (2010b) for more details about the photometry reduction procedures. In- Example Star Formation History D ~ 800 kpc Ṃ ~ 108 M ⊙ Z ~ 0.08 Z ⊙ Skillman+ (2014) IC 1613 10 Myr, 0.1 Z⊙ 0.1 Gyr, 0.1 Z⊙ 1 Gyr, 0.1 Z⊙ 5 Gyr, 0.1 Z⊙ 13 Gyr, 0.05 Z⊙