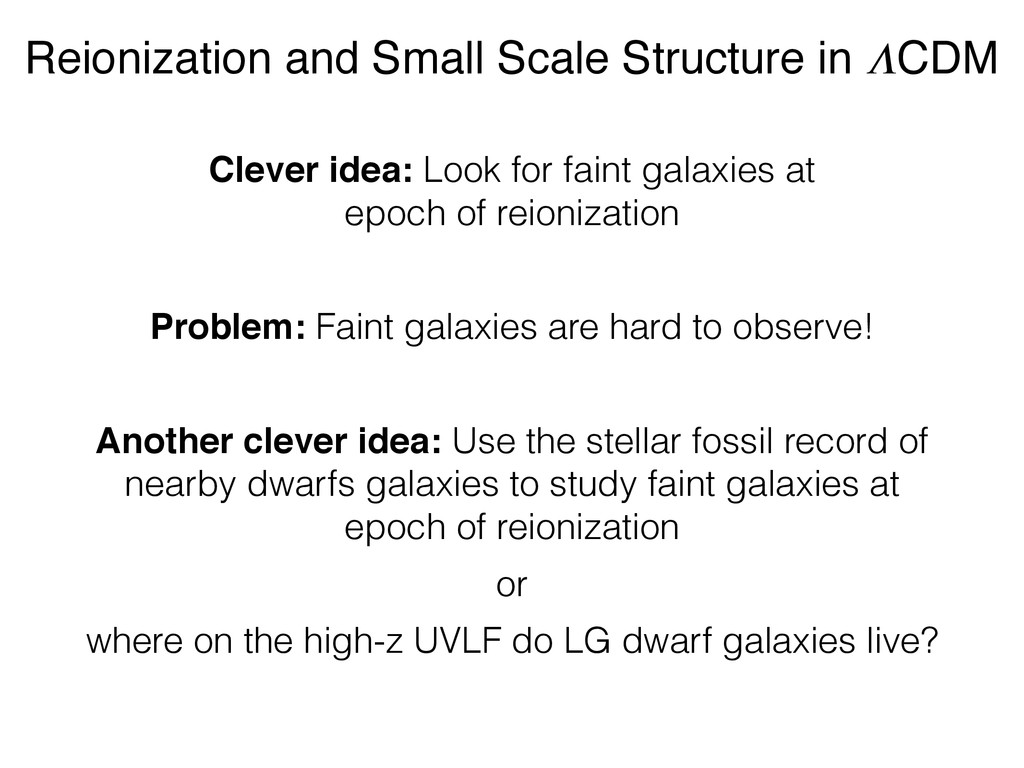
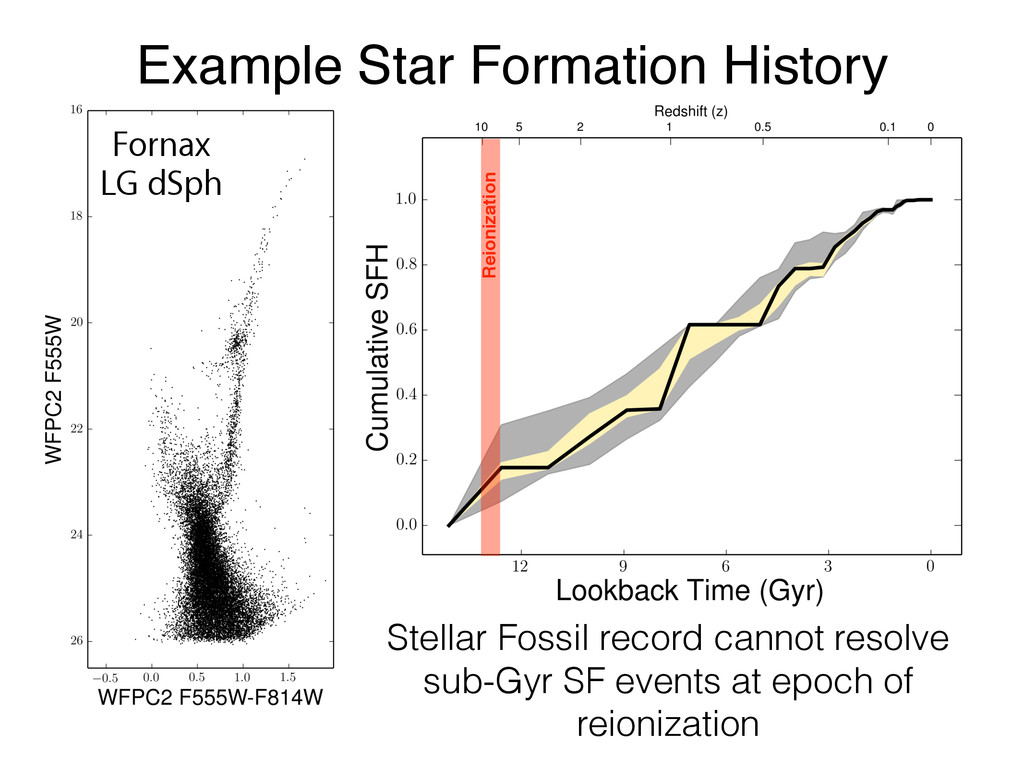
Problem: Faint galaxies are hard to observe! Another clever idea: Use the stellar fossil record of nearby dwarfs galaxies to study faint galaxies at epoch of reionization or where on the high-z UVLF do LG dwarf galaxies live? Reionization and Small Scale Structure in CDM
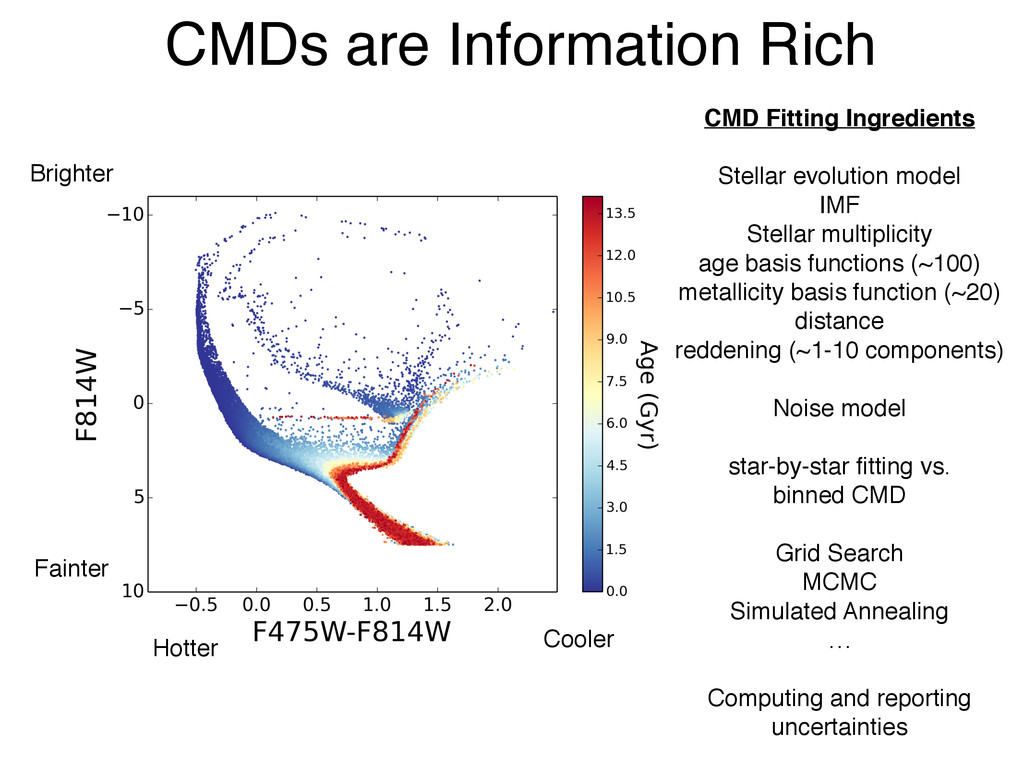
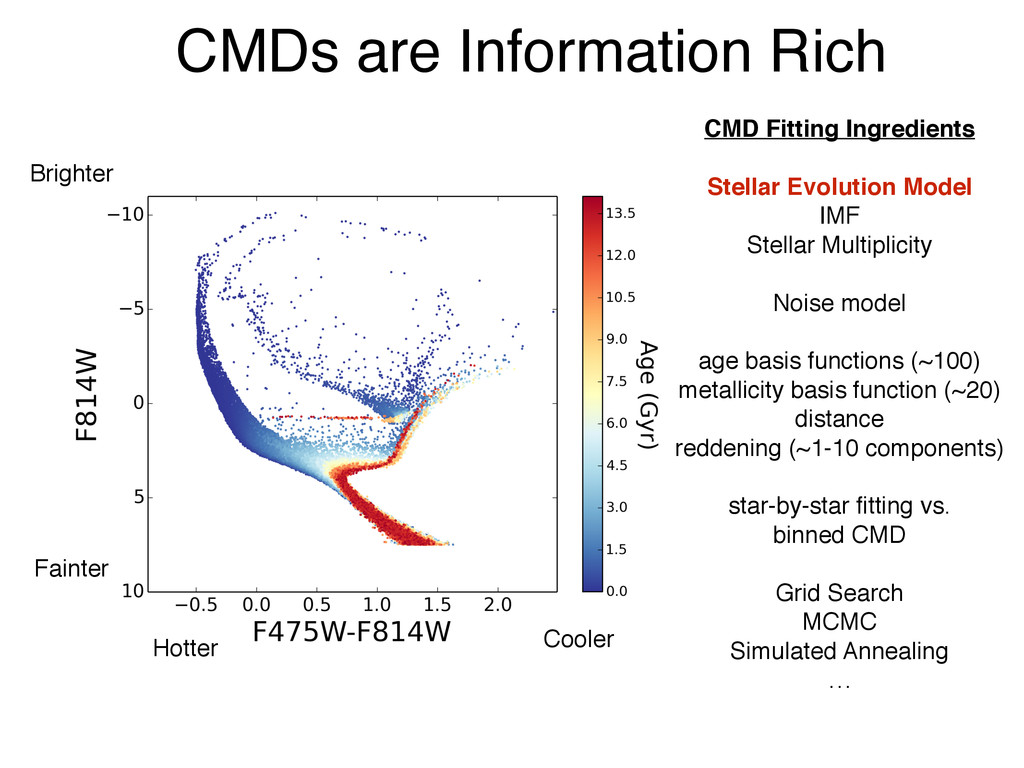
evolution model IMF Stellar multiplicity age basis functions (~100) metallicity basis function (~20) distance reddening (~1-10 components) Noise model star-by-star fitting vs. binned CMD Grid Search MCMC Simulated Annealing … Computing and reporting uncertainties CMDs are Information Rich
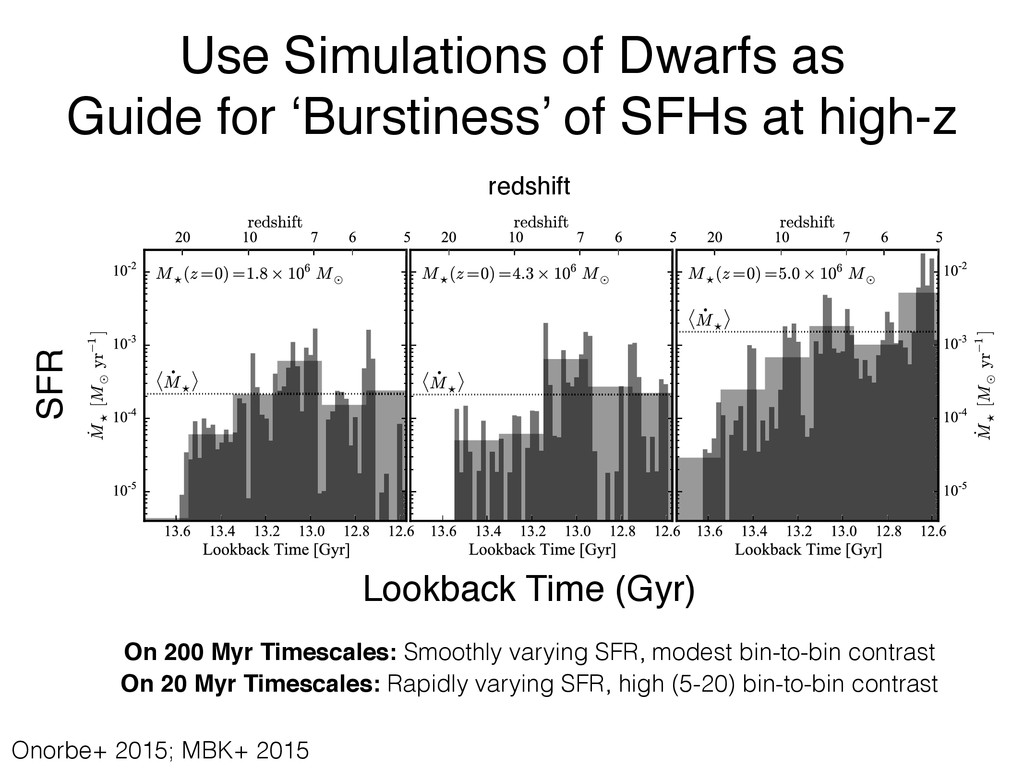
formation rates calculated in bins of 200 Myr (light gray histograms) and 20 Myr (dark gray histograms) for simulated galaxies from O˜ norbe et al. (2015; left) and Fitts et al. (in preparation; center and right) up to z = 5. At the present day, each galaxy has 106 . M?(z = 0)/M . 5 ⇥ 106 and is hosted by a halo with M vir (z = 0) = 1010 M . The dotted horizontal line shows the mean SFR over the period plotted. Averaged over 200 Myr periods, the SFRs appear to be increasing to z = 7. On 20 Myr timescales, they are much burstier and fluctuate strongly. These simulated SFHs motivate the burst parametrizations we use in our modeling. ical simulations. Figure 1 shows examples of such episodic SFHs for three simulated dwarf galaxies at z > 5. Each was run using Gizmo (Hopkins 2014) with meshless finite- into a sample with redshift selection function P(z). The weights can correspond to the photometric redshift distri- bution, P(z), from an observational sample, to some modi- Use Simulations of Dwarfs as Guide for ‘Burstiness’ of SFHs at high-z SFR Lookback Time (Gyr) redshift On 200 Myr Timescales: Smoothly varying SFR, modest bin-to-bin contrast On 20 Myr Timescales: Rapidly varying SFR, high (5-20) bin-to-bin contrast Onorbe+ 2015; MBK+ 2015
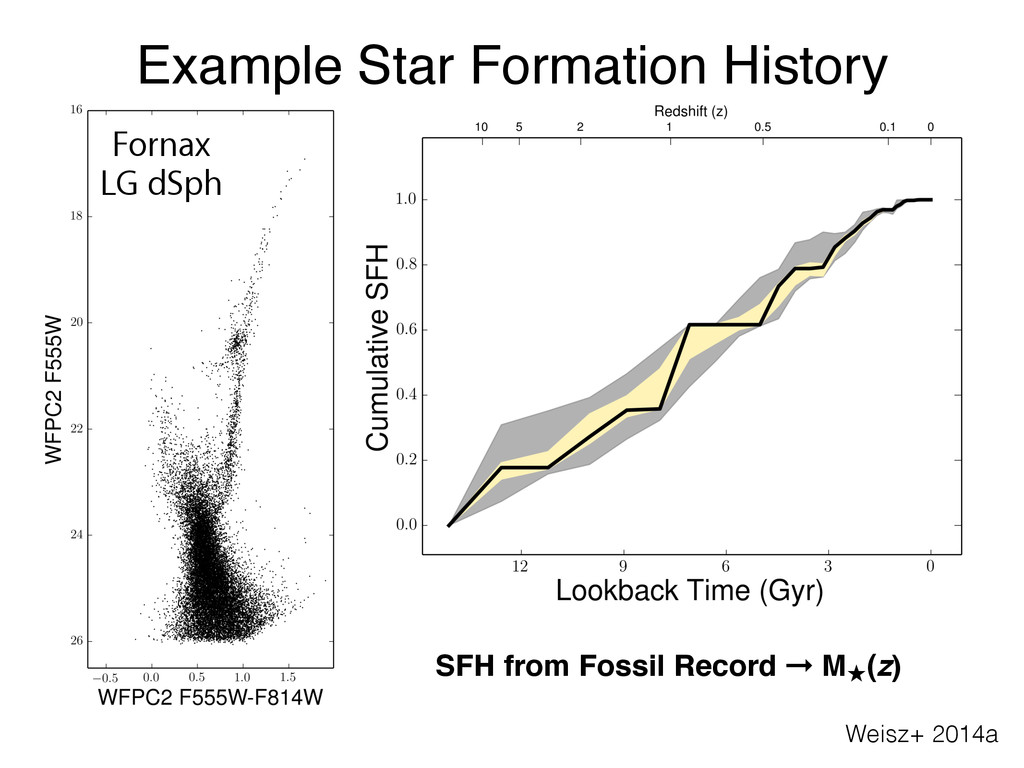
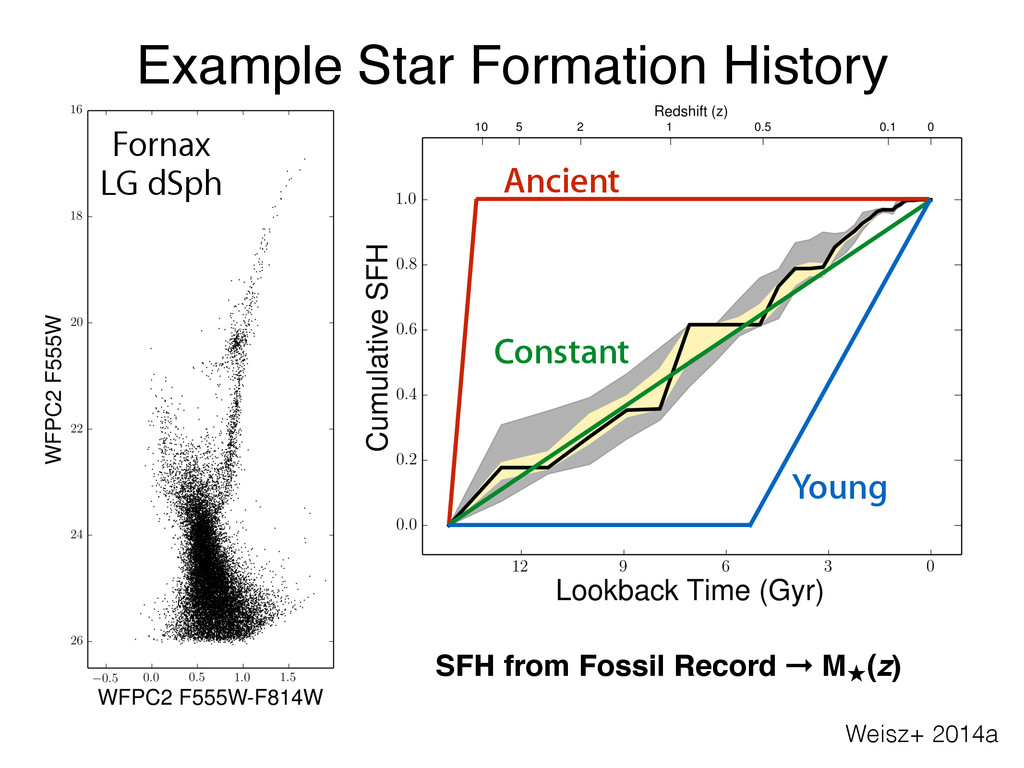
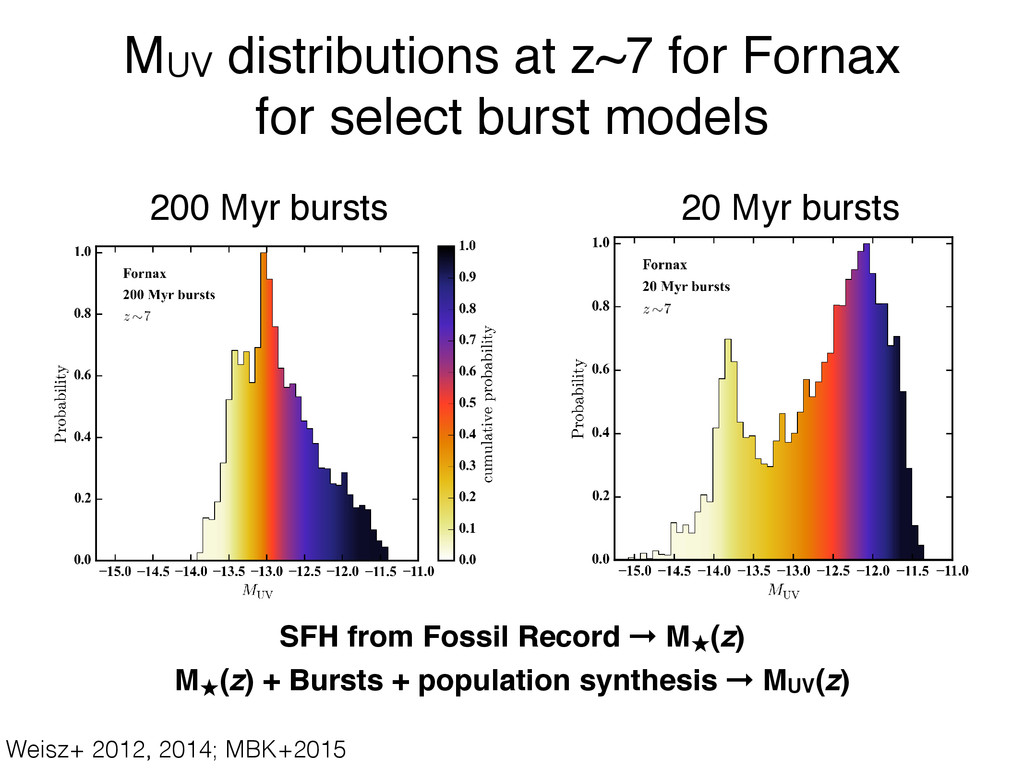
of Finkelstein et al. and assuming that th a characteristic timescale of 20 Myr (left) or 200 Myr (right). The colors nel. In the case of 20 Myr bursts, the frequent and relatively high-amplitude n (with peaks corresponding to the burst and inter-burst periods). The 200 udes, result in a distribution that is less broad and is unimodal. This is a for 200 Myr bursts; the resulting SFH is therefore much closer to the fiducial z = 7 in each realization results in a cumulative distribution that is very Median=mode, 2 magnitude spread 4 M. Boylan-Kolchin et al. Figure 2. Probability distribution for M UV of Fornax, given the pho Fornax’s high-redshift star formation occurred in bursts with a char indicate the cumulative probability distribution in each panel. In th bursts result in a bimodal probability distribution function (with p Myr bursts, which are modeled with smaller burst amplitudes, res direct consequence of our smaller assumed burst amplitude for 200 M constant SFH. Taking the instantaneous value of M UV at z = 7 in similar to that shown here in each case. Median≠mode, 3 magnitude spread, bimodal distribution MBK et al. 2015 MUV distributions at z~7 for Fornax for select burst models 200 Myr bursts 20 Myr bursts SFH from Fossil Record ➞ M★ (z) M★ (z) + Bursts + population synthesis ➞ MUV(z) Weisz+ 2012, 2014; MBK+2015
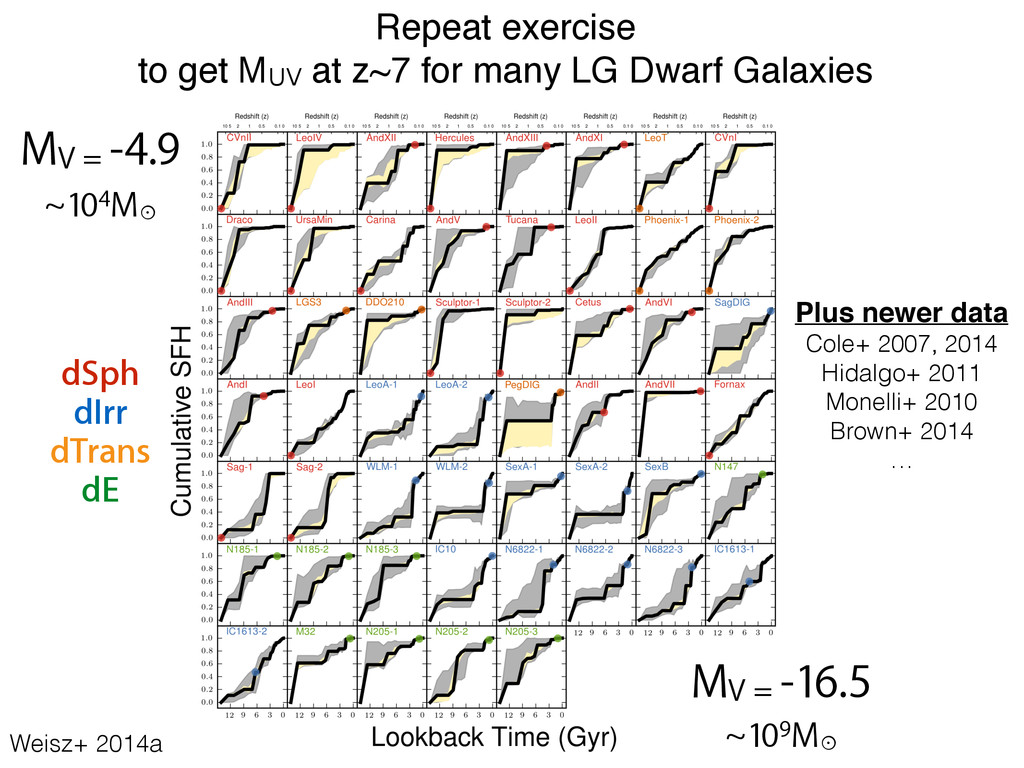
~104M⊙ ~109M⊙ Repeat exercise to get MUV at z~7 for many LG Dwarf Galaxies Weisz+ 2014a Plus newer data Cole+ 2007, 2014 Hidalgo+ 2011 Monelli+ 2010 Brown+ 2014 …
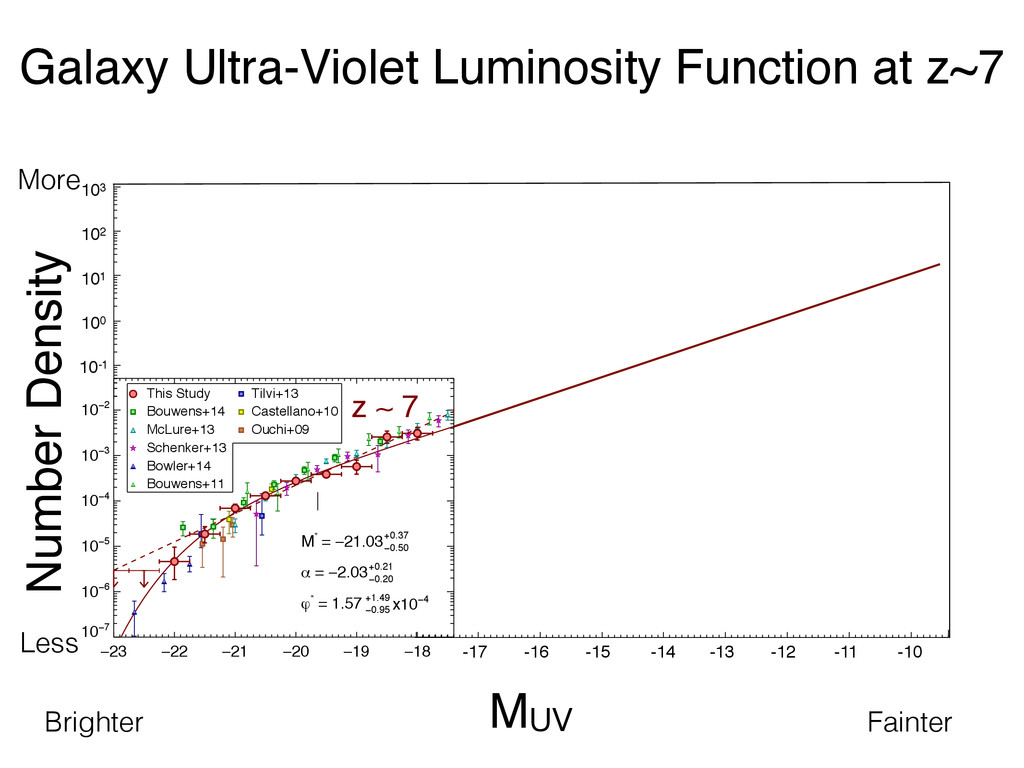
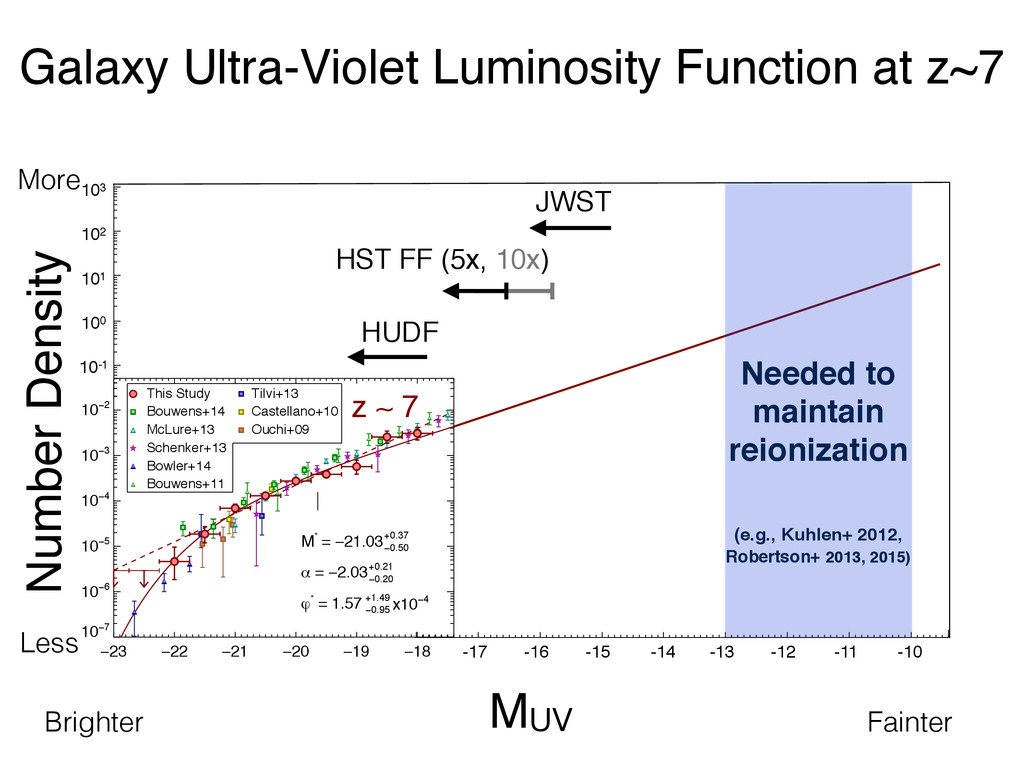
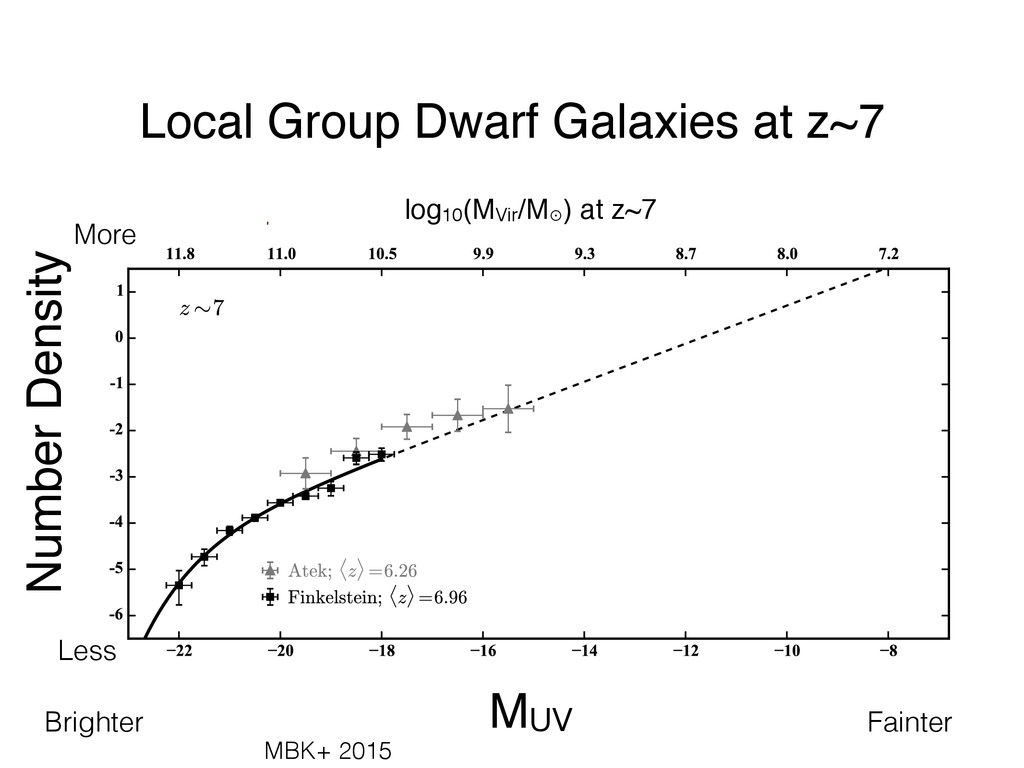
of Local Group dwarfs look like at high redshift? How will galaxies that are observable with current and future observatories evolve to the present day? MBK, Weisz, et al. 2015 Number Density MUV Brighter Fainter Less More Local Group Dwarf Galaxies at z~7 log10(MVir/M⊙ ) at z~7 MBK+ 2015
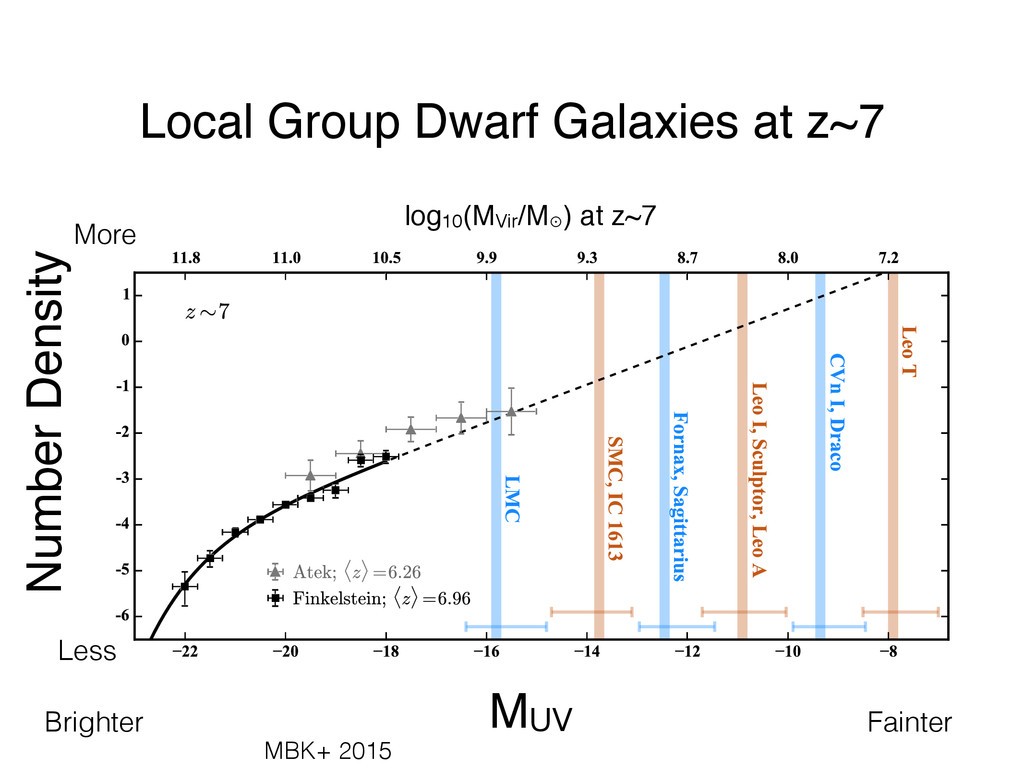
of Local Group dwarfs look like at high redshift? How will galaxies that are observable with current and future observatories evolve to the present day? MBK, Weisz, et al. 2015 Number Density MUV Brighter Fainter Less More Local Group Dwarf Galaxies at z~7 log10(MVir/M⊙ ) at z~7 MBK+ 2015
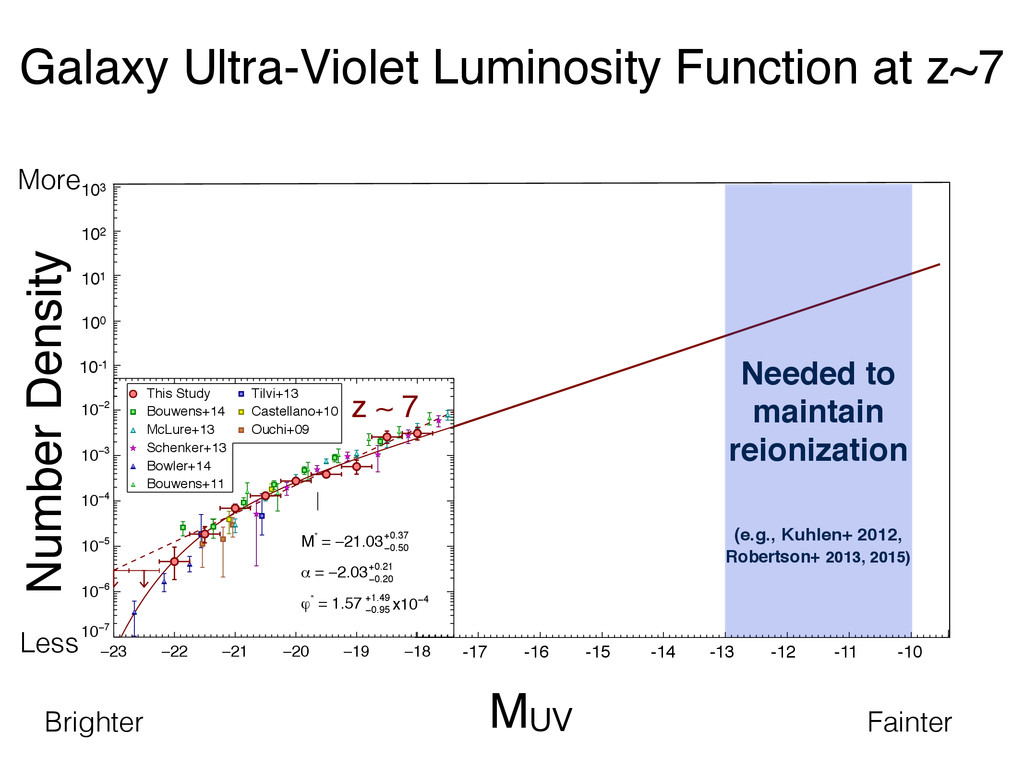
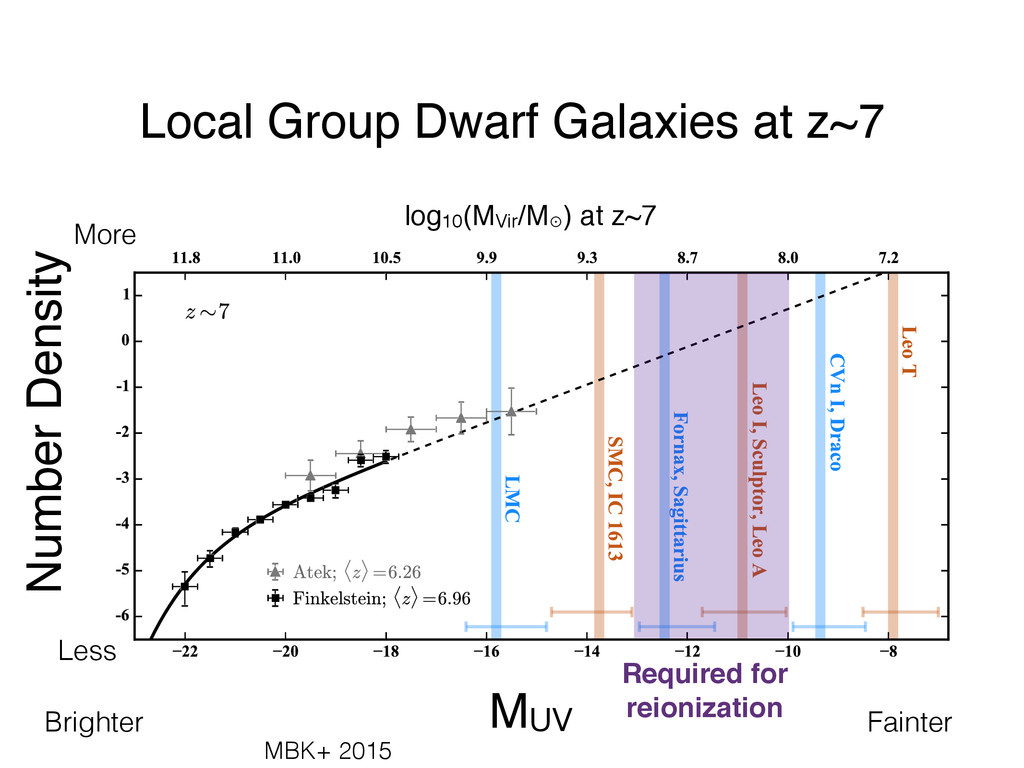
of Local Group dwarfs look like at high redshift? How will galaxies that are observable with current and future observatories evolve to the present day? MBK, Weisz, et al. 2015 Number Density MUV Brighter Fainter Less More Required for reionization Local Group Dwarf Galaxies at z~7 log10(MVir/M⊙ ) at z~7 MBK+ 2015
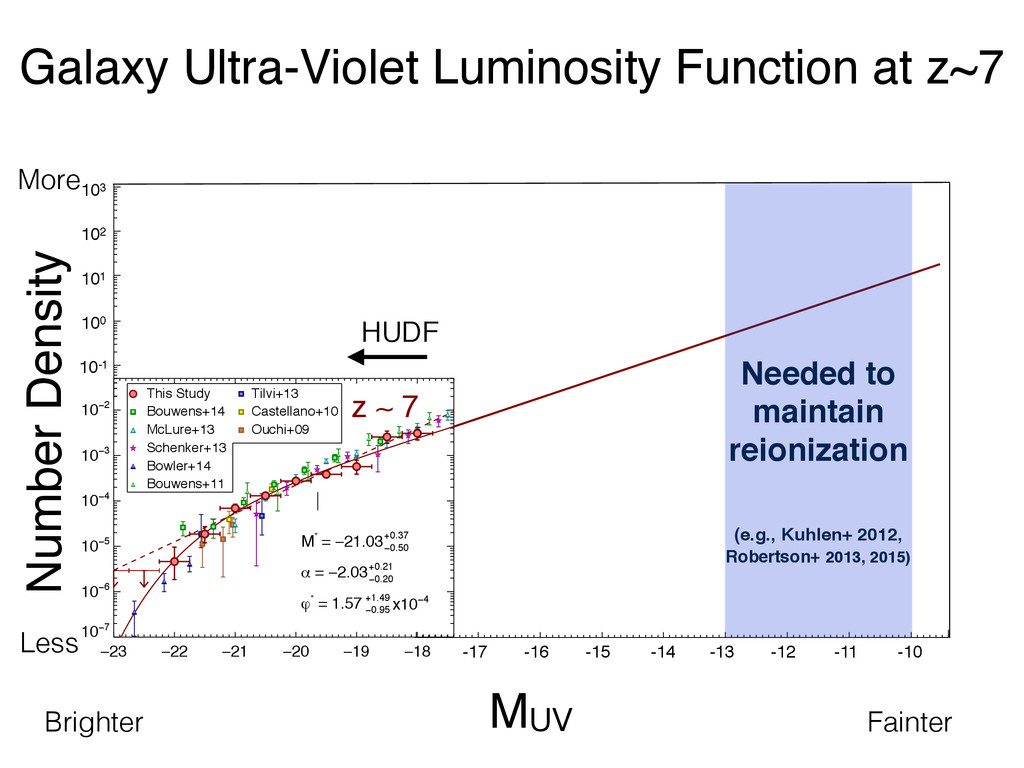
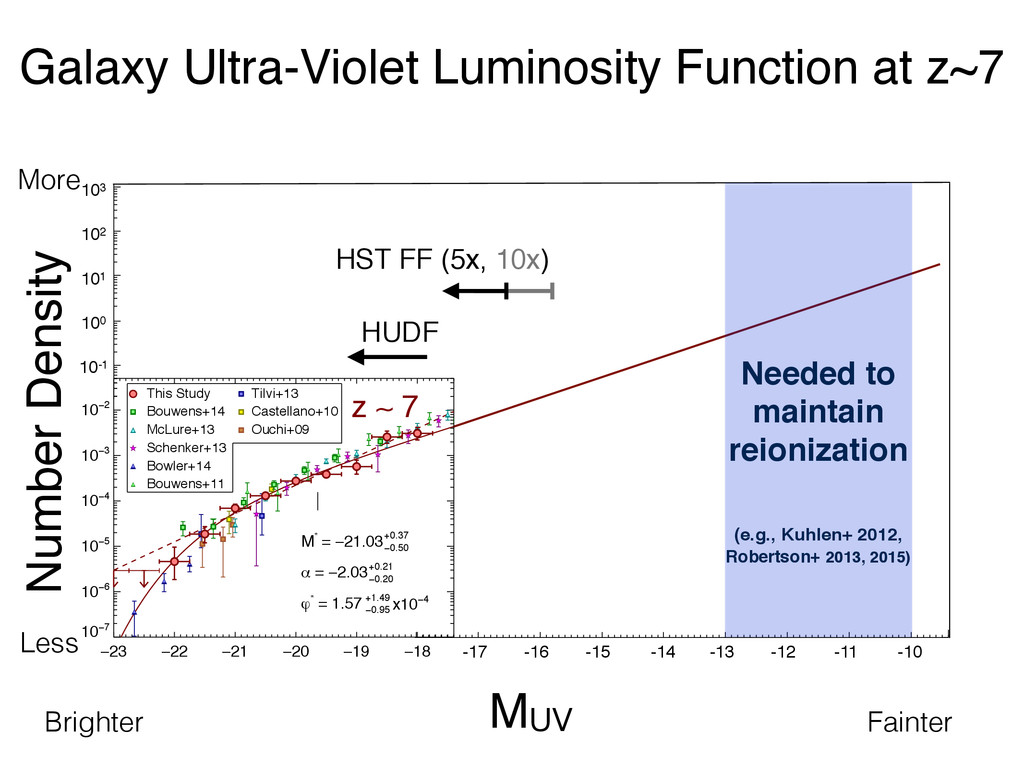
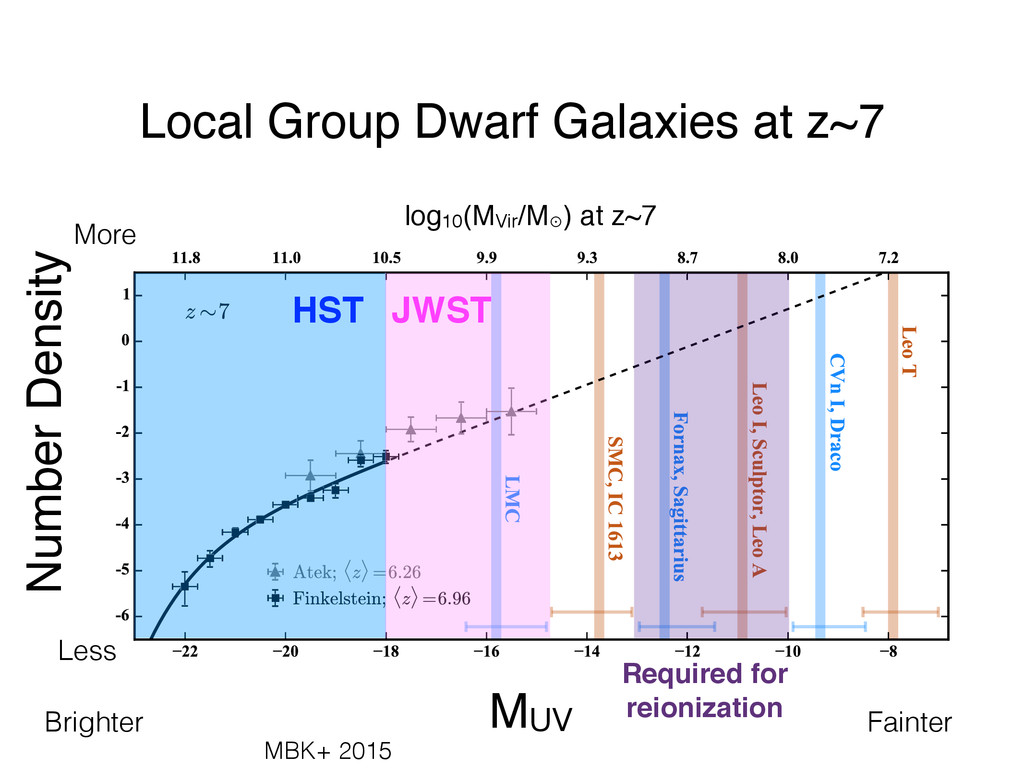
of Local Group dwarfs look like at high redshift? How will galaxies that are observable with current and future observatories evolve to the present day? MBK, Weisz, et al. 2015 Number Density MUV Brighter Fainter Less More Required for reionization HST JWST Local Group Dwarf Galaxies at z~7 log10(MVir/M⊙ ) at z~7 MBK+ 2015
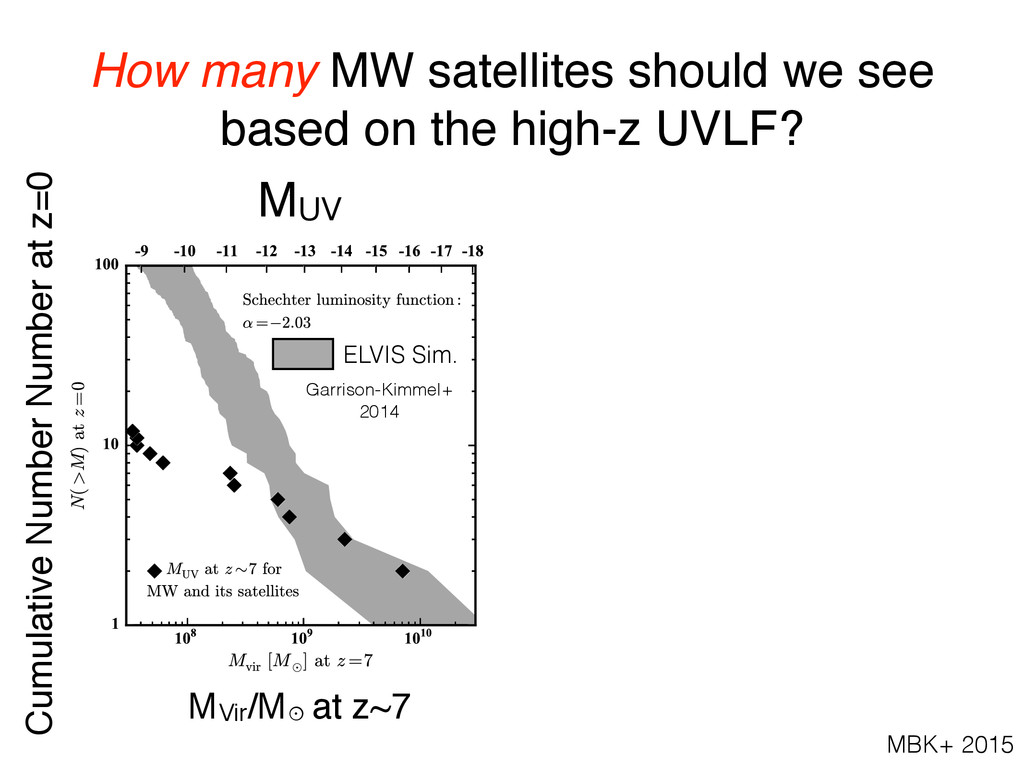
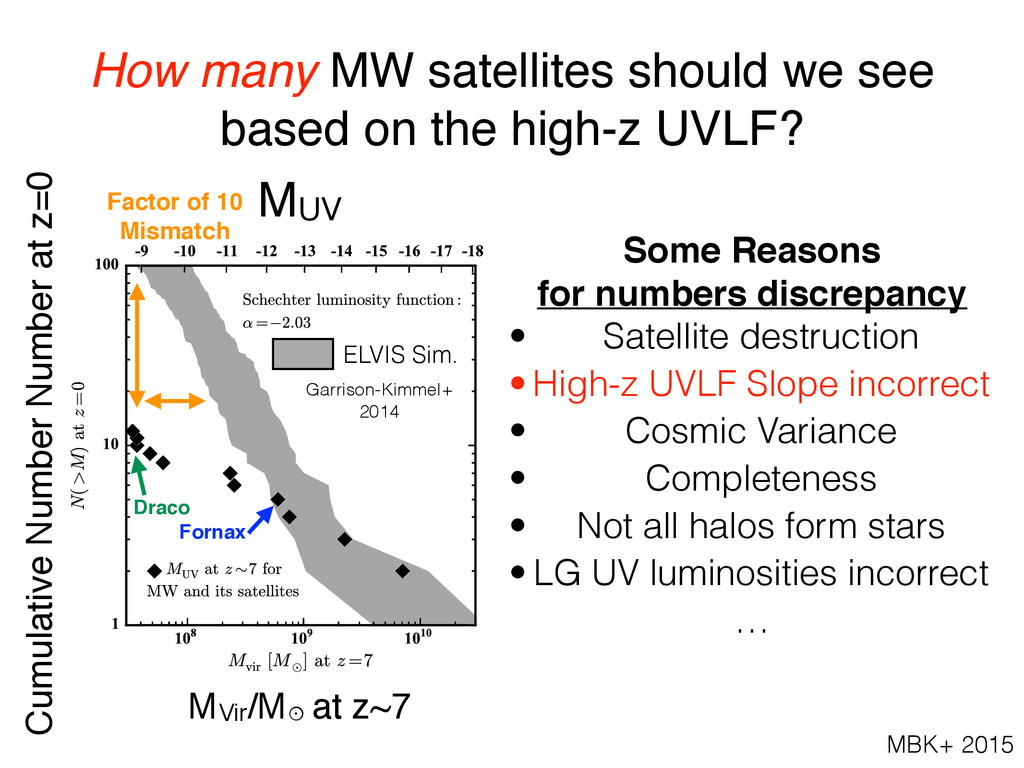
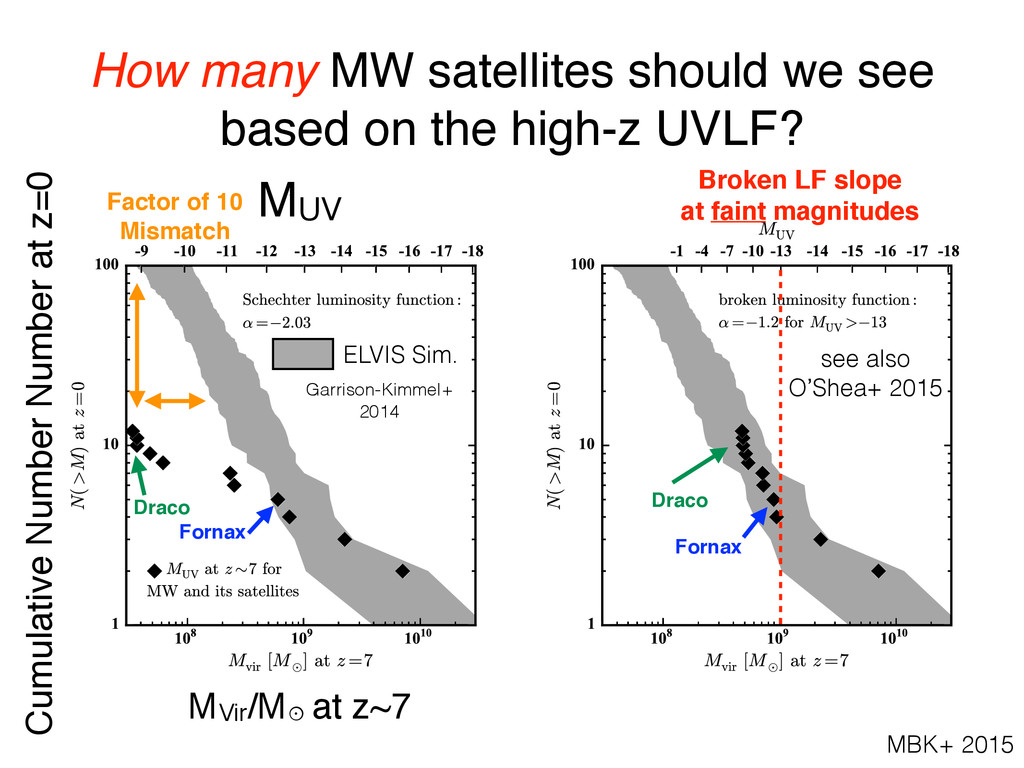
7 mass function of the main progenitors of surviving z = 0 (sub)halos – including the main progenitor of the MW itself – within 300 kpc of the Milky Way based on the ELVIS simulations (shaded region). The upper horizontal axis gives the Figure 6. Similar to Figure 5, but assumes a UV luminosity function that breaks to ↵ = 1.2 at M UV > 13 (from the fiducial value of ↵ = 2.03 for brighter galaxies). The z = 7 census of galaxies surviving to z = 0 in the Milky Way is in How many MW satellites should we see based on the high-z UVLF? MVir/M⊙ at z~7 Cumulative Number Number at z=0 ELVIS Sim. Garrison-Kimmel+ 2014 MUV MBK+ 2015
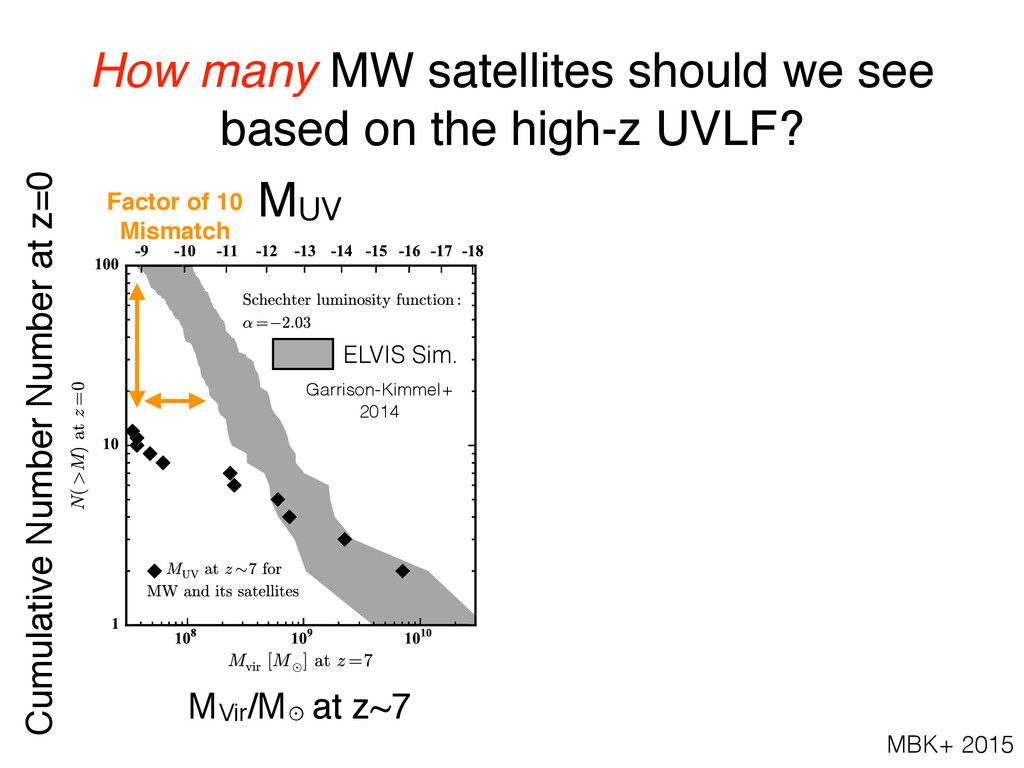
7 mass function of the main progenitors of surviving z = 0 (sub)halos – including the main progenitor of the MW itself – within 300 kpc of the Milky Way based on the ELVIS simulations (shaded region). The upper horizontal axis gives the Figure 6. Similar to Figure 5, but assumes a UV luminosity function that breaks to ↵ = 1.2 at M UV > 13 (from the fiducial value of ↵ = 2.03 for brighter galaxies). The z = 7 census of galaxies surviving to z = 0 in the Milky Way is in How many MW satellites should we see based on the high-z UVLF? Cumulative Number Number at z=0 ELVIS Sim. Garrison-Kimmel+ 2014 Factor of 10 Mismatch MVir/M⊙ at z~7 MUV MBK+ 2015
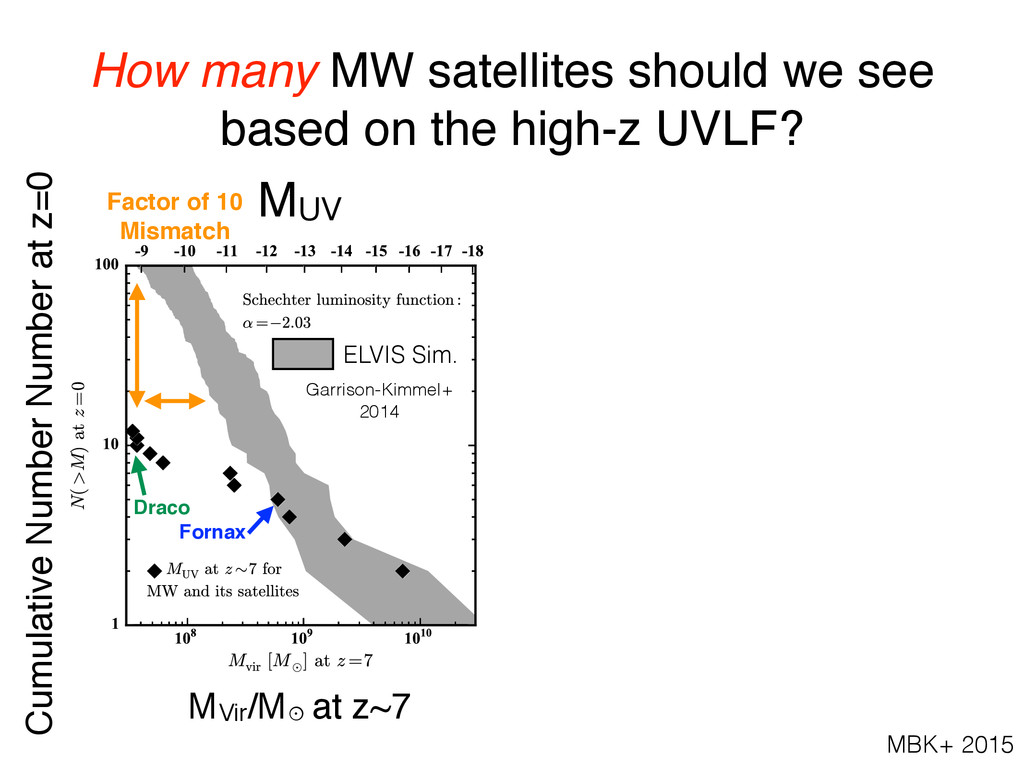
7 mass function of the main progenitors of surviving z = 0 (sub)halos – including the main progenitor of the MW itself – within 300 kpc of the Milky Way based on the ELVIS simulations (shaded region). The upper horizontal axis gives the Figure 6. Similar to Figure 5, but assumes a UV luminosity function that breaks to ↵ = 1.2 at M UV > 13 (from the fiducial value of ↵ = 2.03 for brighter galaxies). The z = 7 census of galaxies surviving to z = 0 in the Milky Way is in How many MW satellites should we see based on the high-z UVLF? Cumulative Number Number at z=0 ELVIS Sim. Garrison-Kimmel+ 2014 Factor of 10 Mismatch Draco MVir/M⊙ at z~7 MUV MBK+ 2015 Fornax
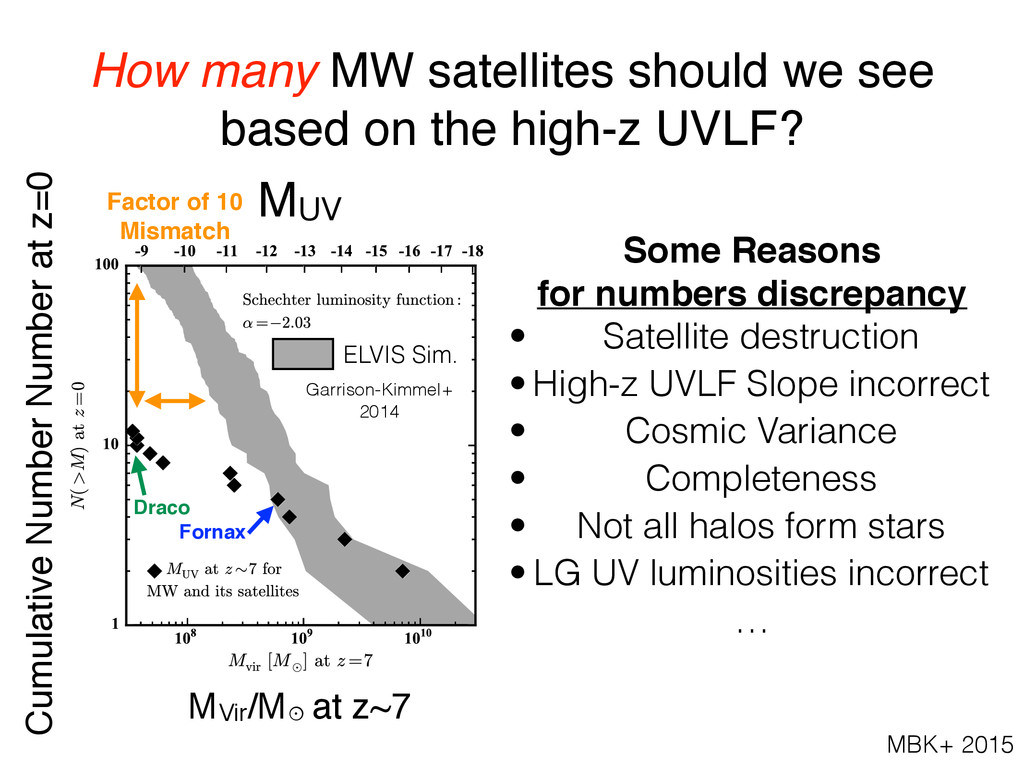
7 mass function of the main progenitors of surviving z = 0 (sub)halos – including the main progenitor of the MW itself – within 300 kpc of the Milky Way based on the ELVIS simulations (shaded region). The upper horizontal axis gives the Figure 6. Similar to Figure 5, but assumes a UV luminosity function that breaks to ↵ = 1.2 at M UV > 13 (from the fiducial value of ↵ = 2.03 for brighter galaxies). The z = 7 census of galaxies surviving to z = 0 in the Milky Way is in How many MW satellites should we see based on the high-z UVLF? Cumulative Number Number at z=0 ELVIS Sim. Garrison-Kimmel+ 2014 Factor of 10 Mismatch Draco Some Reasons for numbers discrepancy • Satellite destruction • High-z UVLF Slope incorrect • Cosmic Variance • Completeness • Not all halos form stars • LG UV luminosities incorrect … MVir/M⊙ at z~7 MUV MBK+ 2015 Fornax
7 mass function of the main progenitors of surviving z = 0 (sub)halos – including the main progenitor of the MW itself – within 300 kpc of the Milky Way based on the ELVIS simulations (shaded region). The upper horizontal axis gives the Figure 6. Similar to Figure 5, but assumes a UV luminosity function that breaks to ↵ = 1.2 at M UV > 13 (from the fiducial value of ↵ = 2.03 for brighter galaxies). The z = 7 census of galaxies surviving to z = 0 in the Milky Way is in How many MW satellites should we see based on the high-z UVLF? Cumulative Number Number at z=0 ELVIS Sim. Garrison-Kimmel+ 2014 Factor of 10 Mismatch Draco Some Reasons for numbers discrepancy • Satellite destruction • High-z UVLF Slope incorrect • Cosmic Variance • Completeness • Not all halos form stars • LG UV luminosities incorrect … MVir/M⊙ at z~7 MUV MBK+ 2015 Fornax
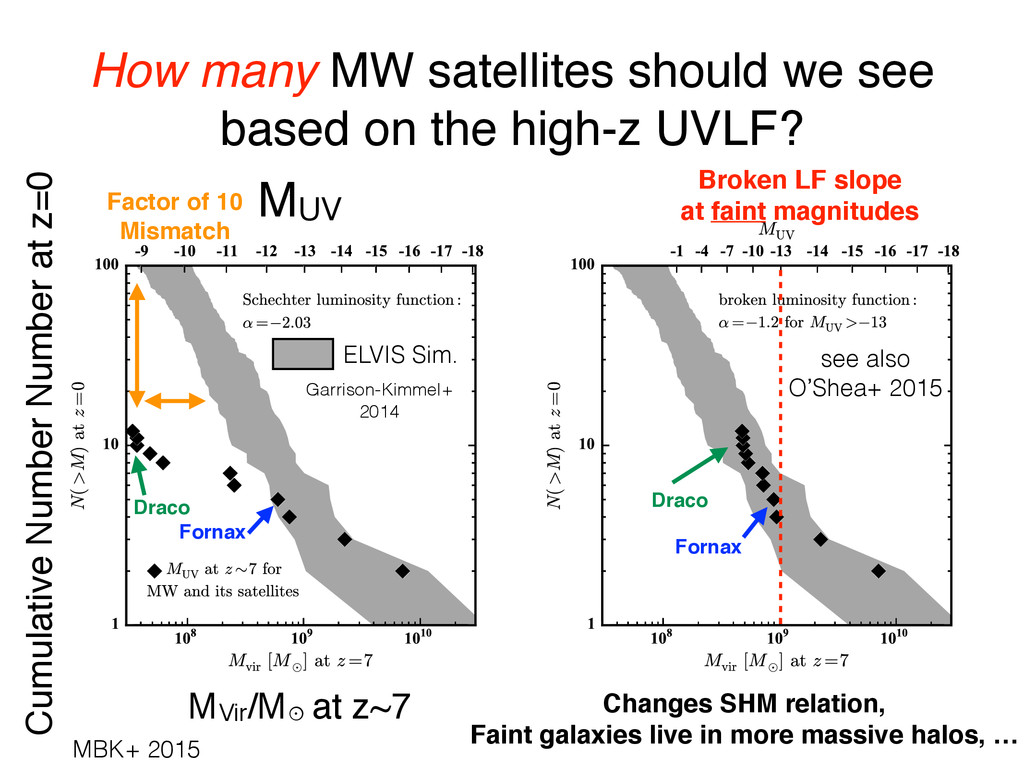
7 mass function of the main progenitors of surviving z = 0 (sub)halos – including the main progenitor of the MW itself – within 300 kpc of the Milky Way based on the ELVIS simulations (shaded region). The upper horizontal axis gives the Figure 6. Similar to Figure 5, but assumes a UV luminosity function that breaks to ↵ = 1.2 at M UV > 13 (from the fiducial value of ↵ = 2.03 for brighter galaxies). The z = 7 census of galaxies surviving to z = 0 in the Milky Way is in How many MW satellites should we see based on the high-z UVLF? Cumulative Number Number at z=0 ELVIS Sim. Garrison-Kimmel+ 2014 Factor of 10 Mismatch Draco MVir/M⊙ at z~7 MUV Draco MBK+ 2015 see also O’Shea+ 2015 Broken LF slope at faint magnitudes Fornax Fornax
7 mass function of the main progenitors of surviving z = 0 (sub)halos – including the main progenitor of the MW itself – within 300 kpc of the Milky Way based on the ELVIS simulations (shaded region). The upper horizontal axis gives the Figure 6. Similar to Figure 5, but assumes a UV luminosity function that breaks to ↵ = 1.2 at M UV > 13 (from the fiducial value of ↵ = 2.03 for brighter galaxies). The z = 7 census of galaxies surviving to z = 0 in the Milky Way is in How many MW satellites should we see based on the high-z UVLF? Cumulative Number Number at z=0 ELVIS Sim. Garrison-Kimmel+ 2014 Factor of 10 Mismatch Draco Fornax MVir/M⊙ at z~7 MUV Draco Fornax Changes SHM relation, Faint galaxies live in more massive halos, … Broken LF slope at faint magnitudes see also O’Shea+ 2015 MBK+ 2015
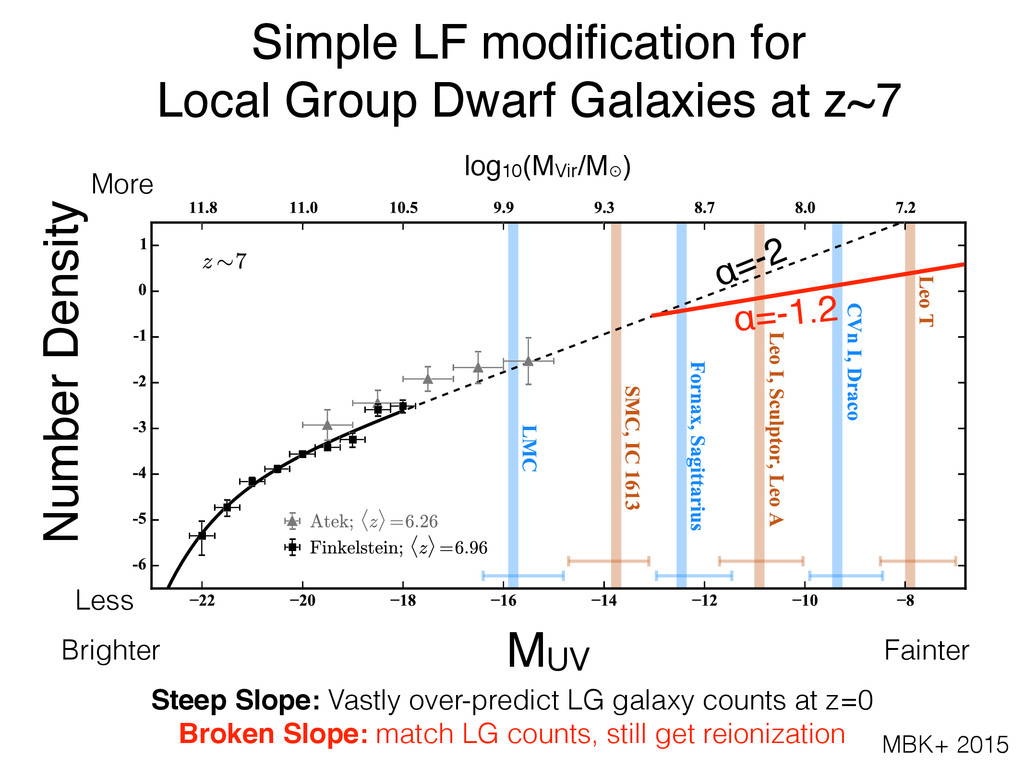
of Local Group dwarfs look like at high redshift? How will galaxies that are observable with current and future observatories evolve to the present day? MBK, Weisz, et al. 2015 Number Density Brighter Fainter Less More Simple LF modification for Local Group Dwarf Galaxies at z~7 log10(MVir/M⊙ ) α=-2 α=-1.2 Steep Slope: Vastly over-predict LG galaxy counts at z=0 Broken Slope: match LG counts, still get reionization MUV MBK+ 2015
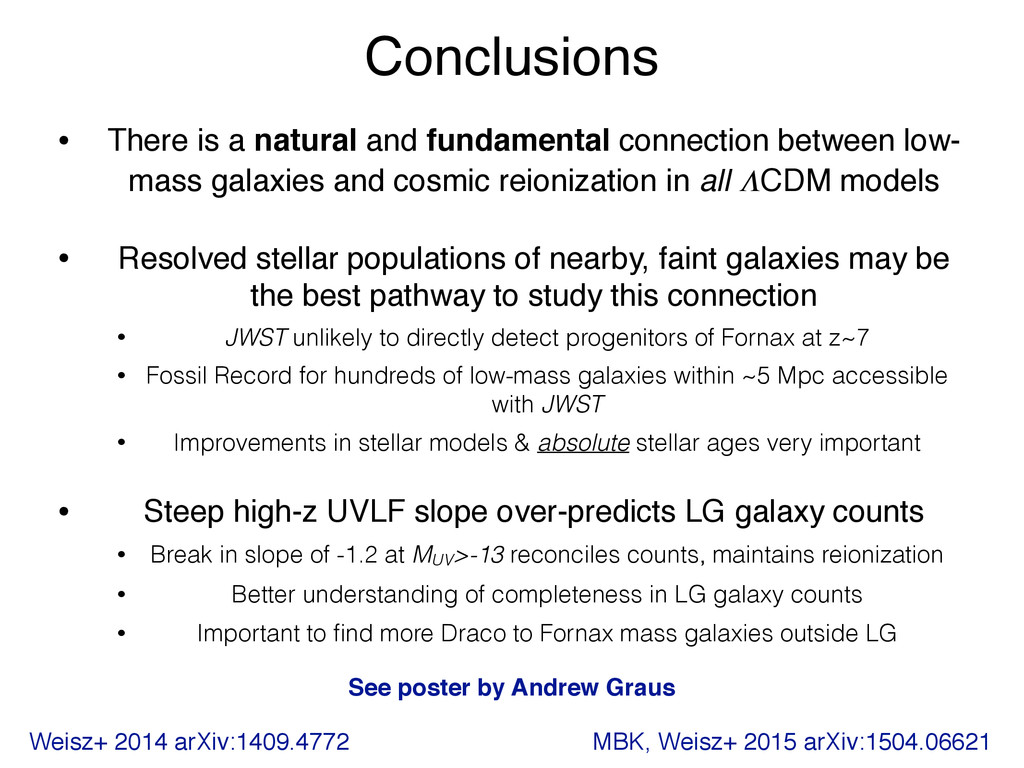
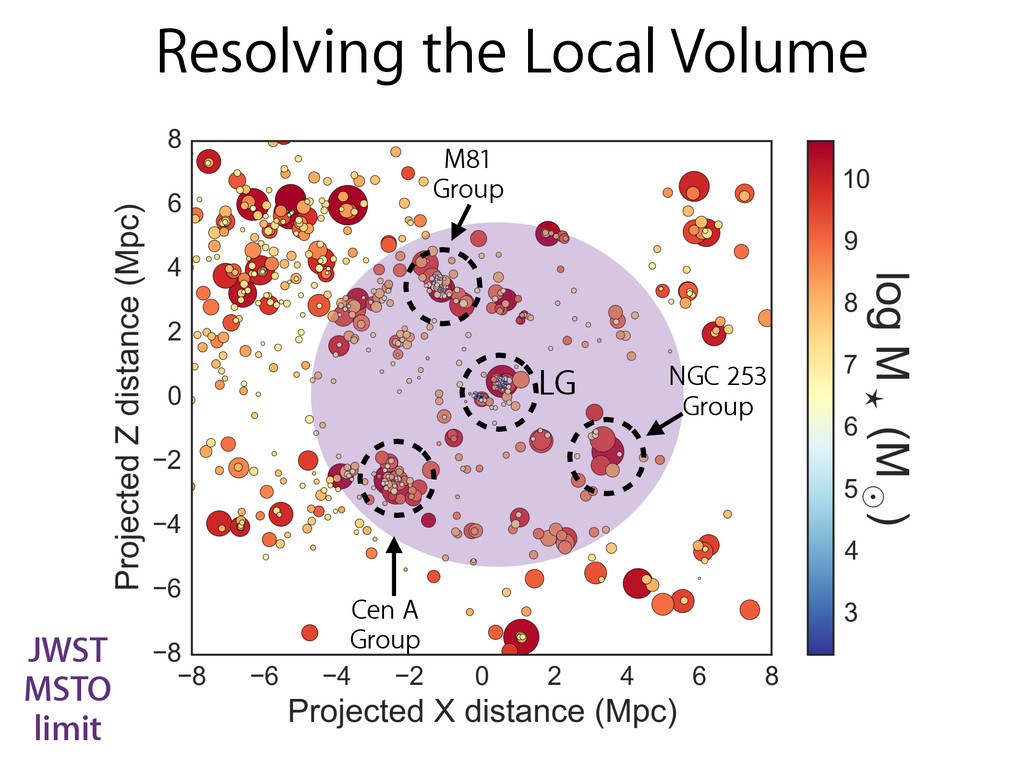
low- mass galaxies and cosmic reionization in all CDM models • Resolved stellar populations of nearby, faint galaxies may be the best pathway to study this connection • JWST unlikely to directly detect progenitors of Fornax at z~7 • Fossil Record for hundreds of low-mass galaxies within ~5 Mpc accessible with JWST • Improvements in stellar models & absolute stellar ages very important • Steep high-z UVLF slope over-predicts LG galaxy counts • Break in slope of -1.2 at MUV >-13 reconciles counts, maintains reionization • Better understanding of completeness in LG galaxy counts • Important to find more Draco to Fornax mass galaxies outside LG MBK, Weisz+ 2015 arXiv:1504.06621 Weisz+ 2014 arXiv:1409.4772 See poster by Andrew Graus