Upgrade to Pro — share decks privately, control downloads, hide ads and more …

Real-time driving score service using Flink

eastcirclek
September 04, 2018

Real-time driving score service using Flink

It is presented at FlinkForward 2018 Berlin

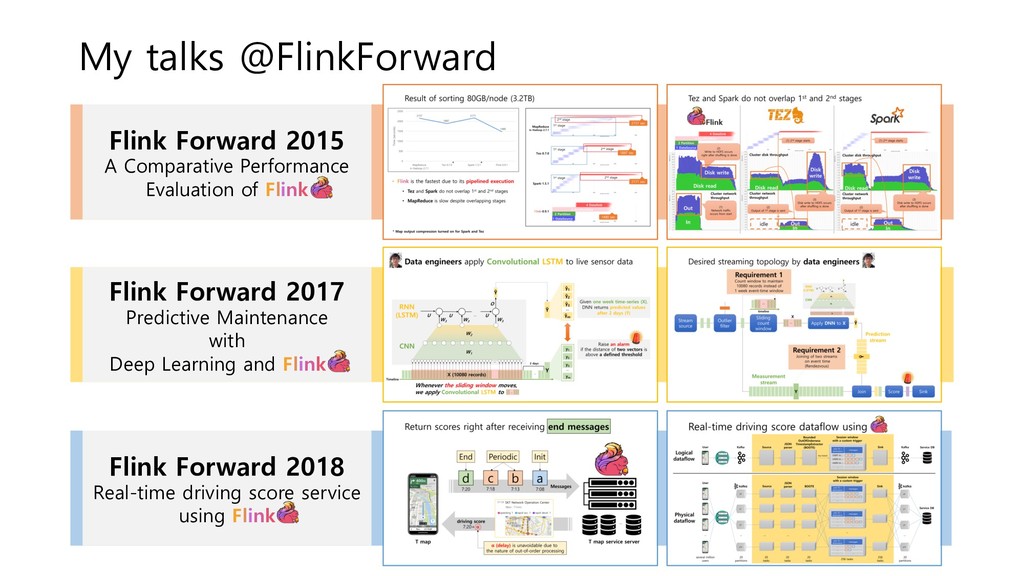
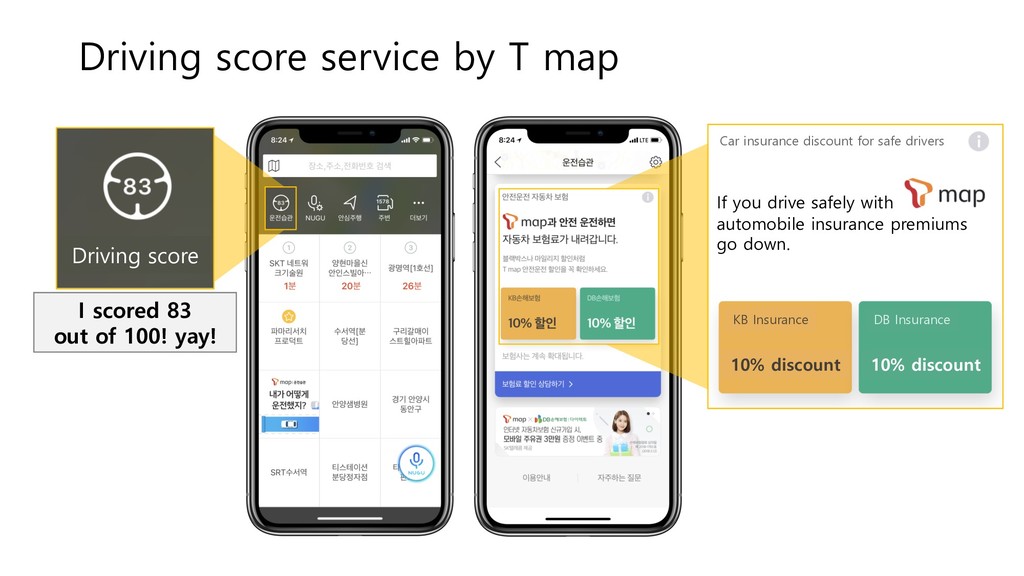
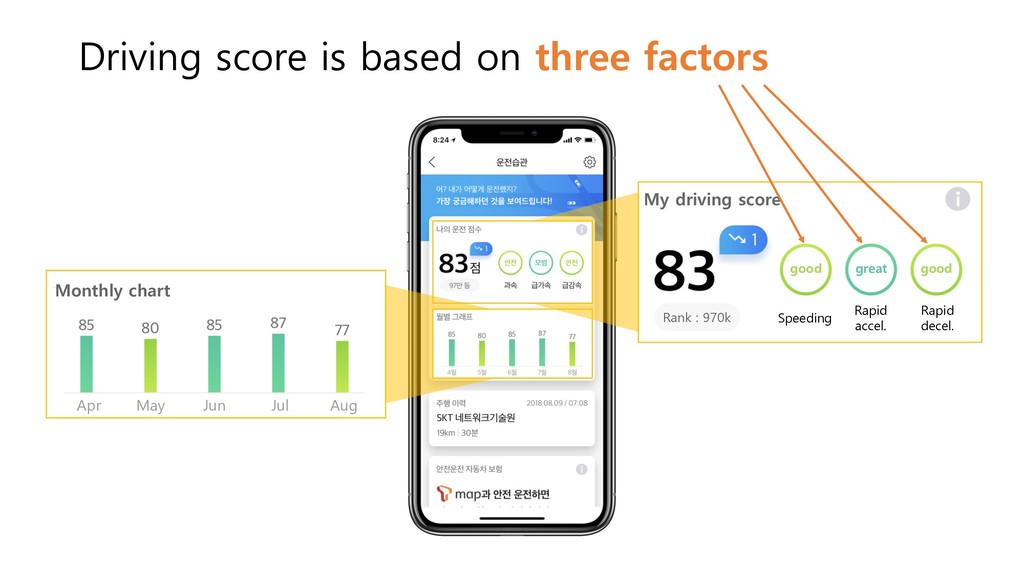
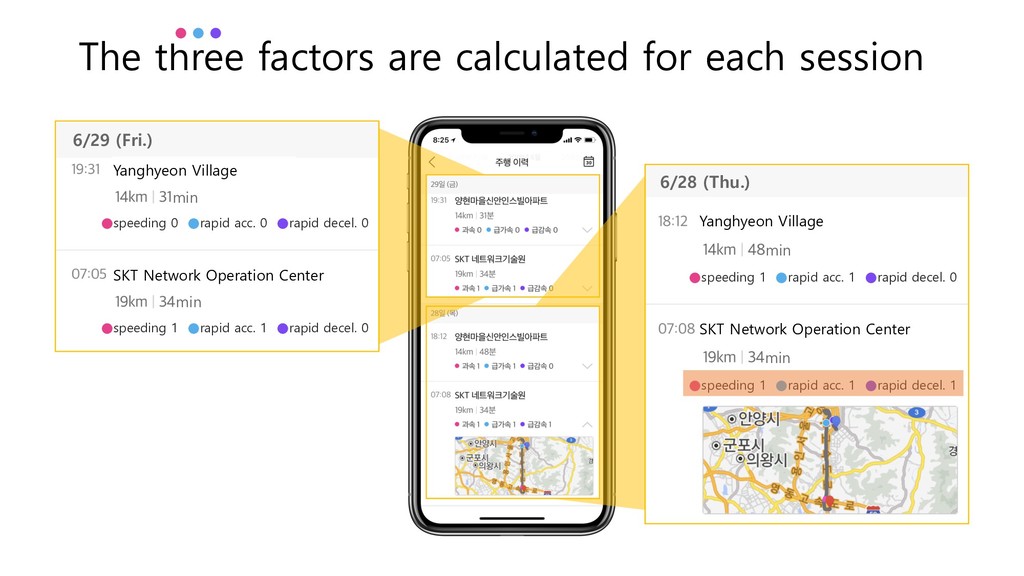
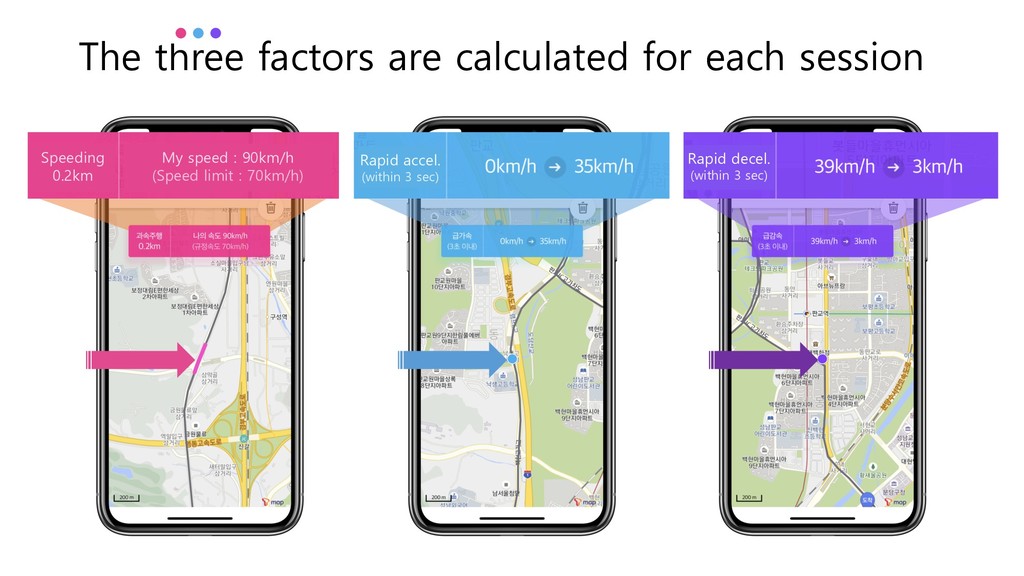
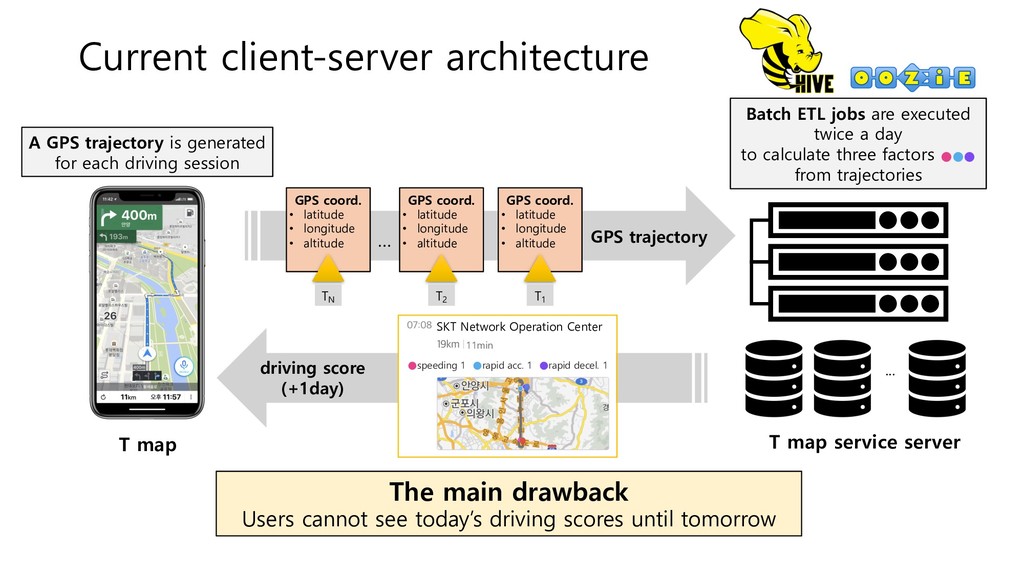
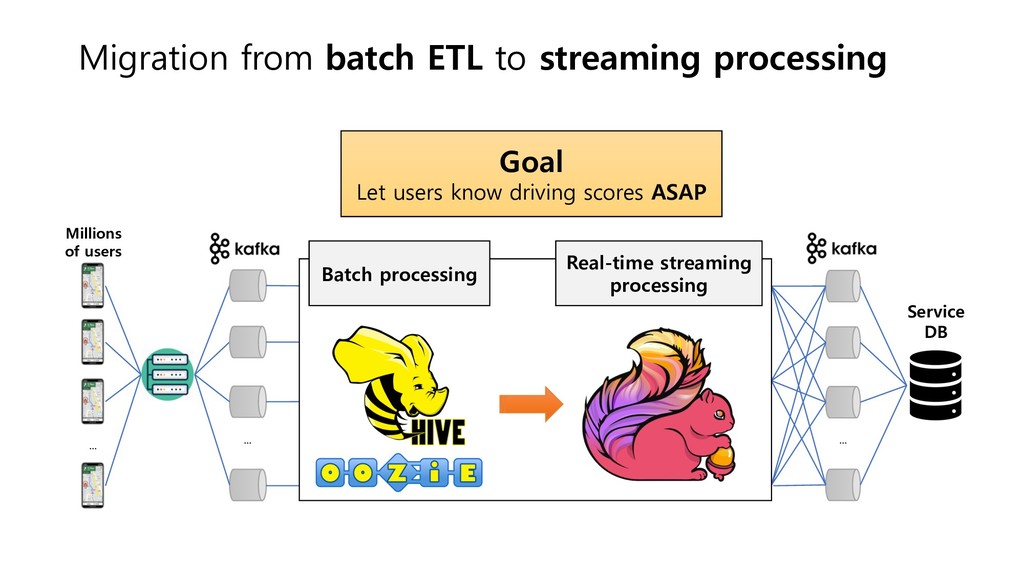
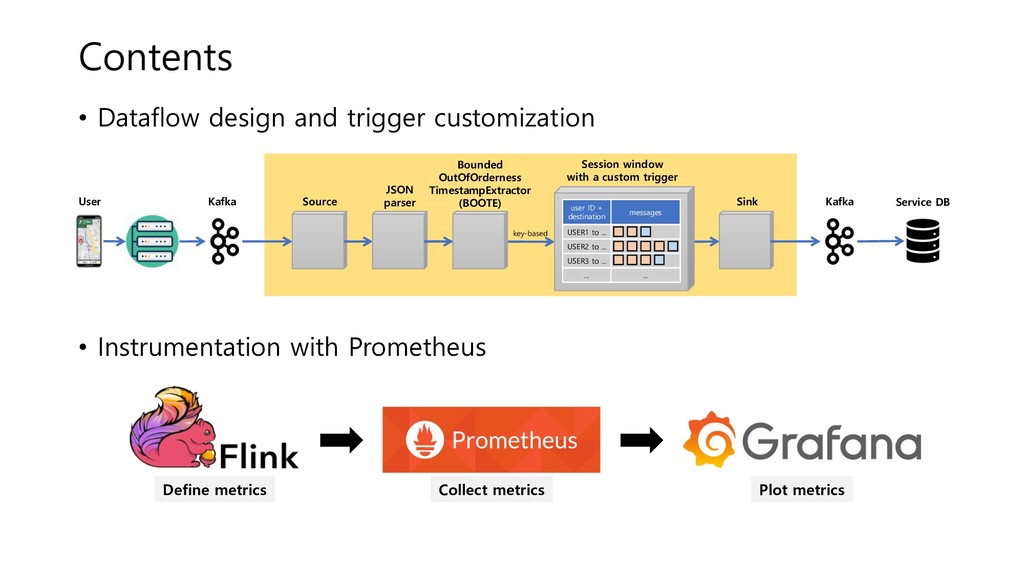
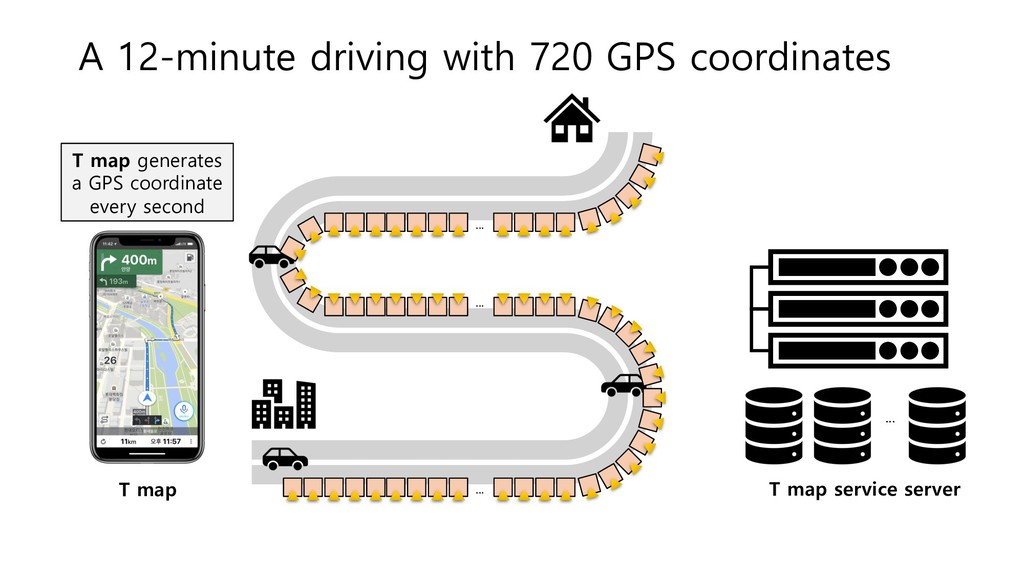
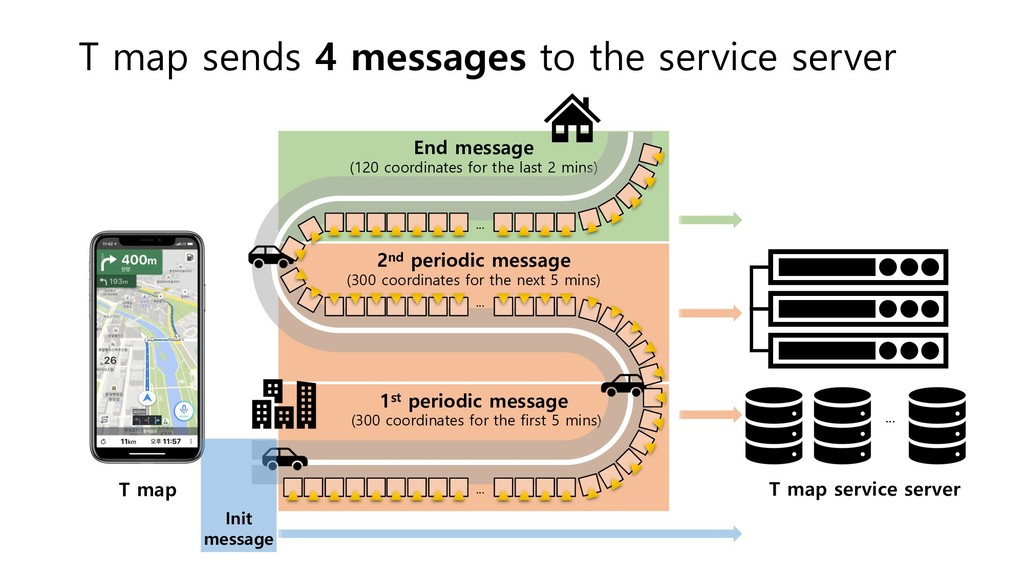
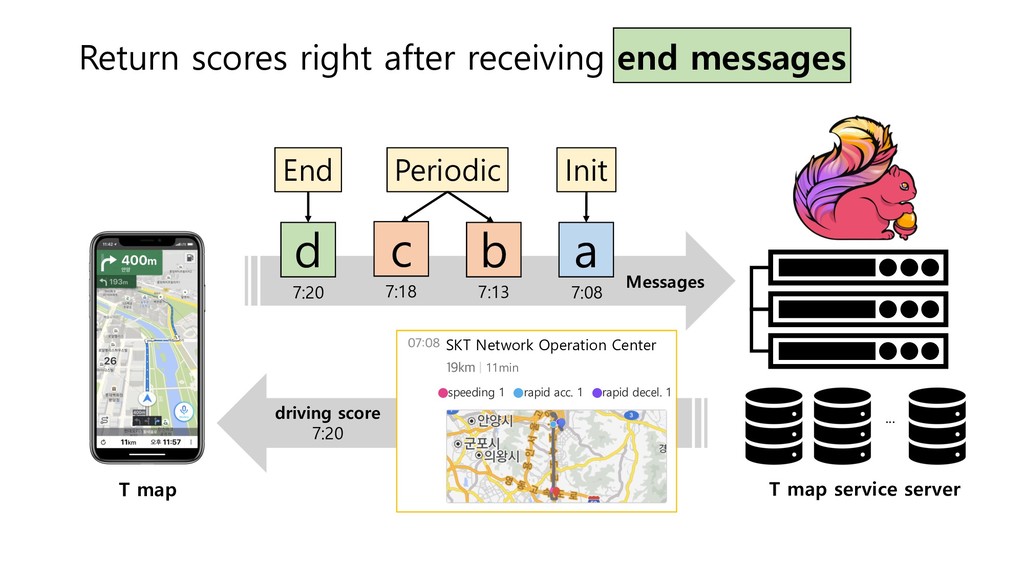
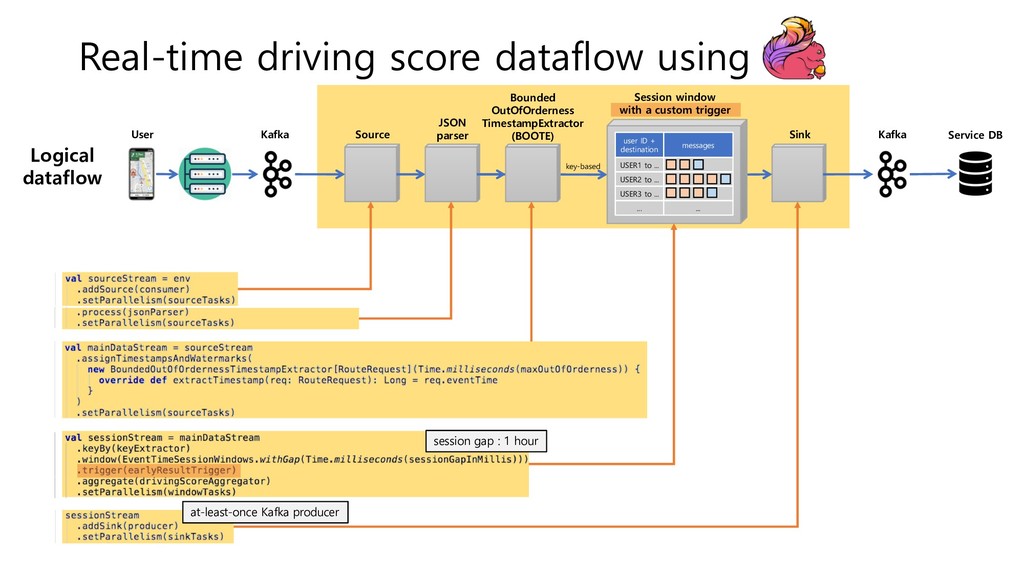
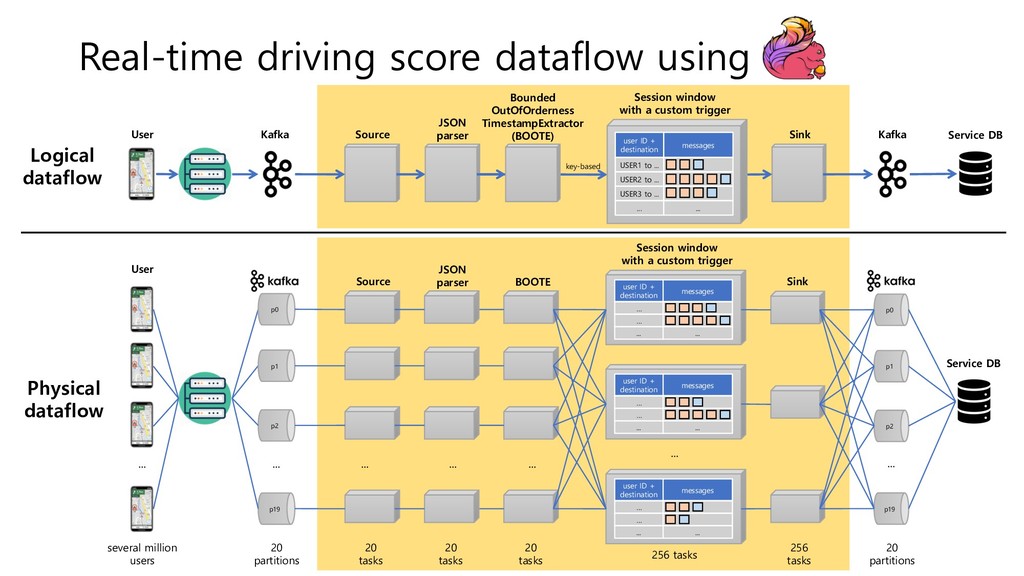
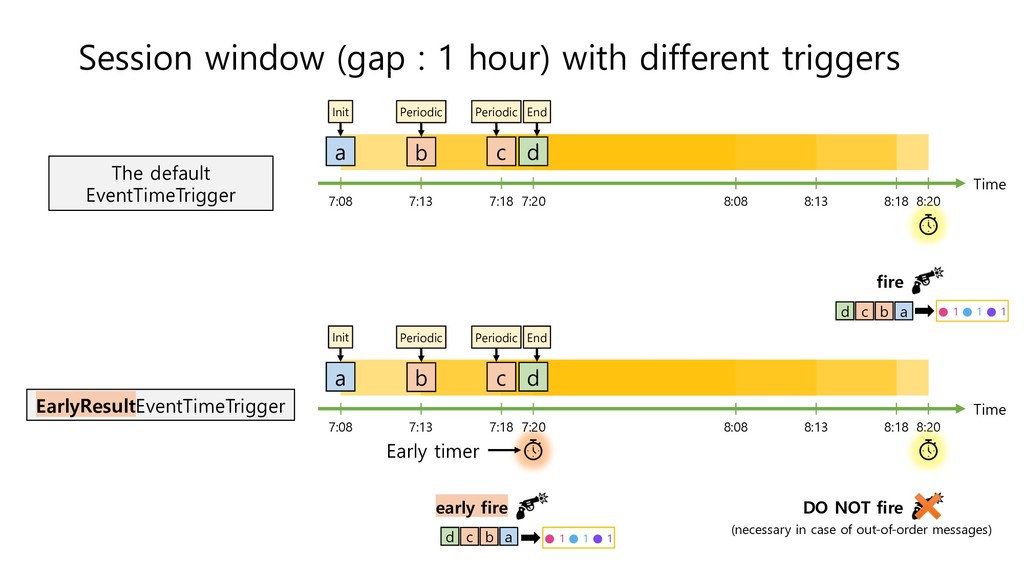
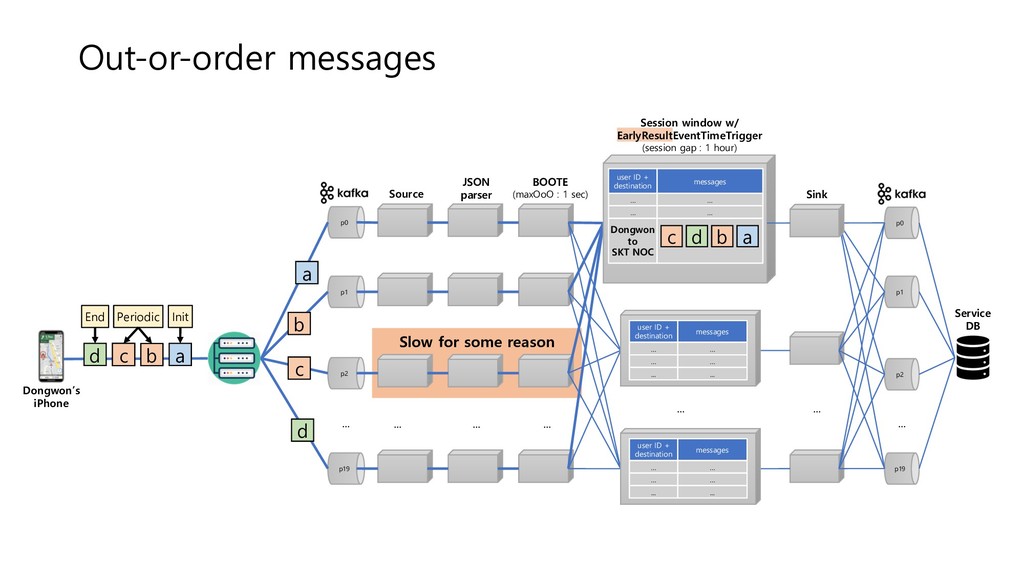
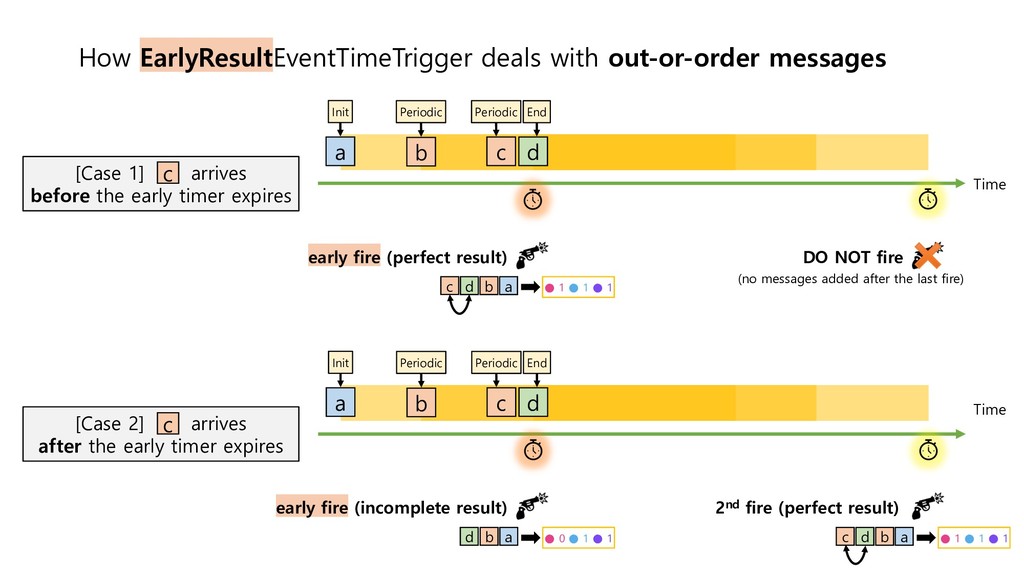
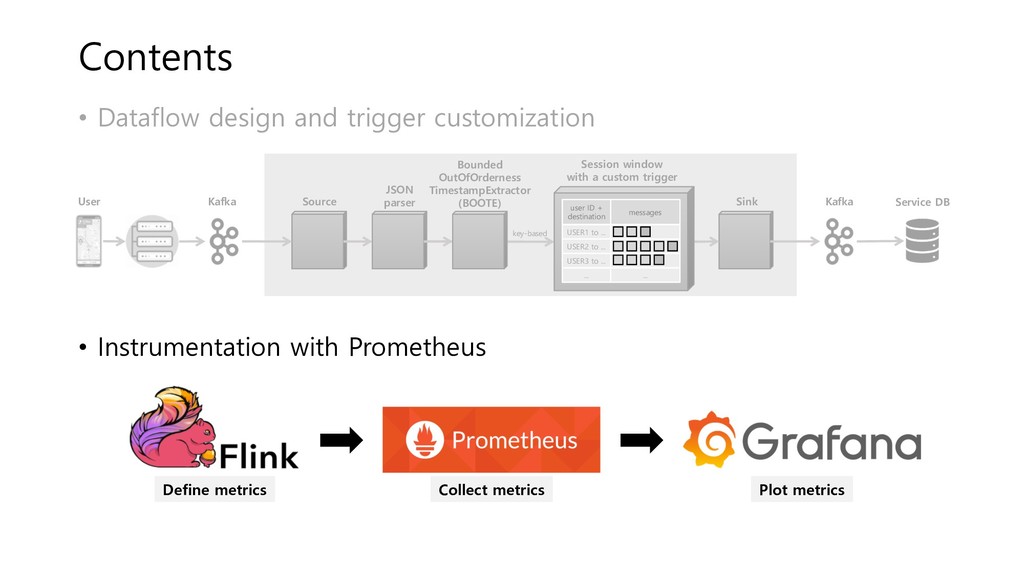
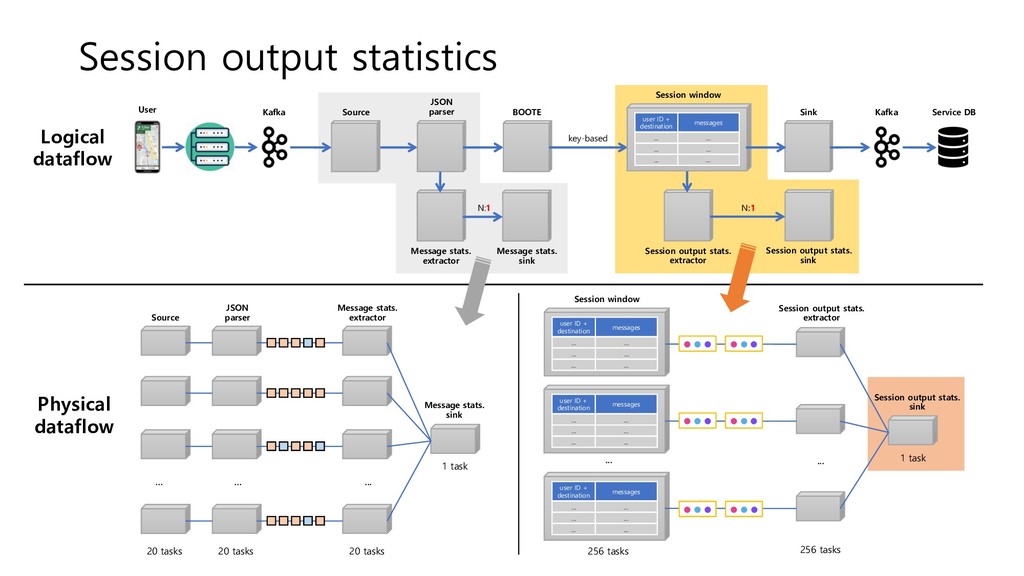
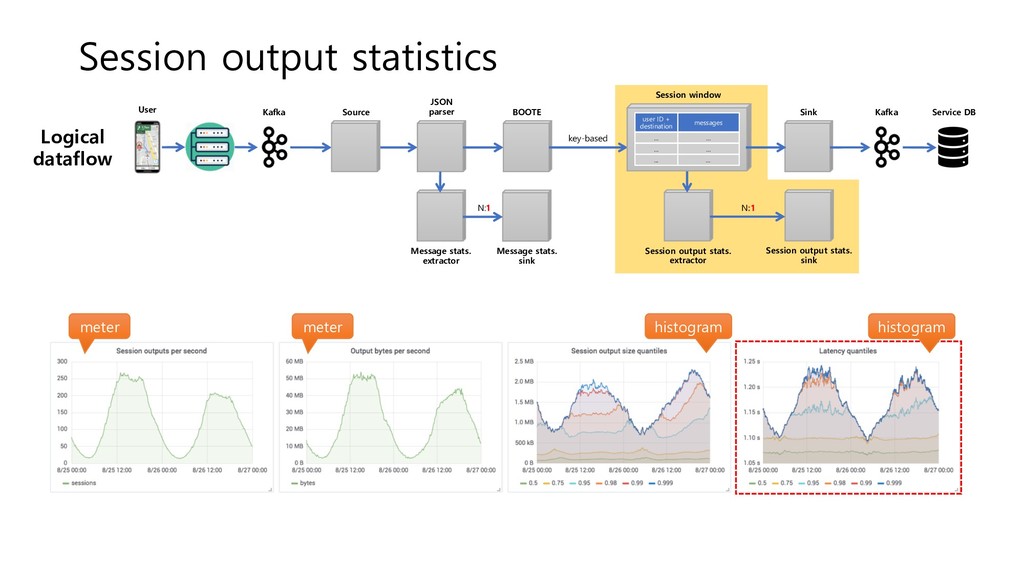
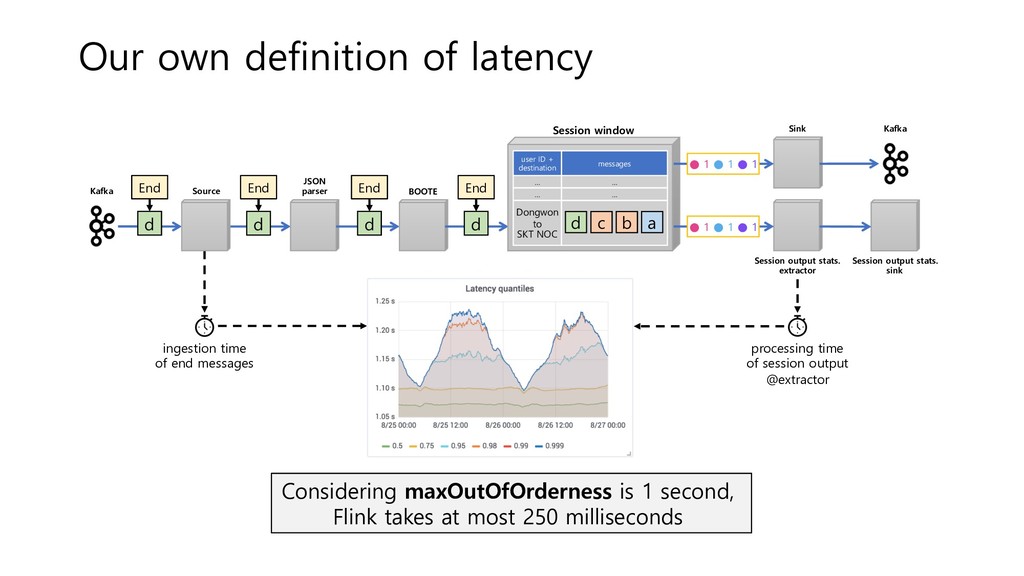
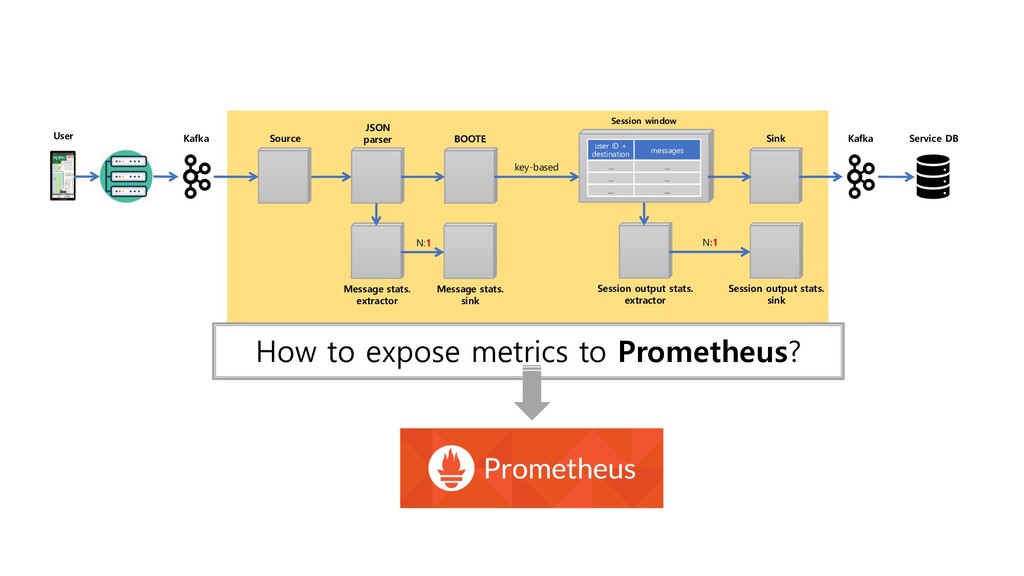
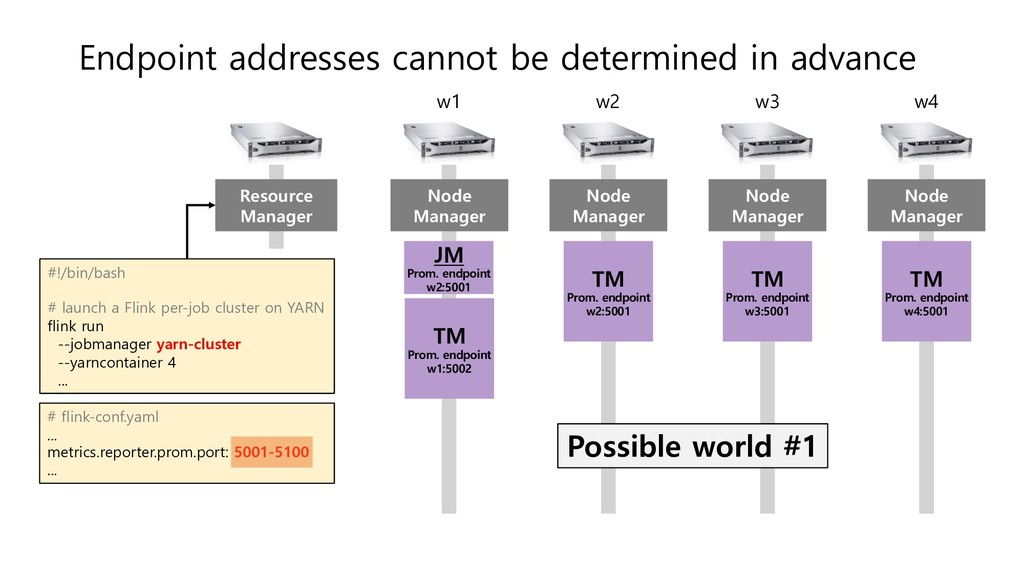
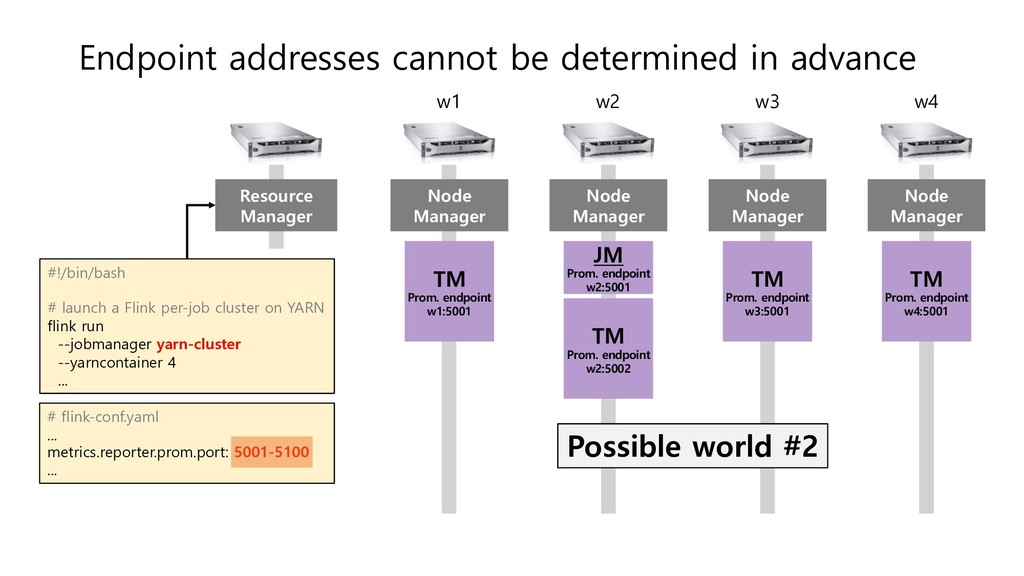
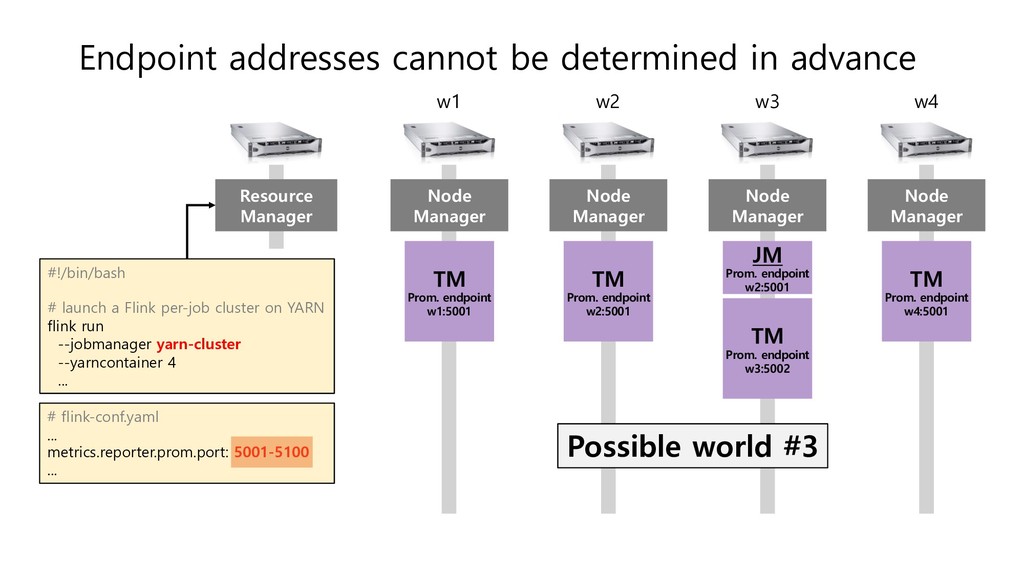
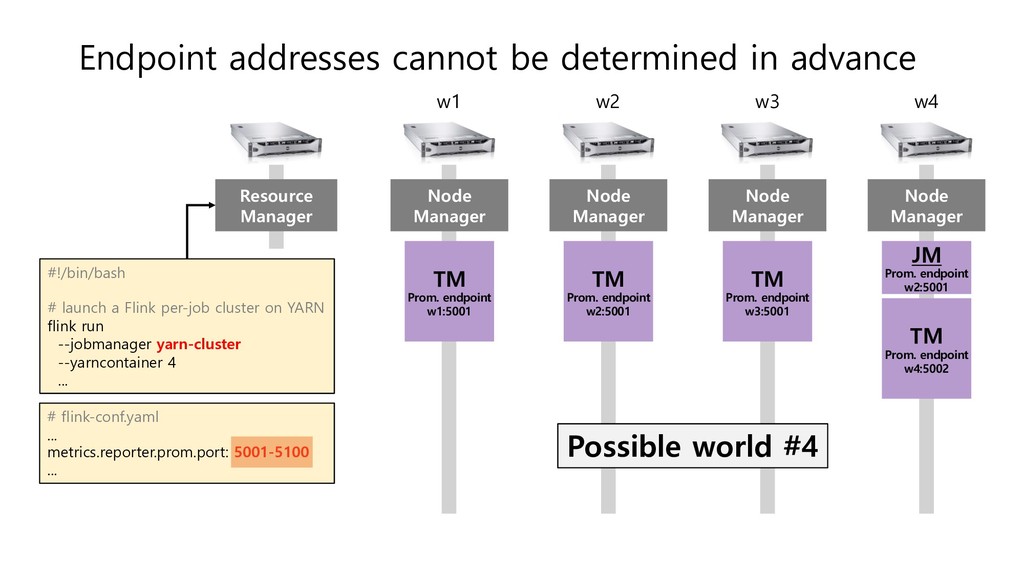
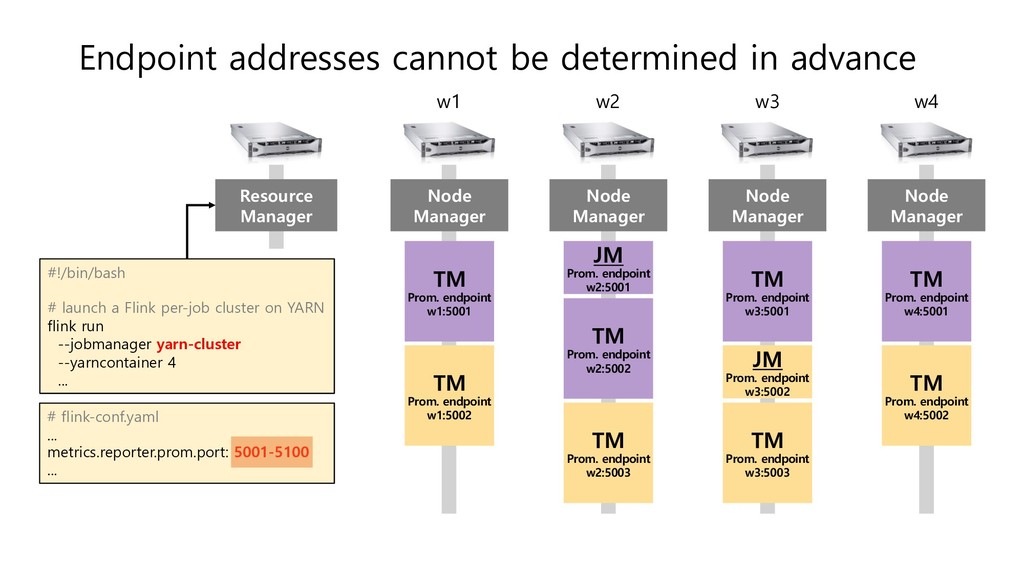
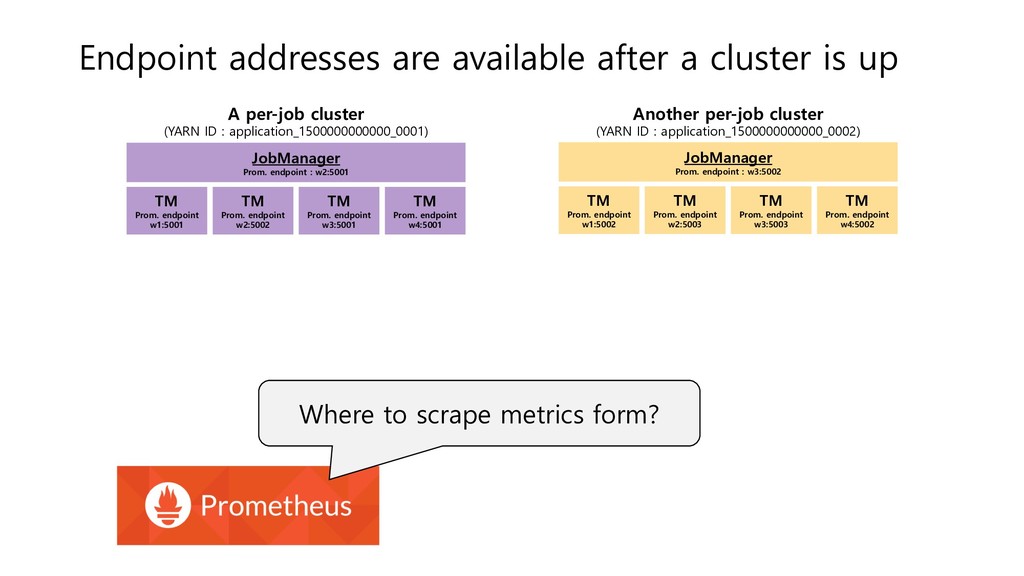
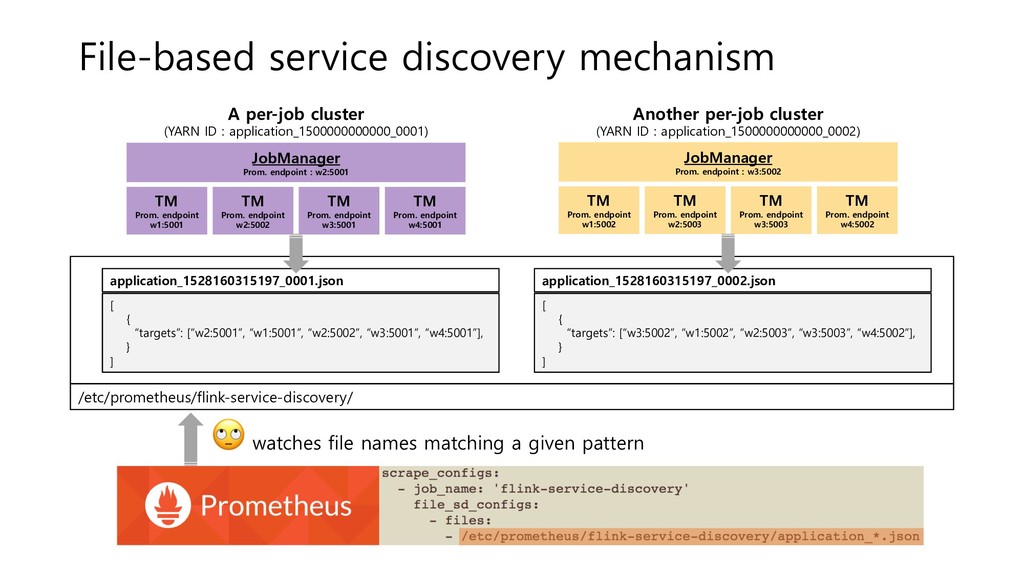
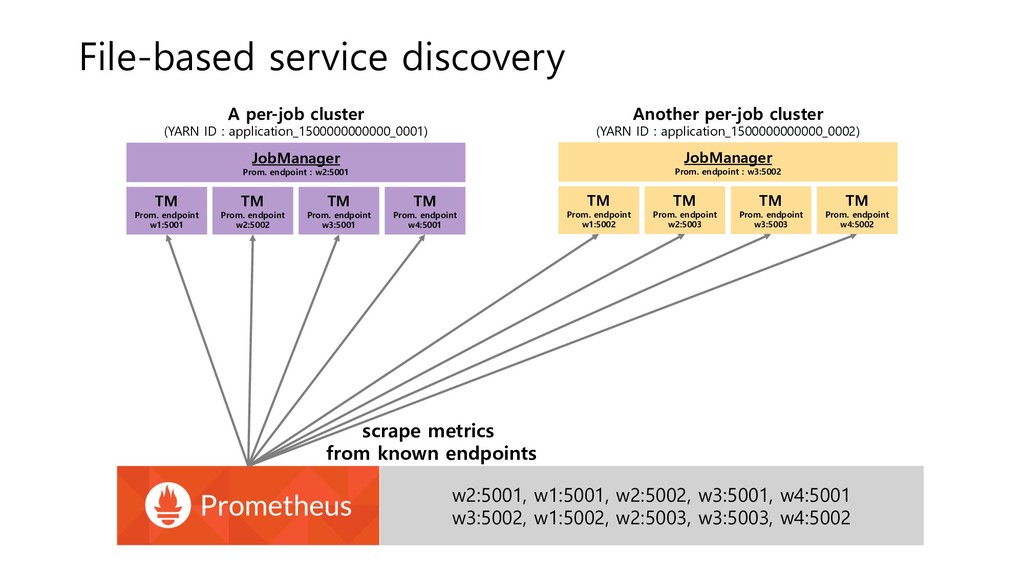
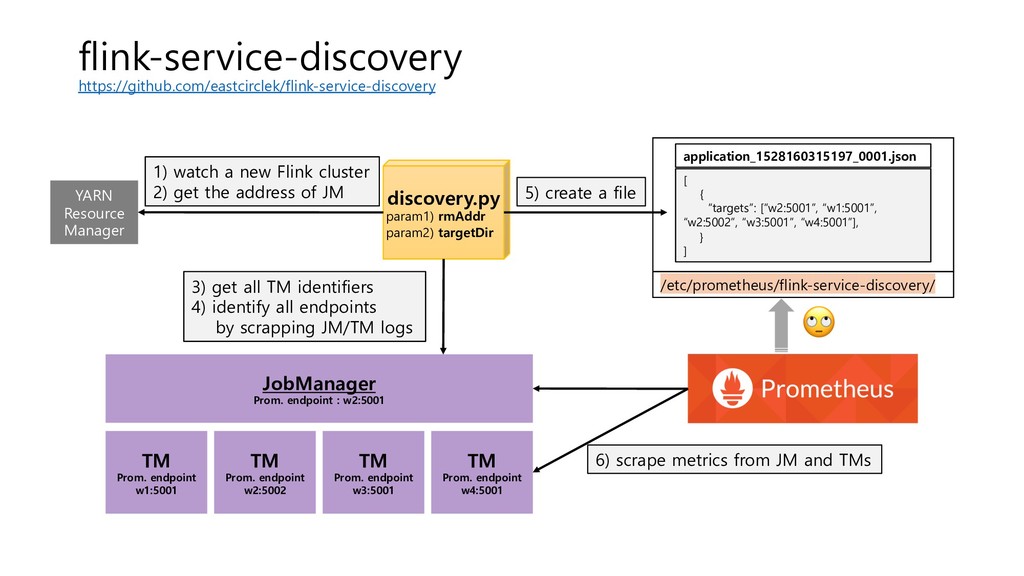
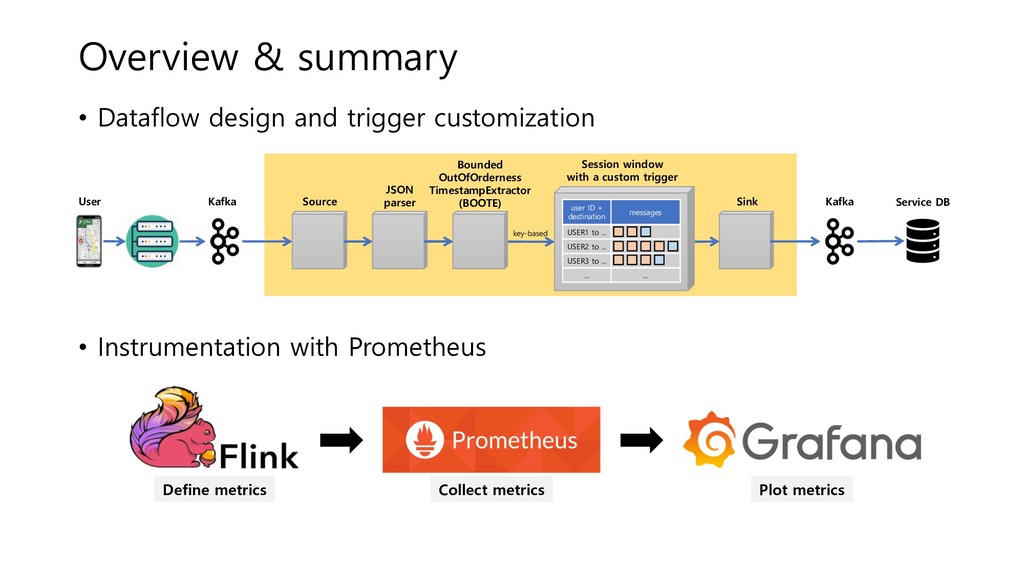
SK telecom presents how to build and operate a session-based streaming application using Flink. A driving score service essentially calculates a driving score of a user's driving session considering speeding, rapid acceleration and rapid deceleration during the session. At SK telecom, this service was originally powered by batch ETL using Hive but has recently been migrated to stream processing using Flink. While batch ETL was only capable of letting users know a driving score 24 hours after a session is finished, Flink enables us to inform drivers of driving scores as soon as they reach their destinations. In this presentation, we talk about the dataflow design, trigger customization for emitting early results, exposing job-level metrics and a service discovery mechanism for integration with Prometheus.

eastcirclek

September 04, 2018
Tweet

More Decks by eastcirclek

Other Decks in Technology

Transcript

  1. My talks @FlinkForward Flink Forward 2015 A Comparative Performance Evaluation

    of Flink Flink Forward 2017 Predictive Maintenance with Deep Learning and Flink . Flink Forward 2018 Real-time driving score service using Flink
  2. T map, a mobile navigation app by SK telecom ≈

    Choose from frequent locations Enter an address or a place name Waze Google Maps
  3. T map, a mobile navigation app by SK telecom multiple

    route options in driving mode arriving at destination
  4. Driving score service by T map I scored 83 out

    of 100! yay! Driving score KB Insurance DB Insurance 10% discount 10% discount Car insurance discount for safe drivers If you drive safely with , automobile insurance premiums go down.
  5. Driving score is based on three factors My driving score

    Rank : 970k Speeding Rapid accel. Rapid decel. great good good Monthly chart Apr May Jun Jul Aug
  6. The three factors are calculated for each session 6/29 (Fri.)

    min min SKT Network Operation Center Yanghyeon Village •speeding 0 •rapid acc. 0 •rapid decel. 0 •speeding 1 •rapid acc. 1 •rapid decel. 0 6/28 (Thu.) min min SKT Network Operation Center Yanghyeon Village •speeding 1 •rapid acc. 1 •rapid decel. 0 •speeding 1 •rapid acc. 1 •rapid decel. 1 • • •
  7. The three factors are calculated for each session • •

    • Speeding 0.2km My speed : 90km/h (Speed limit : 70km/h) Rapid accel. (within 3 sec) Rapid decel. (within 3 sec)
  8. Current client-server architecture A GPS trajectory is generated for each

    driving session … GPS coord. • latitude • longitude • altitude T1 GPS coord. • latitude • longitude • altitude T2 GPS coord. • latitude • longitude • altitude TN T map GPS trajectory driving score (+1day) Batch ETL jobs are executed twice a day to calculate three factors ••• from trajectories The main drawback Users cannot see today’s driving scores until tomorrow T map service server ... 11min SKT Network Operation Center •speeding 1 •rapid acc. 1 •rapid decel. 1
  9. Migration from batch ETL to streaming processing ... ... Service

    DB Millions of users ... Batch processing Real-time streaming processing Goal Let users know driving scores ASAP
  10. Why we choose to use Flink? https://flink.apache.org/introduction.html#features-why-flink Exactly-once semantics for

    stateful computations stream processing and windowing with event time semantics flexible windowing light-weight fault-tolerance high throughput and low latency
  11. Contents • Dataflow design and trigger customization • Instrumentation with

    Prometheus Source JSON parser Sink Kafka Kafka Service DB User key-based Bounded OutOfOrderness TimestampExtractor (BOOTE) messages USER1 to ... USER2 to ... USER3 to ... ... ... user ID + destination Session window with a custom trigger Define metrics Collect metrics Plot metrics
  12. A 12-minute driving with 720 GPS coordinates T map T

    map service server ... ... ... ... T map generates a GPS coordinate every second
  13. T map sends 4 messages to the service server 1st

    periodic message (300 coordinates for the first 5 mins) 2nd periodic message (300 coordinates for the next 5 mins) End message (120 coordinates for the last 2 mins) ... ... ... T map T map service server ... Init message
  14. Return scores right after receiving end messages T map driving

    score 7:20 T map service server ... Init a 7:08 Periodic b 7:13 c 7:18 End d 7:20 Messages 11min SKT Network Operation Center •speeding 1 •rapid acc. 1 •rapid decel. 1
  15. Real-time driving score dataflow using Source JSON parser Sink Kafka

    Kafka Service DB User key-based Logical dataflow messages USER1 to ... USER2 to ... USER3 to ... ... ... user ID + destination Session window with a custom trigger Bounded OutOfOrderness TimestampExtractor (BOOTE) at-least-once Kafka producer session gap : 1 hour
  16. Real-time driving score dataflow using Source JSON parser Sink Kafka

    Kafka Service DB User key-based Logical dataflow Bounded OutOfOrderness TimestampExtractor (BOOTE) ... Source Session window with a custom trigger p0 p1 p2 p19 20 partitions 20 tasks 256 tasks ... ... ... p0 p1 p2 p19 20 partitions Sink ... several million users 20 tasks 256 tasks Service DB ... User Physical dataflow ... 20 tasks JSON parser BOOTE messages USER1 to ... USER2 to ... USER3 to ... ... ... user ID + destination messages … … ... ... user ID + destination messages … … ... ... user ID + destination messages … … ... ... user ID + destination Session window with a custom trigger
  17. Session window (gap : 1 hour) with different triggers 8:13

    8:18 8:20 8:08 7:13 b Periodic 7:08 a Init 7:18 c Periodic 7:20 d End 8:13 8:18 8:20 8:08 7:13 b Periodic 7:08 a Init 7:18 c Periodic a b c d a b c d • 1 • 1 • 1 • 1 • 1 • 1 The default EventTimeTrigger EarlyResultEventTimeTrigger 7:20 d End early fire DO NOT fire fire (necessary in case of out-of-order messages) Time Time Early timer
  18. Slow for some reason Out-or-order messages ... Source ... ...

    ... JSON parser p0 p1 p2 p19 ... p0 p1 p2 p19 Service DB ... ... a Init b Periodic c d End a b c d messages … … … … ... ... user ID + destination messages … … … … ... ... user ID + destination Session window w/ EarlyResultEventTimeTrigger (session gap : 1 hour) Sink messages user ID + destination … … … … Dongwon to SKT NOC a b Dongwon’s iPhone BOOTE (maxOoO : 1 sec) c d
  19. b Periodic a Init c Periodic • 1 • 1

    • 1 d End early fire (perfect result) DO NOT fire (no messages added after the last fire) b Periodic a Init c Periodic a b d • 0 • 1 • 1 d End early fire (incomplete result) [Case 1] C arrives before the early timer expires c [Case 2] C arrives after the early timer expires c 2nd fire (perfect result) a b c d • 1 • 1 • 1 Time Time a b d c How EarlyResultEventTimeTrigger deals with out-or-order messages
  20. Contents • Dataflow design and trigger customization • Instrumentation with

    Prometheus Source JSON parser Sink Kafka Kafka Service DB User key-based Bounded OutOfOrderness TimestampExtractor (BOOTE) messages USER1 to ... USER2 to ... USER3 to ... ... ... user ID + destination Session window with a custom trigger Define metrics Collect metrics Plot metrics
  21. Individual message statistics N:1 Message stats. extractor Message stats. sink

    Source Sink Kafka Kafka JSON parser BOOTE key-based messages … … … … ... ... user ID + destination Source 20 tasks ... ... 20 tasks JSON parser ... Message stats. extractor Message stats. sink 20 tasks 1 task Logical dataflow Physical dataflow Session window Service DB User
  22. Individual message statistics 1K messages per second 100M messages per

    day 10s of MB per second 2 TB per day N:1 Message stats. extractor Message stats. sink Source Sink Kafka Kafka JSON parser BOOTE key-based messages … … … … ... ... user ID + destination Logical dataflow Session window Service DB User meter histogram histogram meter
  23. Jitter (ingestion time – event time) Source Sink Kafka Kafka

    JSON parser Bounded OutOfOrderness TimestampExtractor key-based messages … … … … ... ... user ID + destination Logical dataflow Session window Service DB event time ingestion time User 1 sec Based on this observation, we use 1 sec for maxOutOfOrderness
  24. Session output statistics N:1 N:1 Message stats. extractor Message stats.

    sink Session output stats. extractor Session output stats. sink Source Sink Kafka Kafka JSON parser BOOTE key-based messages … … … … ... ... user ID + destination Source 20 tasks ... ... 20 tasks JSON parser ... Message stats. extractor Message stats. sink 20 tasks 1 task messages … … … … ... ... user ID + destination 256 tasks Session output stats. extractor Session output stats. sink 256 tasks 1 task ... Session window ... messages … … … … ... ... user ID + destination messages … … … … ... ... user ID + destination • • • • • • • • • • • • • • • • • • Logical dataflow Physical dataflow Session window Service DB User
  25. Session output statistics N:1 Session output stats. extractor Session output

    stats. sink Source Sink Kafka Kafka JSON parser BOOTE key-based messages … … … … ... ... user ID + destination Logical dataflow Session window Service DB User N:1 Message stats. extractor Message stats. sink meter histogram histogram meter
  26. Our own definition of latency ingestion time of end messages

    Session output stats. extractor Session output stats. sink Source Sink Kafka Kafka JSON parser BOOTE Session window messages user ID + destination … … … … Dongwon to SKT NOC a b c d End d End d End d End d processing time of session output @extractor • 1 • 1 • 1 • 1 • 1 • 1 Considering maxOutOfOrderness is 1 second, Flink takes at most 250 milliseconds
  27. N:1 N:1 Message stats. extractor Message stats. sink Session output

    stats. extractor Session output stats. sink Source Sink Kafka Kafka JSON parser BOOTE key-based messages … … … … ... ... user ID + destination Service DB User How to expose metrics to Prometheus? Session window
  28. TaskManager #1 TaskManager #2 JobManager Push-model and pull-model Prometheus reporter

    (HTTP endpoint) Ganglia reporter Graphite reporter Prometheus reporter (HTTP endpoint) Ganglia reporter Graphite reporter Prometheus reporter (HTTP endpoint) Ganglia reporter Graphite reporter pull pushed pushed
  29. Node Manager w1 Node Manager w2 Node Manager w3 Node

    Manager w4 Resource Manager Endpoint addresses cannot be determined in advance #!/bin/bash # launch a Flink per-job cluster on YARN flink run --jobmanager yarn-cluster --yarncontainer 4 ... # flink-conf.yaml ... metrics.reporter.prom.port: 5001-5100 ... Q. Can we list the endpoint addresses before YARN’s scheduling? A. No, impossible
  30. Node Manager w1 Node Manager w2 Node Manager w3 Node

    Manager w4 Resource Manager Endpoint addresses cannot be determined in advance #!/bin/bash # launch a Flink per-job cluster on YARN flink run --jobmanager yarn-cluster --yarncontainer 4 ... # flink-conf.yaml ... metrics.reporter.prom.port: 5001-5100 ... TM Prom. endpoint w1:5002 TM Prom. endpoint w2:5001 JM Prom. endpoint w2:5001 TM Prom. endpoint w3:5001 TM Prom. endpoint w4:5001 Possible world #1
  31. Node Manager w1 Node Manager w2 Node Manager w3 Node

    Manager w4 Resource Manager Endpoint addresses cannot be determined in advance #!/bin/bash # launch a Flink per-job cluster on YARN flink run --jobmanager yarn-cluster --yarncontainer 4 ... # flink-conf.yaml ... metrics.reporter.prom.port: 5001-5100 ... TM Prom. endpoint w1:5001 TM Prom. endpoint w2:5002 JM Prom. endpoint w2:5001 TM Prom. endpoint w3:5001 TM Prom. endpoint w4:5001 Possible world #2
  32. Node Manager w1 Node Manager w2 Node Manager w3 Node

    Manager w4 Resource Manager Endpoint addresses cannot be determined in advance #!/bin/bash # launch a Flink per-job cluster on YARN flink run --jobmanager yarn-cluster --yarncontainer 4 ... # flink-conf.yaml ... metrics.reporter.prom.port: 5001-5100 ... TM Prom. endpoint w1:5001 TM Prom. endpoint w2:5001 JM Prom. endpoint w2:5001 TM Prom. endpoint w3:5002 TM Prom. endpoint w4:5001 Possible world #3
  33. Node Manager w1 Node Manager w2 Node Manager w3 Node

    Manager w4 Resource Manager Endpoint addresses cannot be determined in advance #!/bin/bash # launch a Flink per-job cluster on YARN flink run --jobmanager yarn-cluster --yarncontainer 4 ... # flink-conf.yaml ... metrics.reporter.prom.port: 5001-5100 ... TM Prom. endpoint w1:5001 TM Prom. endpoint w2:5001 JM Prom. endpoint w2:5001 TM Prom. endpoint w3:5001 TM Prom. endpoint w4:5002 Possible world #4
  34. Node Manager w1 Node Manager w2 Node Manager w3 Node

    Manager w4 Resource Manager Endpoint addresses cannot be determined in advance #!/bin/bash # launch a Flink per-job cluster on YARN flink run --jobmanager yarn-cluster --yarncontainer 4 ... # flink-conf.yaml ... metrics.reporter.prom.port: 5001-5100 ... TM Prom. endpoint w1:5001 TM Prom. endpoint w2:5002 JM Prom. endpoint w2:5001 TM Prom. endpoint w3:5001 TM Prom. endpoint w4:5001 TM Prom. endpoint w1:5002 TM Prom. endpoint w2:5003 JM Prom. endpoint w3:5002 TM Prom. endpoint w3:5003 TM Prom. endpoint w4:5002
  35. Where to scrape metrics form? Endpoint addresses are available after

    a cluster is up TM Prom. endpoint w1:5001 TM Prom. endpoint w2:5002 JobManager Prom. endpoint : w2:5001 TM Prom. endpoint w3:5001 TM Prom. endpoint w4:5001 TM Prom. endpoint w1:5002 TM Prom. endpoint w2:5003 JobManager Prom. endpoint : w3:5002 TM Prom. endpoint w3:5003 TM Prom. endpoint w4:5002 A per-job cluster (YARN ID : application_1500000000000_0001) Another per-job cluster (YARN ID : application_1500000000000_0002)
  36. File-based service discovery mechanism TM Prom. endpoint w1:5001 TM Prom.

    endpoint w2:5002 JobManager Prom. endpoint : w2:5001 TM Prom. endpoint w3:5001 TM Prom. endpoint w4:5001 TM Prom. endpoint w1:5002 TM Prom. endpoint w2:5003 JobManager Prom. endpoint : w3:5002 TM Prom. endpoint w3:5003 TM Prom. endpoint w4:5002 A per-job cluster (YARN ID : application_1500000000000_0001) Another per-job cluster (YARN ID : application_1500000000000_0002) /etc/prometheus/flink-service-discovery/ [ { “targets”: [“w2:5001”, “w1:5001”, “w2:5002”, “w3:5001”, “w4:5001”], } ] application_1528160315197_0001.json [ { “targets”: [“w3:5002”, “w1:5002”, “w2:5003”, “w3:5003”, “w4:5002”], } ] application_1528160315197_0002.json ! watches file names matching a given pattern
  37. File-based service discovery scrape metrics from known endpoints TM Prom.

    endpoint w1:5001 TM Prom. endpoint w2:5002 JobManager Prom. endpoint : w2:5001 TM Prom. endpoint w3:5001 TM Prom. endpoint w4:5001 TM Prom. endpoint w1:5002 TM Prom. endpoint w2:5003 JobManager Prom. endpoint : w3:5002 TM Prom. endpoint w3:5003 TM Prom. endpoint w4:5002 A per-job cluster (YARN ID : application_1500000000000_0001) Another per-job cluster (YARN ID : application_1500000000000_0002) w2:5001, w1:5001, w2:5002, w3:5001, w4:5001 w3:5002, w1:5002, w2:5003, w3:5003, w4:5002
  38. flink-service-discovery https://github.com/eastcirclek/flink-service-discovery YARN Resource Manager discovery.py param1) rmAddr param2) targetDir

    TM Prom. endpoint w1:5001 TM Prom. endpoint w2:5002 JobManager Prom. endpoint : w2:5001 TM Prom. endpoint w3:5001 TM Prom. endpoint w4:5001 1) watch a new Flink cluster 2) get the address of JM 3) get all TM identifiers 4) identify all endpoints by scrapping JM/TM logs [ { “targets”: [“w2:5001”, “w1:5001”, “w2:5002”, “w3:5001”, “w4:5001”], } ] application_1528160315197_0001.json /etc/prometheus/flink-service-discovery/ ! 5) create a file 6) scrape metrics from JM and TMs
  39. Overview & summary • Dataflow design and trigger customization •

    Instrumentation with Prometheus Source JSON parser Sink Kafka Kafka Service DB User key-based Bounded OutOfOrderness TimestampExtractor (BOOTE) messages USER1 to ... USER2 to ... USER3 to ... ... ... user ID + destination Session window with a custom trigger Define metrics Collect metrics Plot metrics