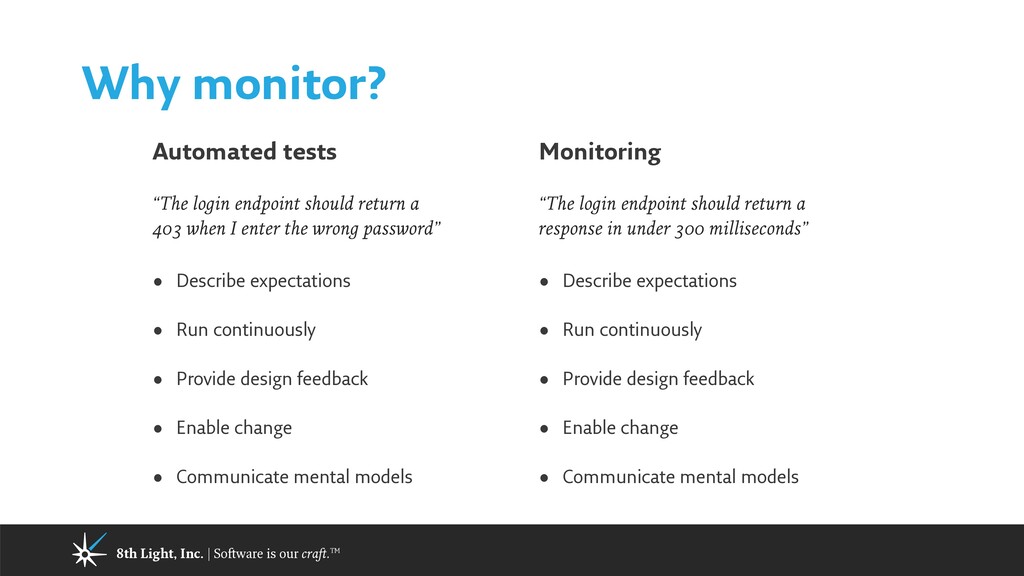
Automated tests “The login endpoint should return a 403 when I enter the wrong password” • Describe expectations • Run continuously • Provide design feedback • Enable change • Communicate mental models Monitoring “The login endpoint should return a response in under 300 milliseconds” • Describe expectations • Run continuously • Provide design feedback • Enable change • Communicate mental models
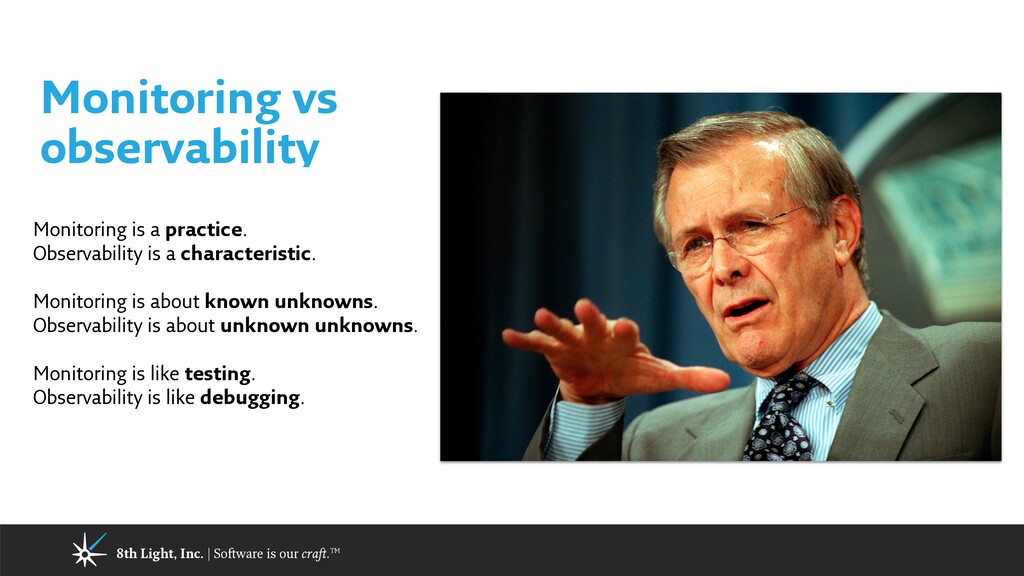
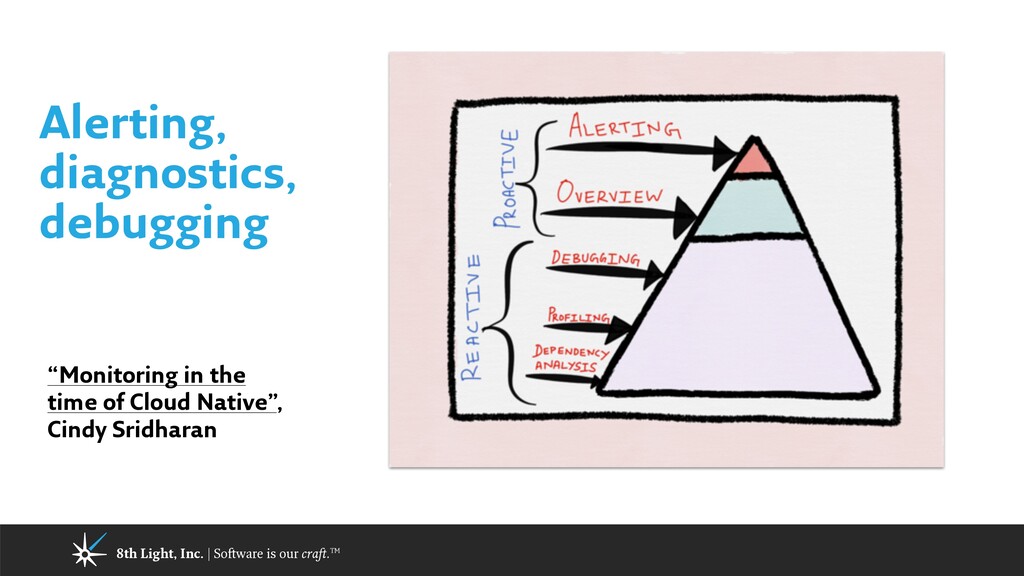
observability Monitoring is a practice. Observability is a characteristic. Monitoring is about known unknowns. Observability is about unknown unknowns. Monitoring is like testing. Observability is like debugging.
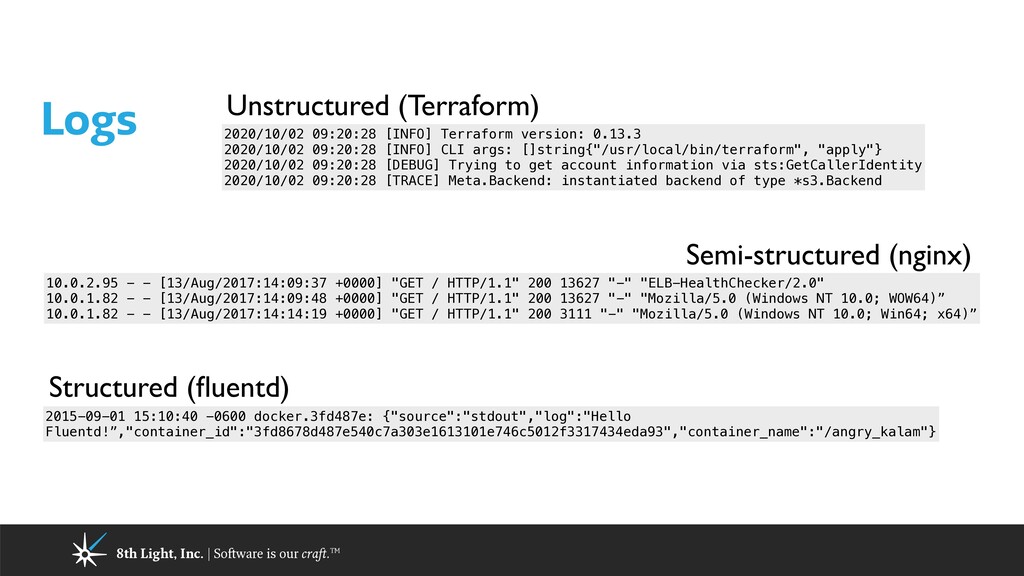
about everything emits logs. Logs are an immutable record of discrete events over time. Logs are useful as an authoritative record of what happened when.
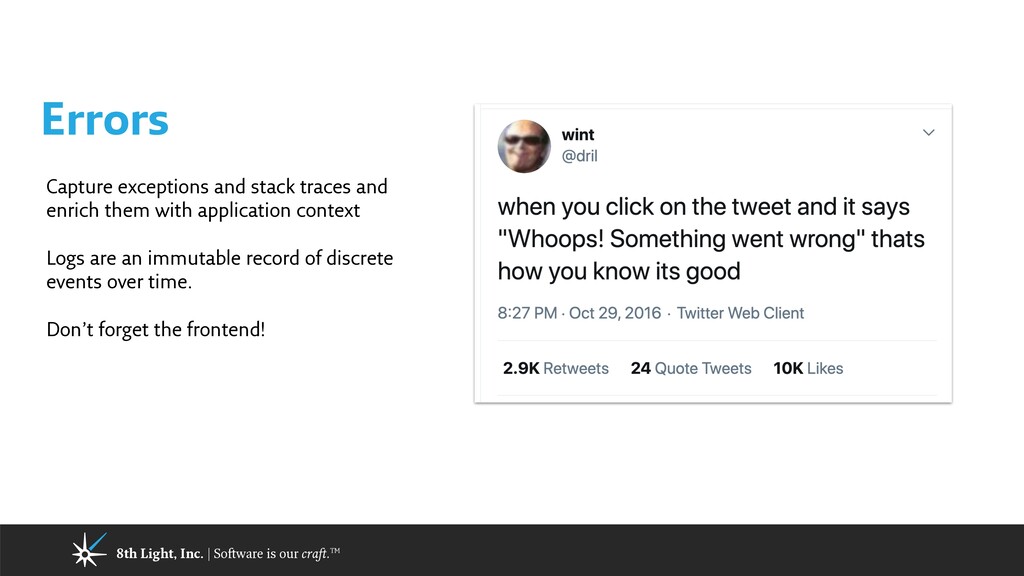
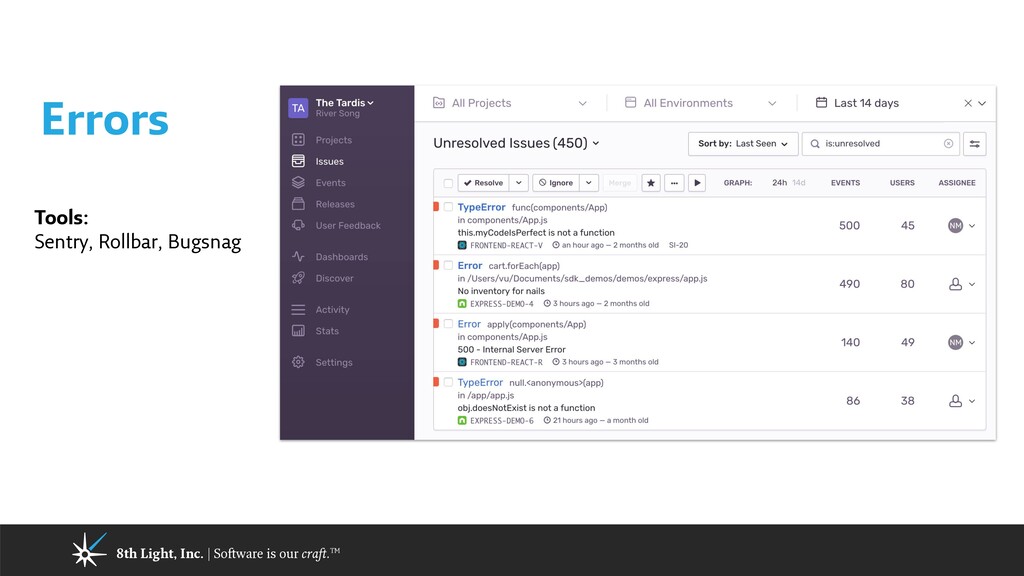
exceptions and stack traces and enrich them with application context Logs are an immutable record of discrete events over time. Don’t forget the frontend!
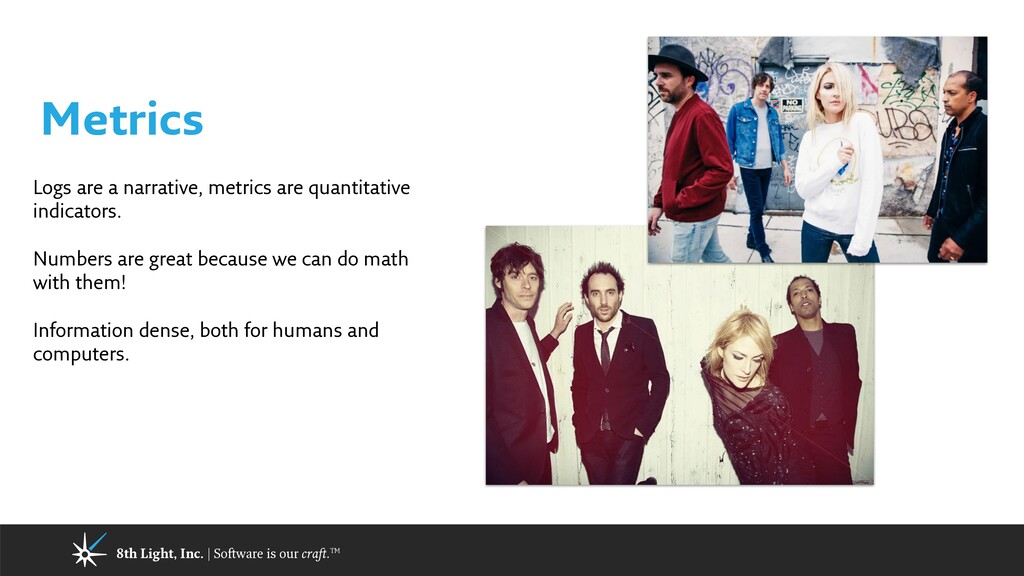
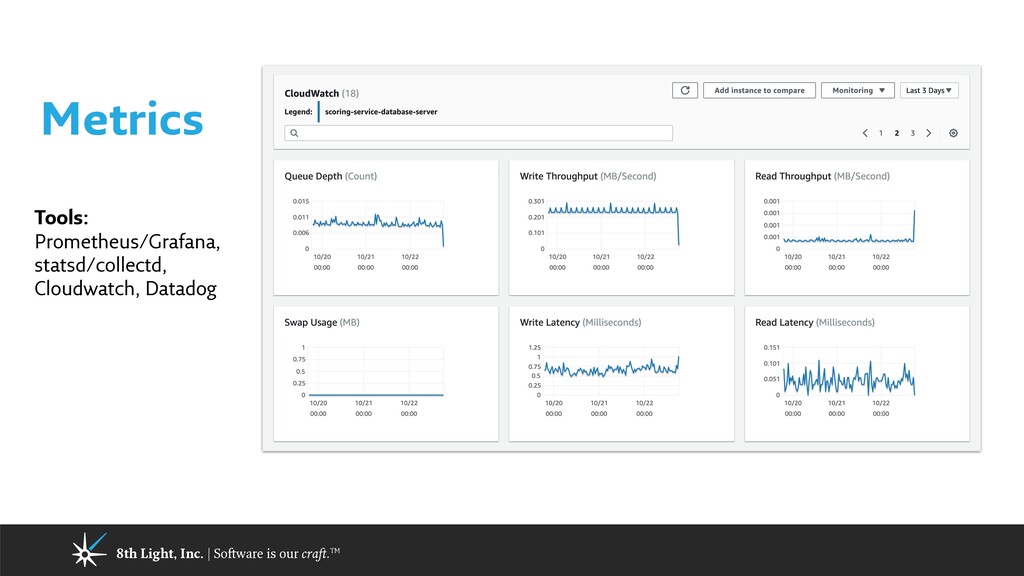
are a narrative, metrics are quantitative indicators. Numbers are great because we can do math with them! Information dense, both for humans and computers.
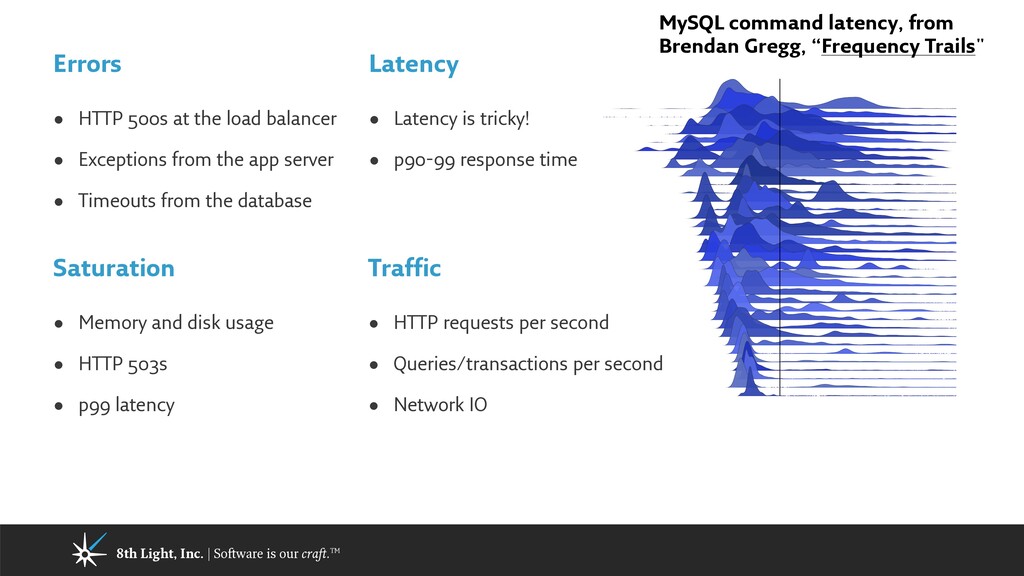
Signals • Latency • Errors • Traffic • Saturation “If you can only measure four metrics of your user-facing system, focus on these four.” —Site Reliability Engineering
HTTP 500s at the load balancer • Exceptions from the app server • Timeouts from the database Traffic • HTTP requests per second • Queries/transactions per second • Network IO Latency • Latency is tricky! • p90-99 response time Saturation • Memory and disk usage • HTTP 503s • p99 latency MySQL command latency, from Brendan Gregg, “Frequency Trails"
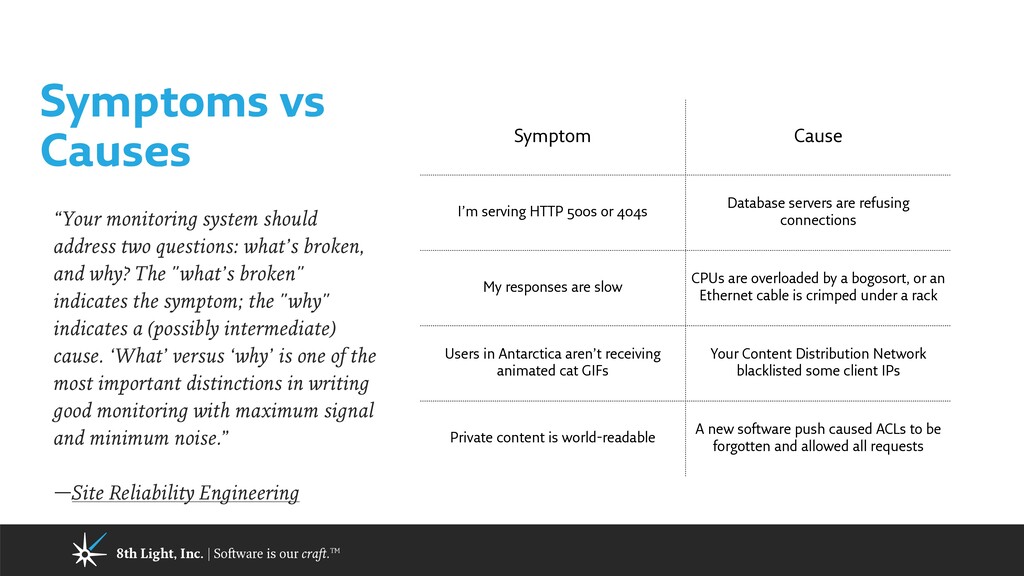
Causes “Your monitoring system should address two questions: what’s broken, and why? The "what’s broken" indicates the symptom; the "why" indicates a (possibly intermediate) cause. ‘What’ versus ‘why’ is one of the most important distinctions in writing good monitoring with maximum signal and minimum noise.” —Site Reliability Engineering Symptom Cause I’m serving HTTP 500s or 404s Database servers are refusing connections My responses are slow CPUs are overloaded by a bogosort, or an Ethernet cable is crimped under a rack Users in Antarctica aren’t receiving animated cat GIFs Your Content Distribution Network blacklisted some client IPs Private content is world-readable A new software push caused ACLs to be forgotten and allowed all requests
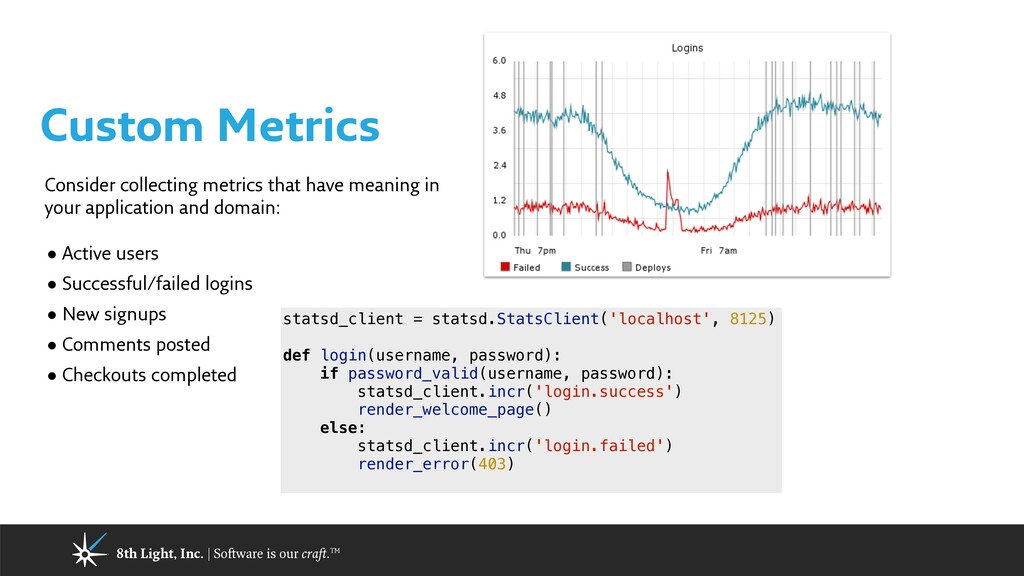
statsd_client = statsd.StatsClient('localhost', 8125) def login(username, password): if password_valid(username, password): statsd_client.incr('login.success') render_welcome_page() else: statsd_client.incr('login.failed') render_error(403) Consider collecting metrics that have meaning in your application and domain: • Active users • Successful/failed logins • New signups • Comments posted • Checkouts completed
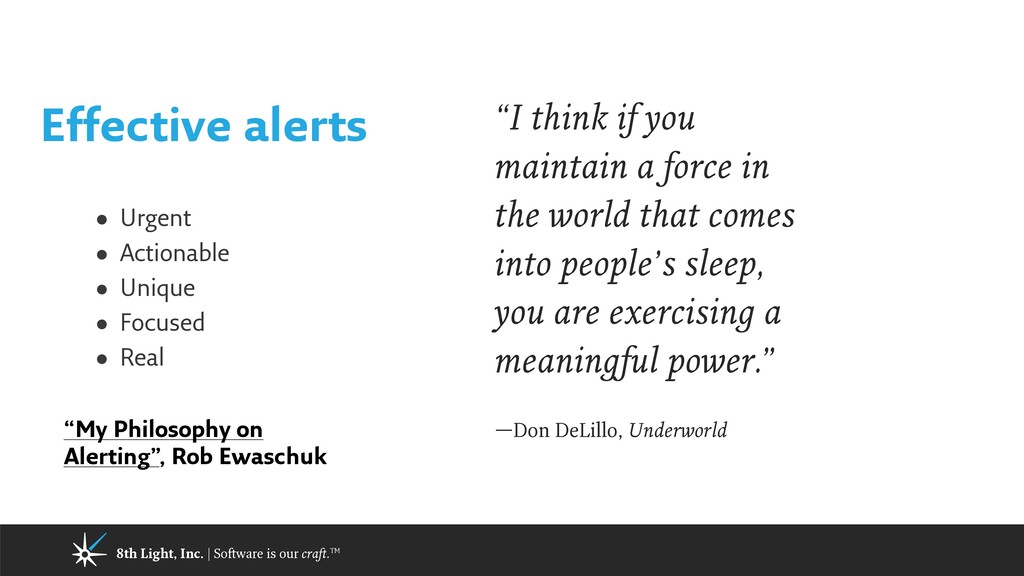
• Urgent • Actionable • Unique • Focused • Real “I think if you maintain a force in the world that comes into people’s sleep, you are exercising a meaningful power.” —Don DeLillo, Underworld “My Philosophy on Alerting”, Rob Ewaschuk