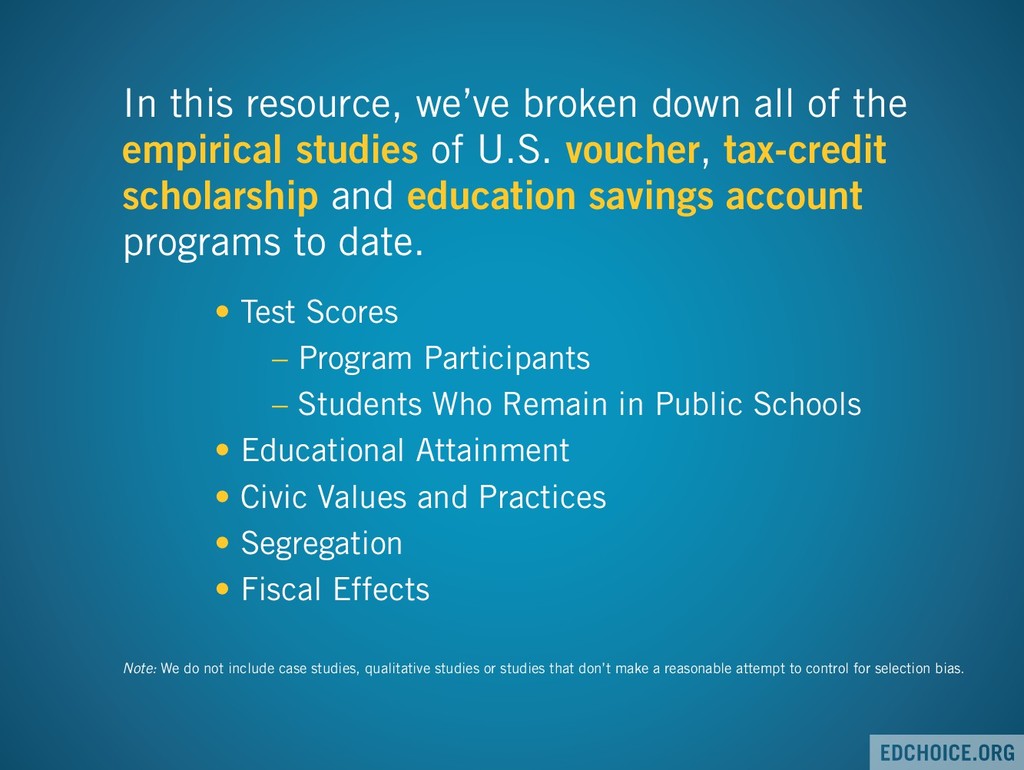
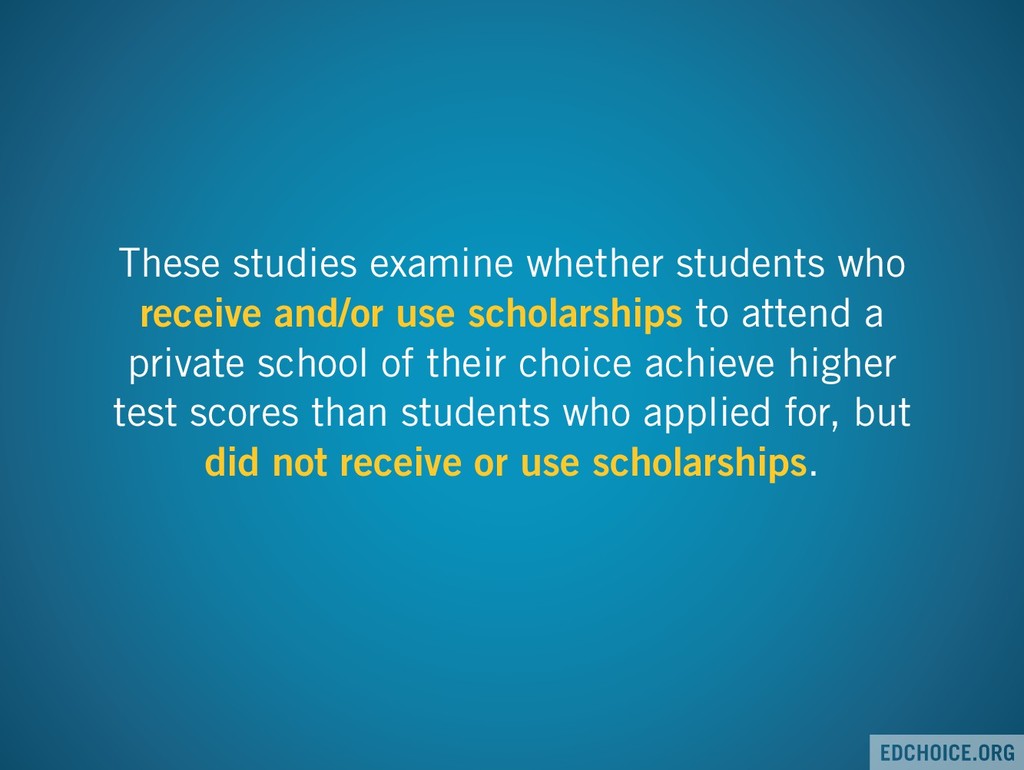
studies of U.S. voucher, tax-credit scholarship and education savings account programs to date. Note: We do not include case studies, qualitative studies or studies that don’t make a reasonable attempt to control for selection bias. • Test Scores – Program Participants – Students Who Remain in Public Schools • Educational Attainment • Civic Values and Practices • Segregation • Fiscal Effects
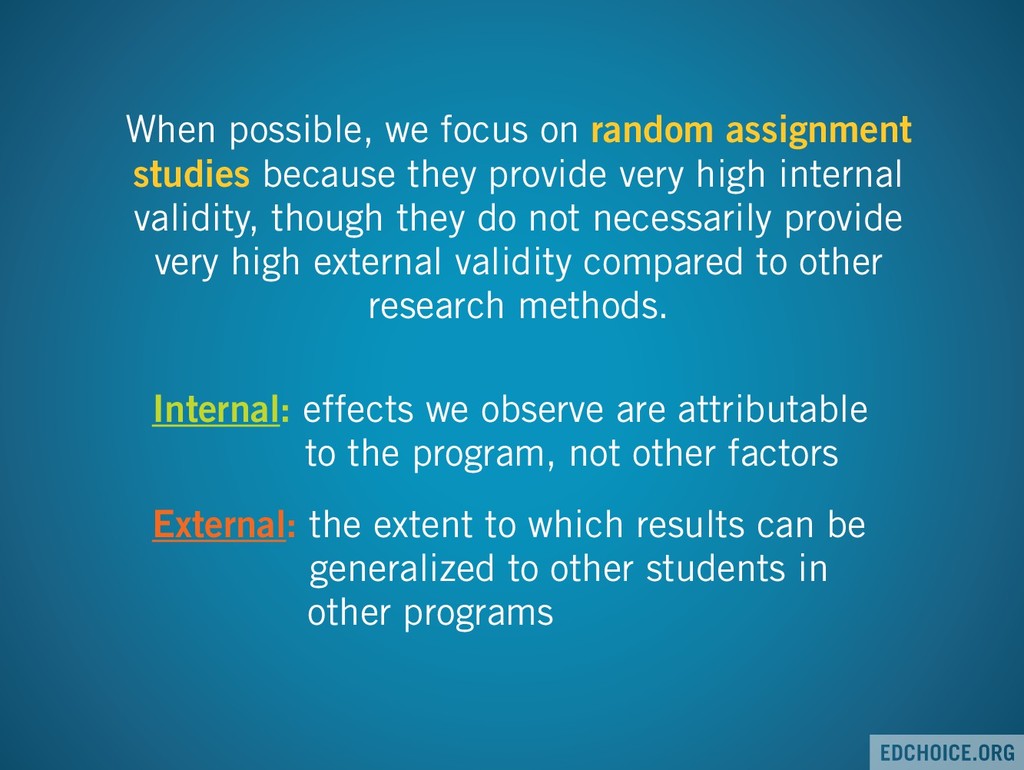
provide very high internal validity, though they do not necessarily provide very high external validity compared to other research methods. Internal: effects we observe are attributable to the program, not other factors External: the extent to which results can be generalized to other students in other programs
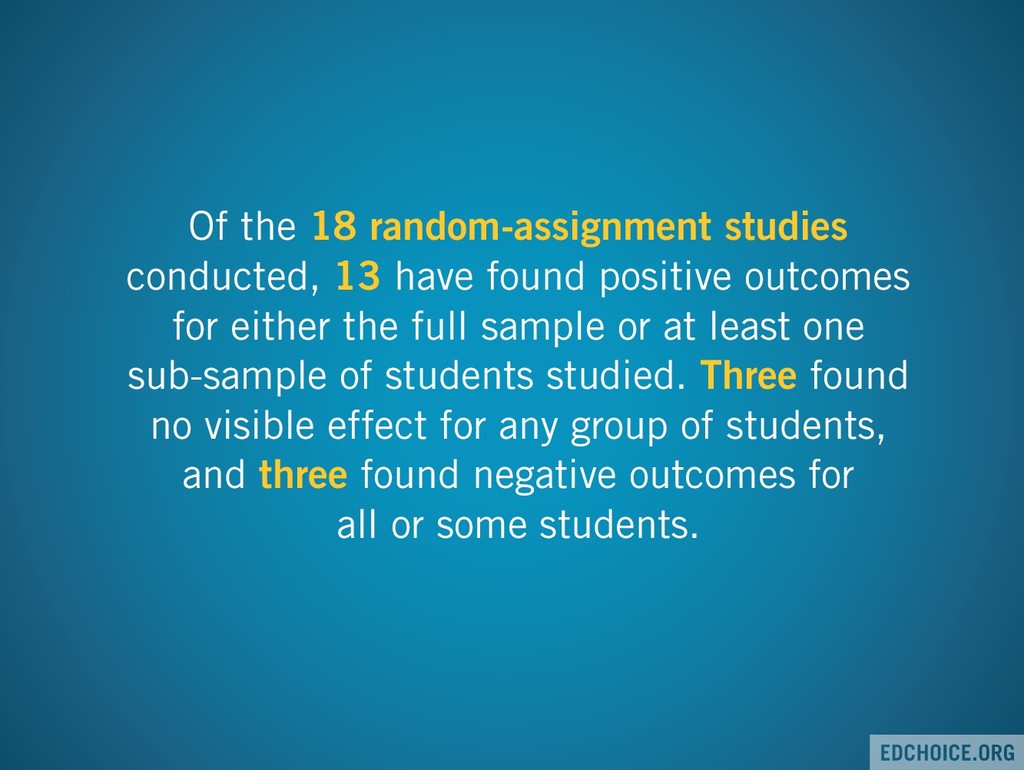
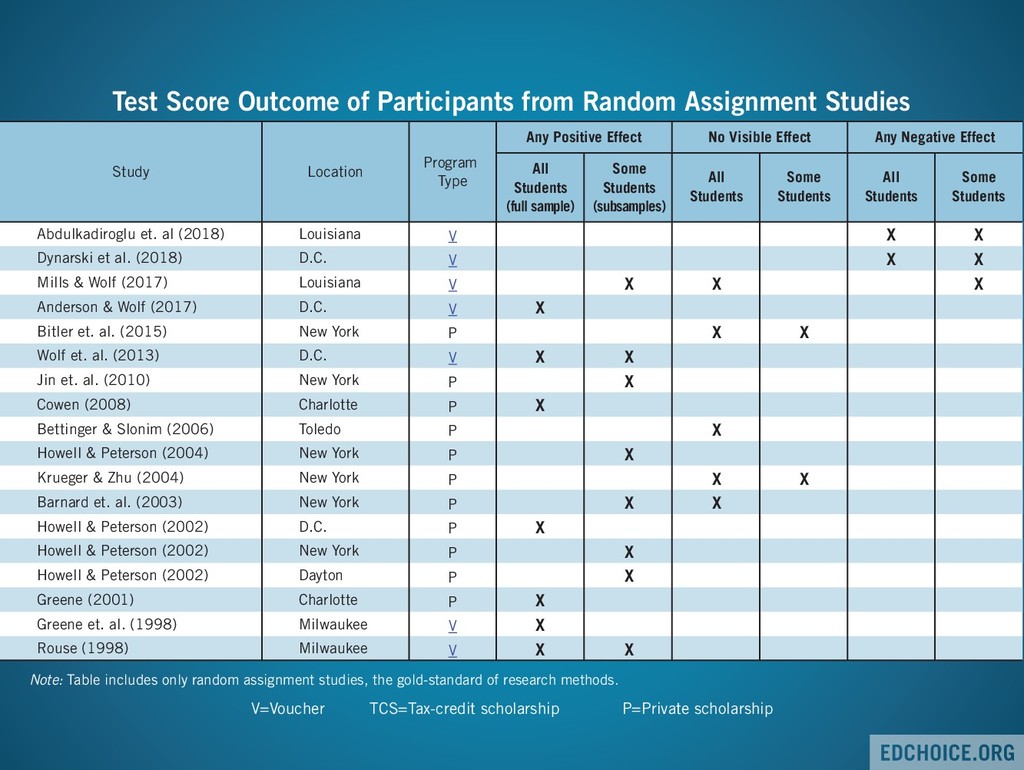
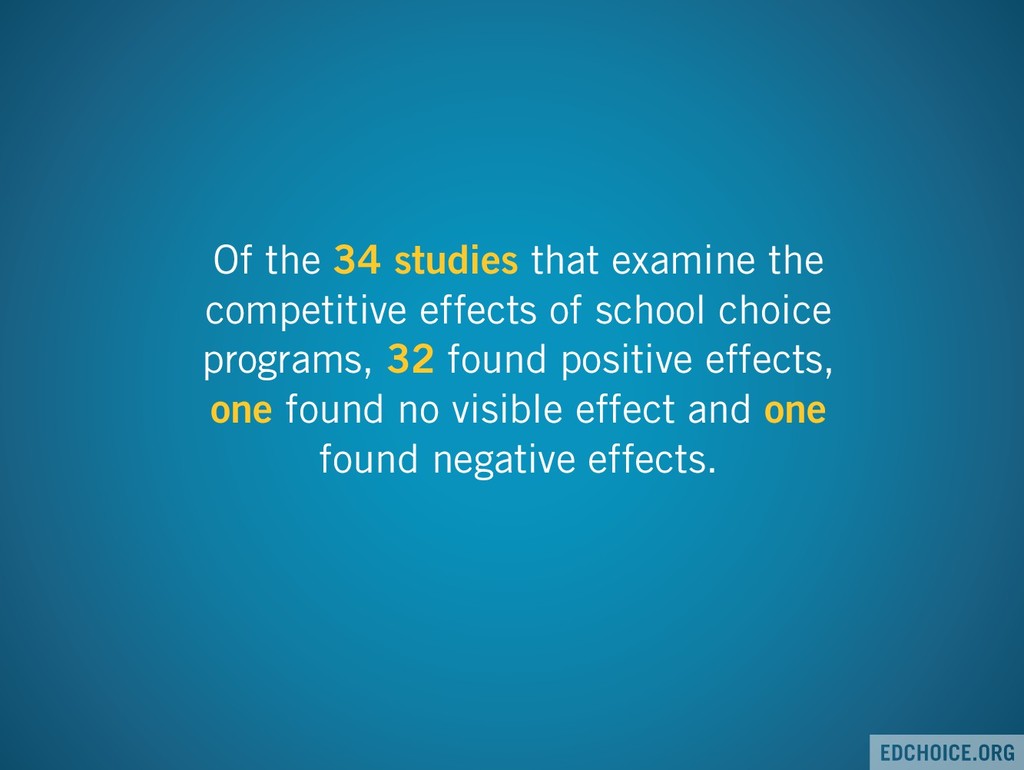
outcomes for either the full sample or at least one sub-sample of students studied. Three found no visible effect for any group of students, and three found negative outcomes for all or some students.
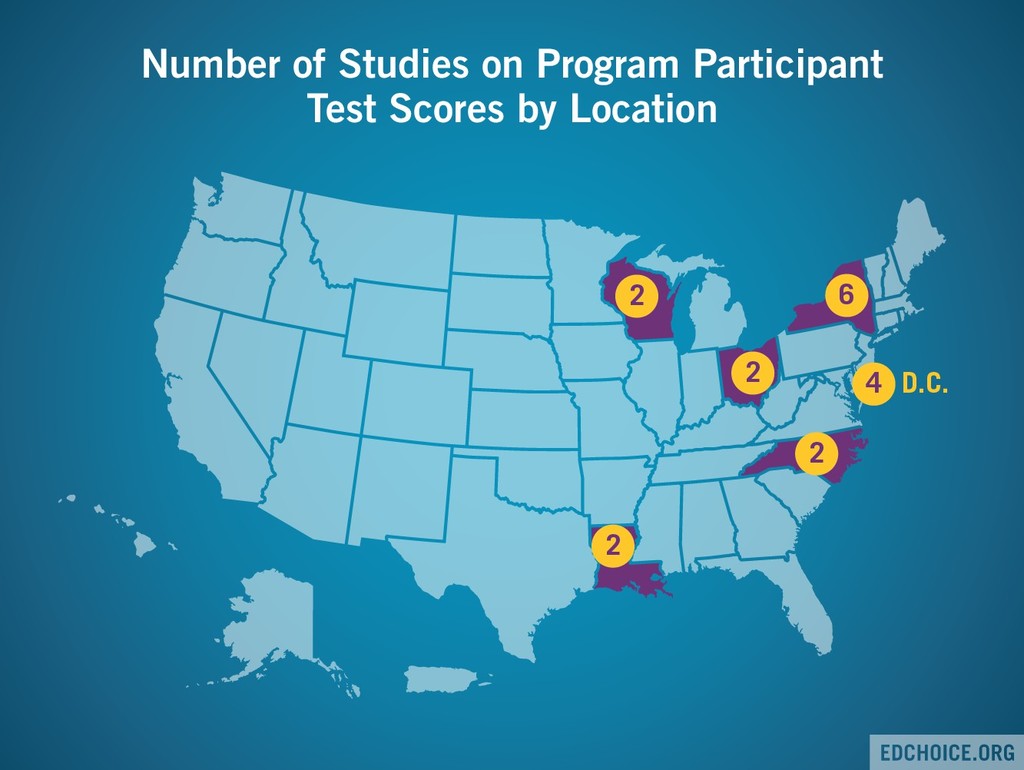
sample) Some Students (subsamples) All Students Some Students All Students Some Students No Visible Effect Any Negative Effect X X X X X X X X X X X X X X X X X X X X X X X X X X X Louisiana D.C. Louisiana D.C. New York D.C. New York Charlotte Toledo New York New York New York D.C. New York Dayton Charlotte Milwaukee Milwaukee V V V V P V P P P P P P P P P P V V Abdulkadiroglu et. al (2018) Dynarski et al. (2018) Mills & Wolf (2017) Anderson & Wolf (2017) Bitler et. al. (2015) Wolf et. al. (2013) Jin et. al. (2010) Cowen (2008) Bettinger & Slonim (2006) Howell & Peterson (2004) Krueger & Zhu (2004) Barnard et. al. (2003) Howell & Peterson (2002) Howell & Peterson (2002) Howell & Peterson (2002) Greene (2001) Greene et. al. (1998) Rouse (1998) Test Score Outcome of Participants from Random Assignment Studies Note: Table includes only random assignment studies, the gold-standard of research methods. V=Voucher TCS=Tax-credit scholarship P=Private scholarship
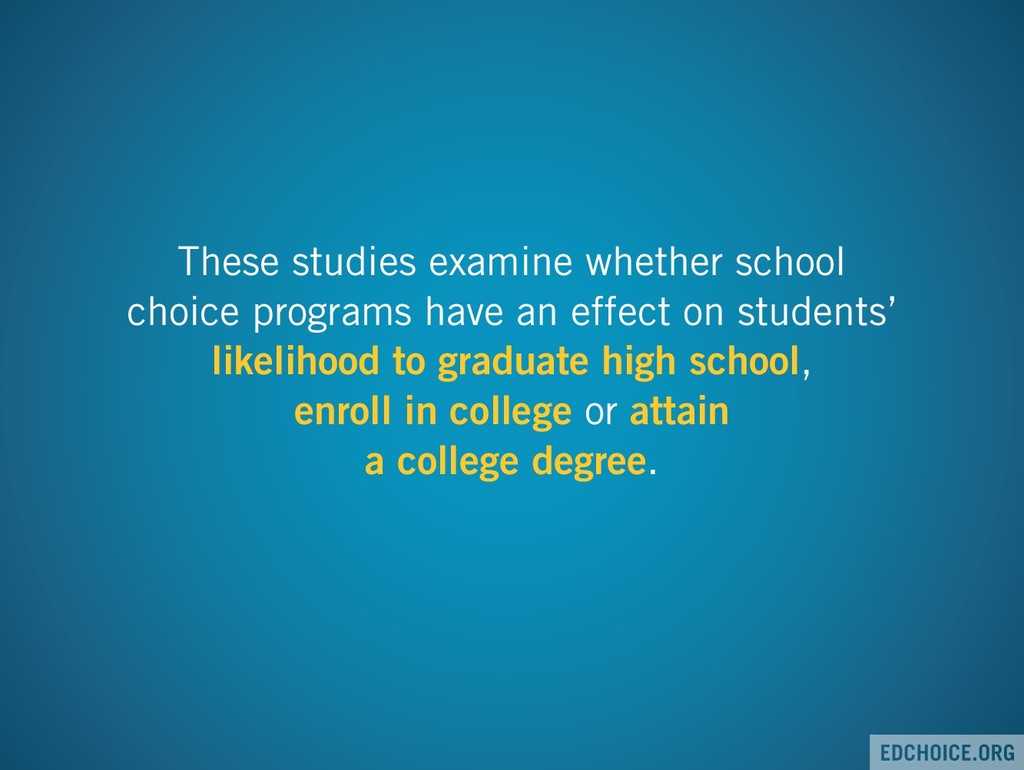
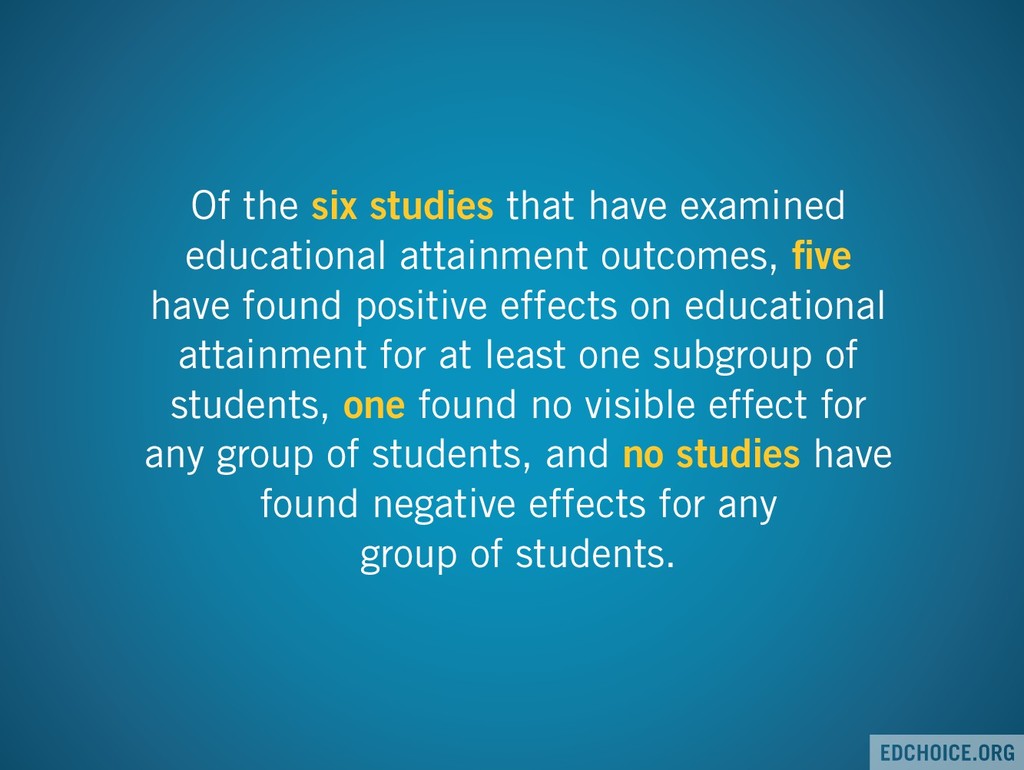
five have found positive effects on educational attainment for at least one subgroup of students, one found no visible effect for any group of students, and no studies have found negative effects for any group of students.
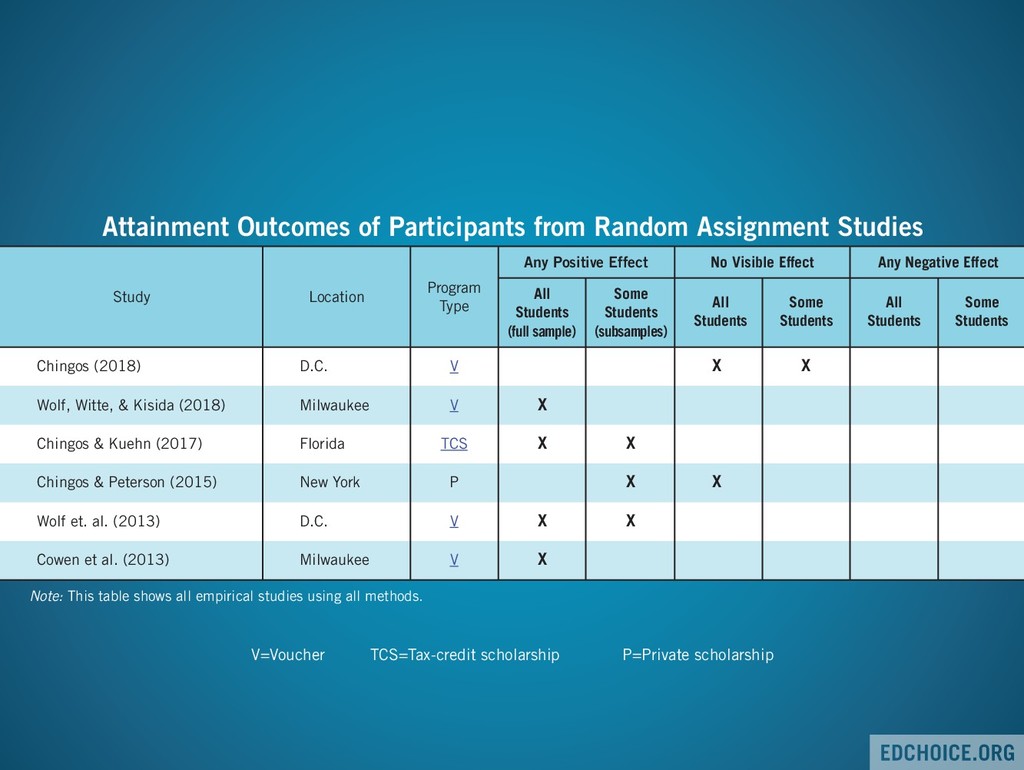
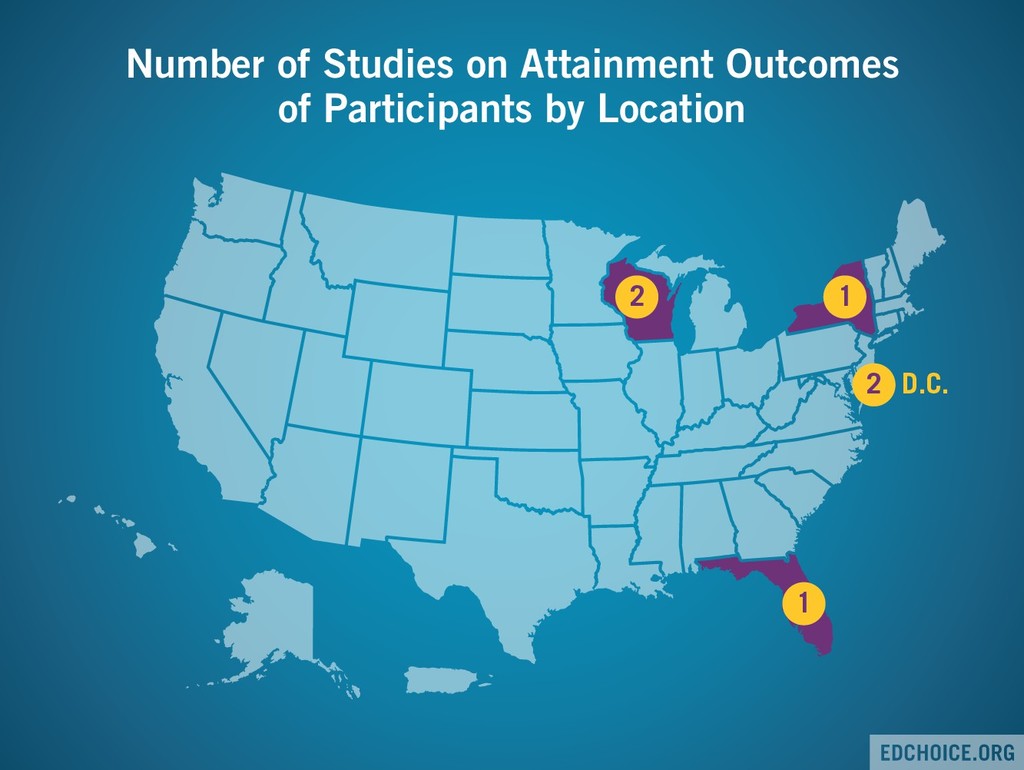
sample) Some Students (subsamples) All Students Some Students All Students Some Students No Visible Effect Any Negative Effect X X X X X X X X X X D.C. Milwaukee Florida New York D.C. Milwaukee V V TCS P V V Chingos (2018) Wolf, Witte, & Kisida (2018) Chingos & Kuehn (2017) Chingos & Peterson (2015) Wolf et. al. (2013) Cowen et al. (2013) Attainment Outcomes of Participants from Random Assignment Studies Note: This table shows all empirical studies using all methods. V=Voucher TCS=Tax-credit scholarship P=Private scholarship
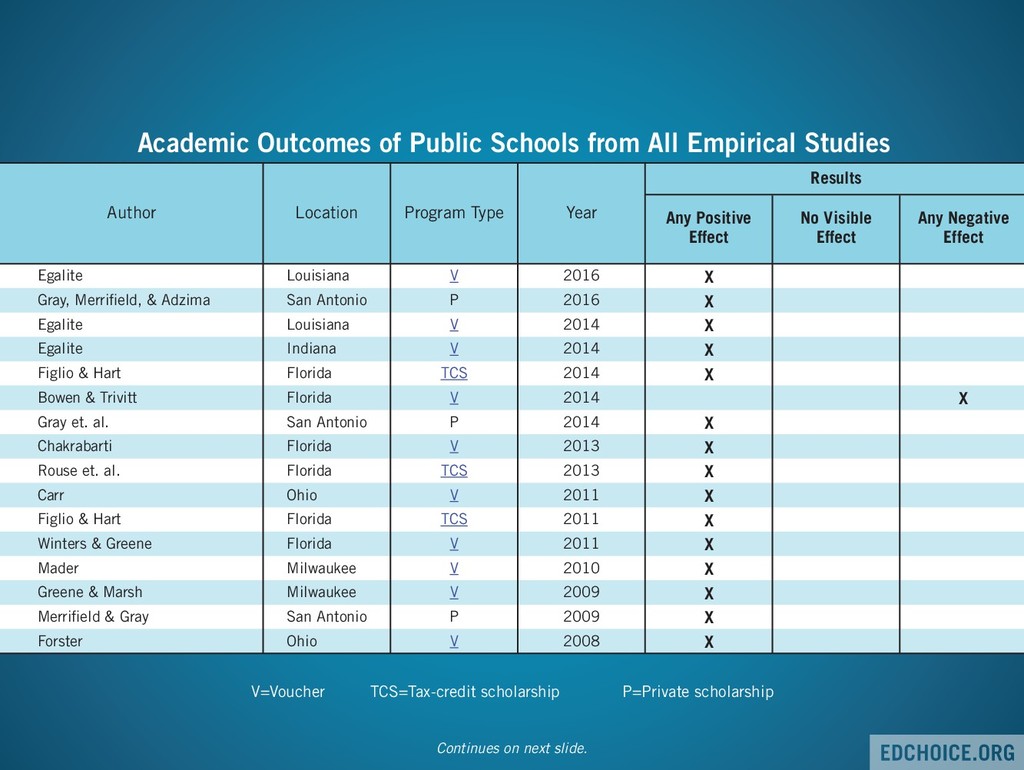
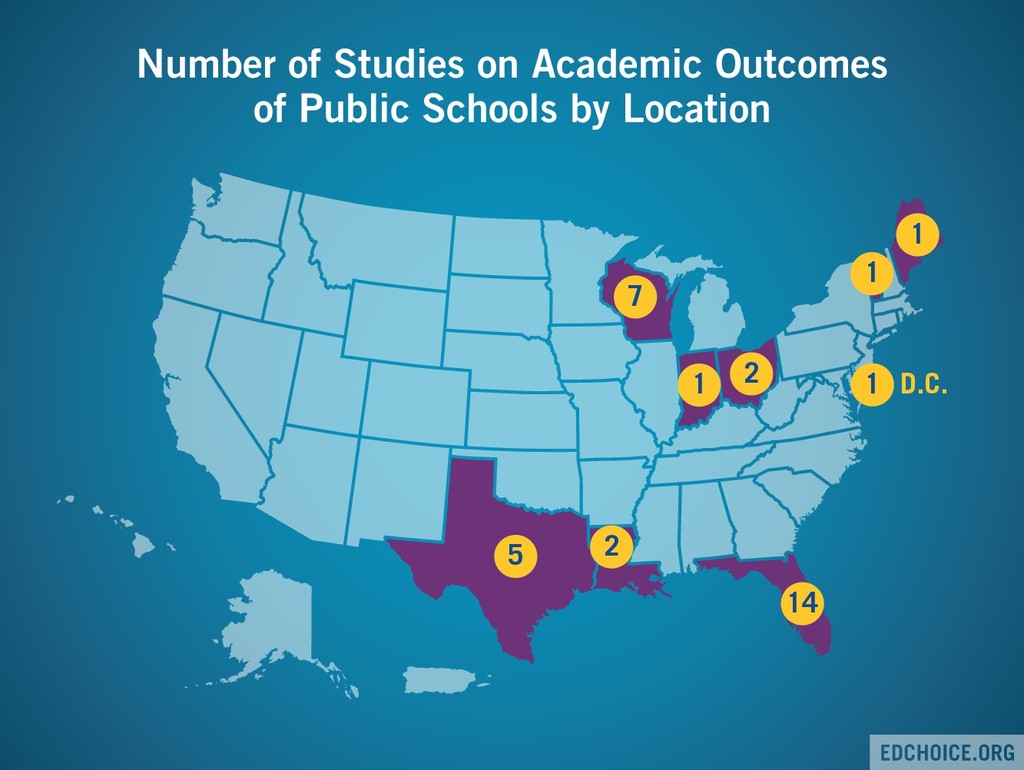
Effect Any Negative Effect Results X X X X X X X X X X X X X X X X Louisiana San Antonio Louisiana Indiana Florida Florida San Antonio Florida Florida Ohio Florida Florida Milwaukee Milwaukee San Antonio Ohio V P V V TCS V P V TCS V TCS V V V P V Egalite Gray, Merrifield, & Adzima Egalite Egalite Figlio & Hart Bowen & Trivitt Gray et. al. Chakrabarti Rouse et. al. Carr Figlio & Hart Winters & Greene Mader Greene & Marsh Merrifield & Gray Forster Academic Outcomes of Public Schools from All Empirical Studies 2016 2016 2014 2014 2014 2014 2014 2013 2013 2011 2011 2011 2010 2009 2009 2008 TCS Continues on next slide. V=Voucher TCS=Tax-credit scholarship P=Private scholarship
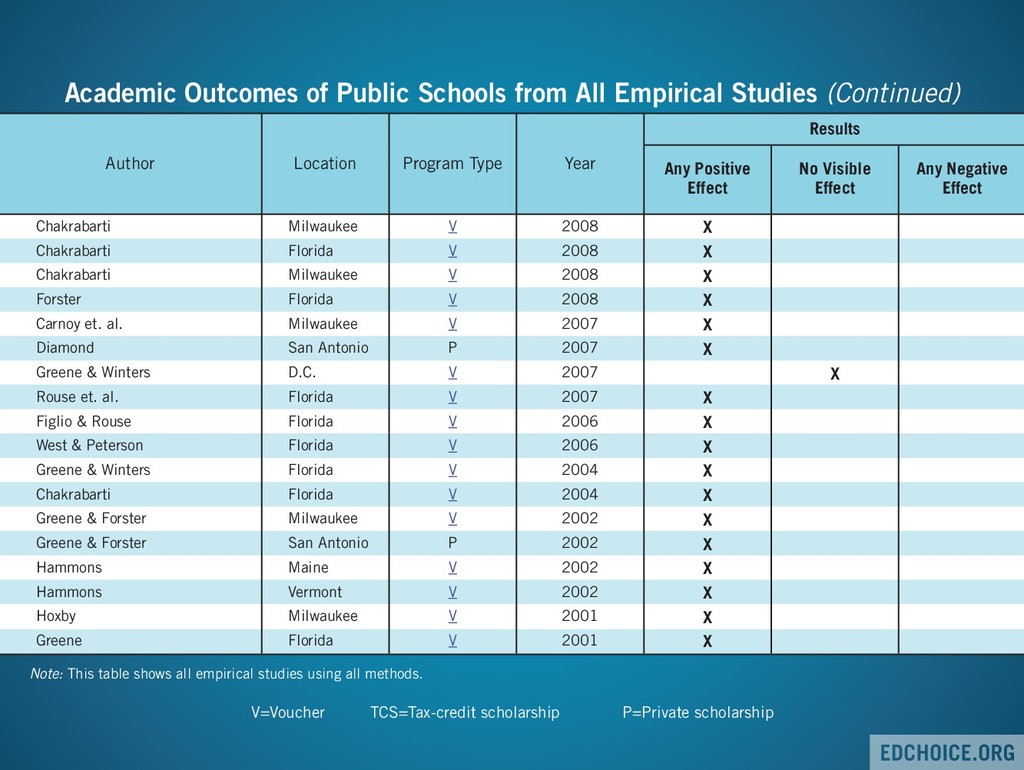
Effect Any Negative Effect Results 2008 2008 2008 2008 2007 2007 2007 2007 2006 2006 2004 2004 2002 2002 2002 2002 2001 2001 X X X X X X X X X X X X X X X X X X Milwaukee Florida Milwaukee Florida Milwaukee San Antonio D.C. Florida Florida Florida Florida Florida Milwaukee San Antonio Maine Vermont Milwaukee Florida V V V V V P V V V V V V V P V V V V Chakrabarti Chakrabarti Chakrabarti Forster Carnoy et. al. Diamond Greene & Winters Rouse et. al. Figlio & Rouse West & Peterson Greene & Winters Chakrabarti Greene & Forster Greene & Forster Hammons Hammons Hoxby Greene Academic Outcomes of Public Schools from All Empirical Studies (Continued) Note: This table shows all empirical studies using all methods. V=Voucher TCS=Tax-credit scholarship P=Private scholarship
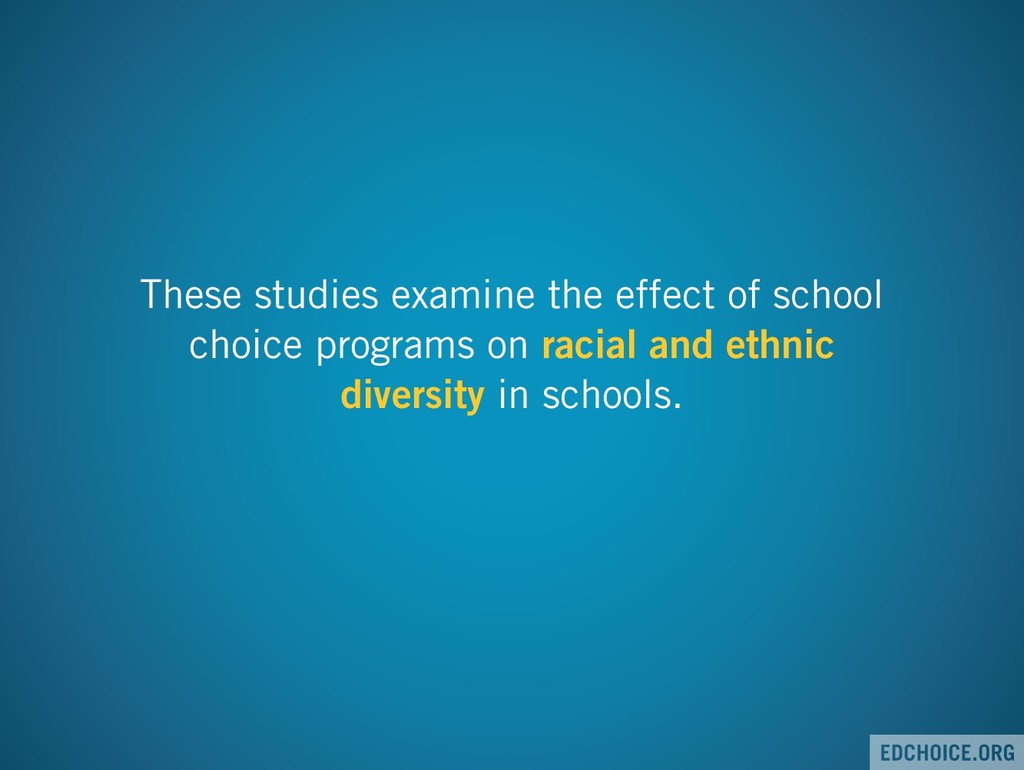
choice programs has an effect on students’ tolerance for the rights of others, civic knowledge, engaging in criminal activity, civic participation, volunteerism, social capital, civic skills, voter registration and turnout as well as patriotism.
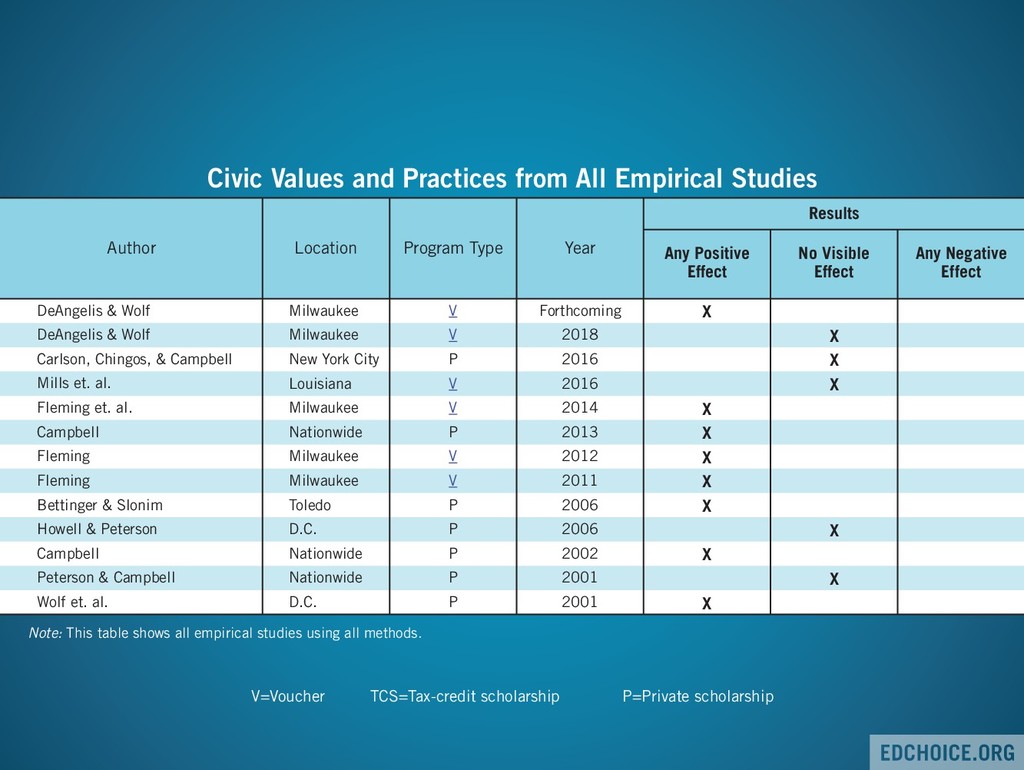
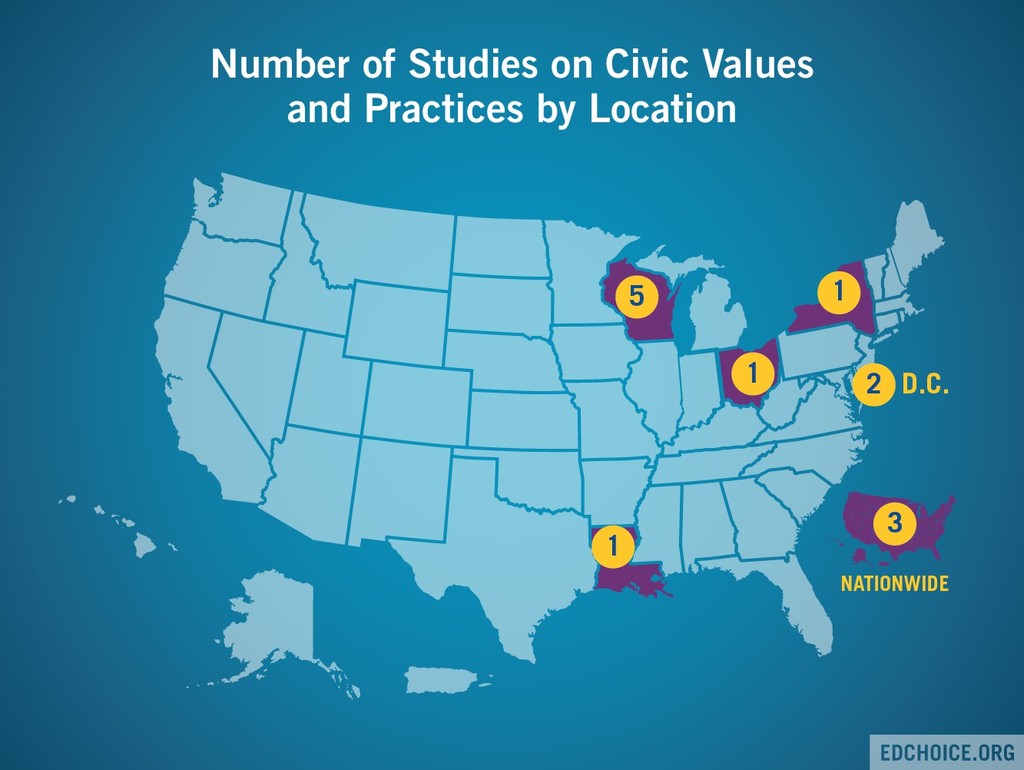
Effect Any Negative Effect Results Forthcoming 2018 2016 2016 2014 2013 2012 2011 2006 2006 2002 2001 2001 V V P V V P V V P P P P P X X X X X X X X X X X X X Milwaukee Milwaukee New York City Louisiana Milwaukee Nationwide Milwaukee Milwaukee Toledo D.C. Nationwide Nationwide D.C. DeAngelis & Wolf DeAngelis & Wolf Carlson, Chingos, & Campbell Mills et. al. Fleming et. al. Campbell Fleming Fleming Bettinger & Slonim Howell & Peterson Campbell Peterson & Campbell Wolf et. al. Civic Values and Practices from All Empirical Studies Note: This table shows all empirical studies using all methods. V=Voucher TCS=Tax-credit scholarship P=Private scholarship
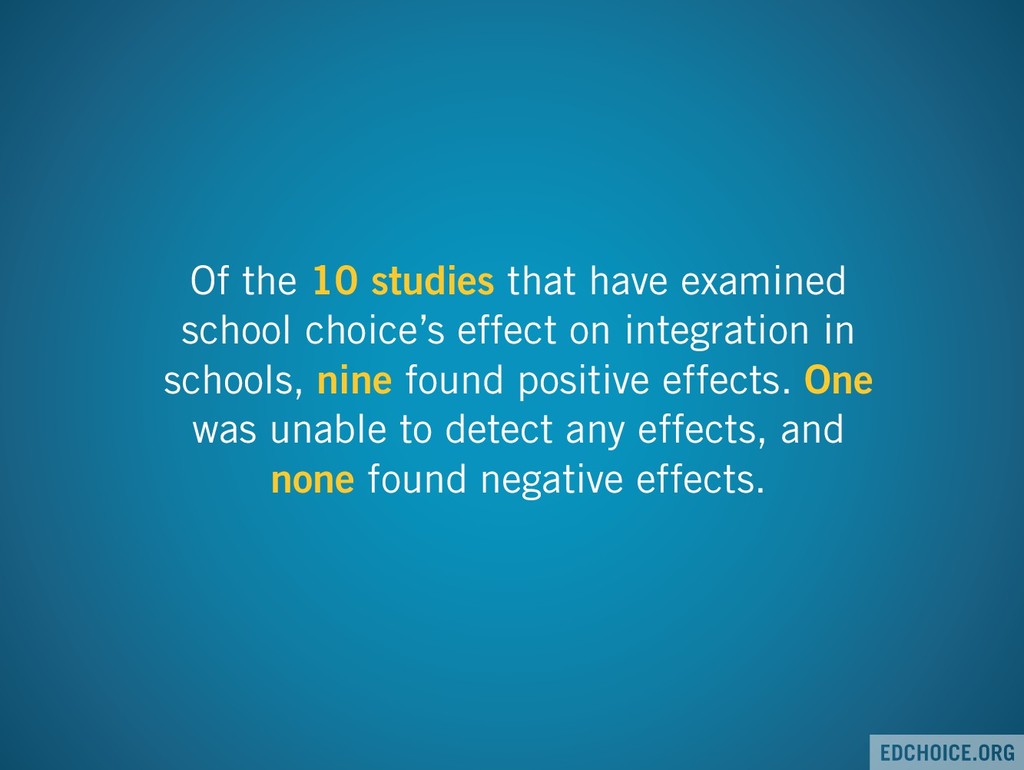
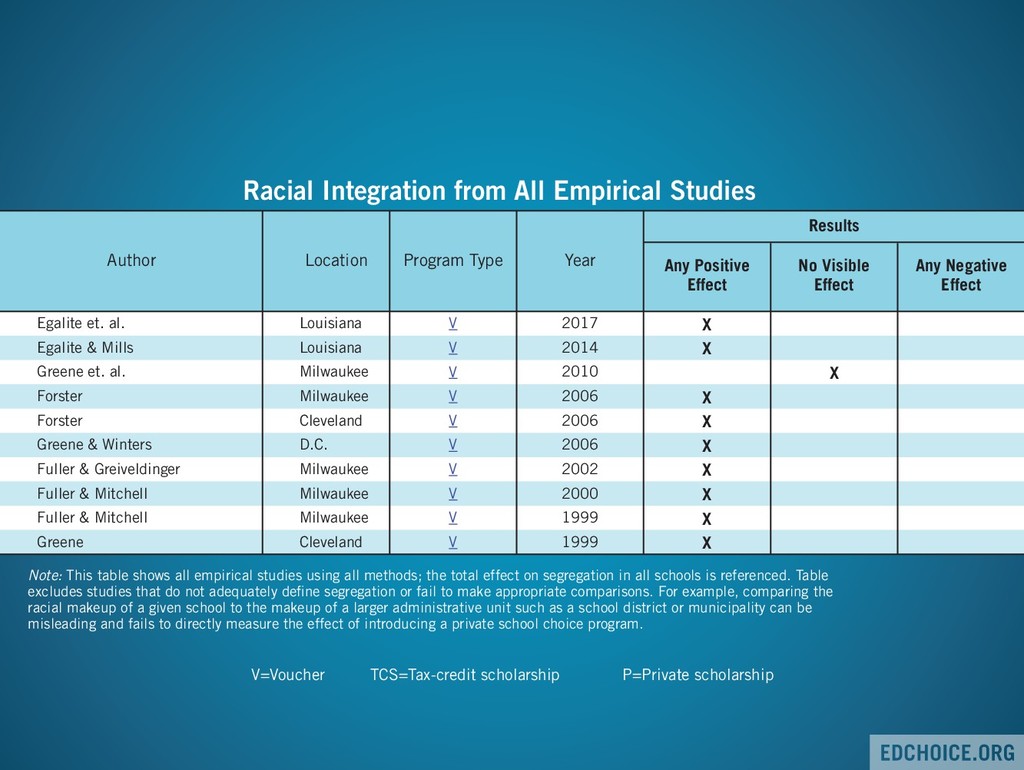
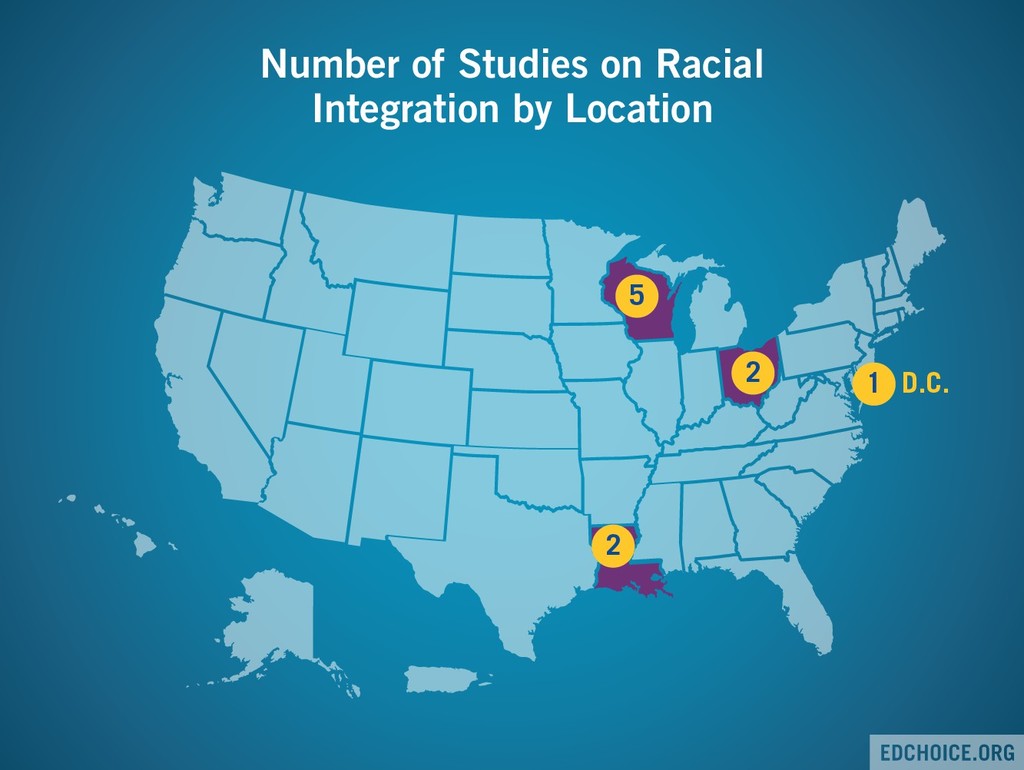
Negative Effect Results 2017 2014 2010 2006 2006 2006 2002 2000 1999 1999 Program Type V V V V V V V V V V X X X X X X X X X X Louisiana Louisiana Milwaukee Milwaukee Cleveland D.C. Milwaukee Milwaukee Milwaukee Cleveland Egalite et. al. Egalite & Mills Greene et. al. Forster Forster Greene & Winters Fuller & Greiveldinger Fuller & Mitchell Fuller & Mitchell Greene Racial Integration from All Empirical Studies Note: This table shows all empirical studies using all methods; the total effect on segregation in all schools is referenced. Table excludes studies that do not adequately define segregation or fail to make appropriate comparisons. For example, comparing the racial makeup of a given school to the makeup of a larger administrative unit such as a school district or municipality can be misleading and fails to directly measure the effect of introducing a private school choice program. V=Voucher TCS=Tax-credit scholarship P=Private scholarship
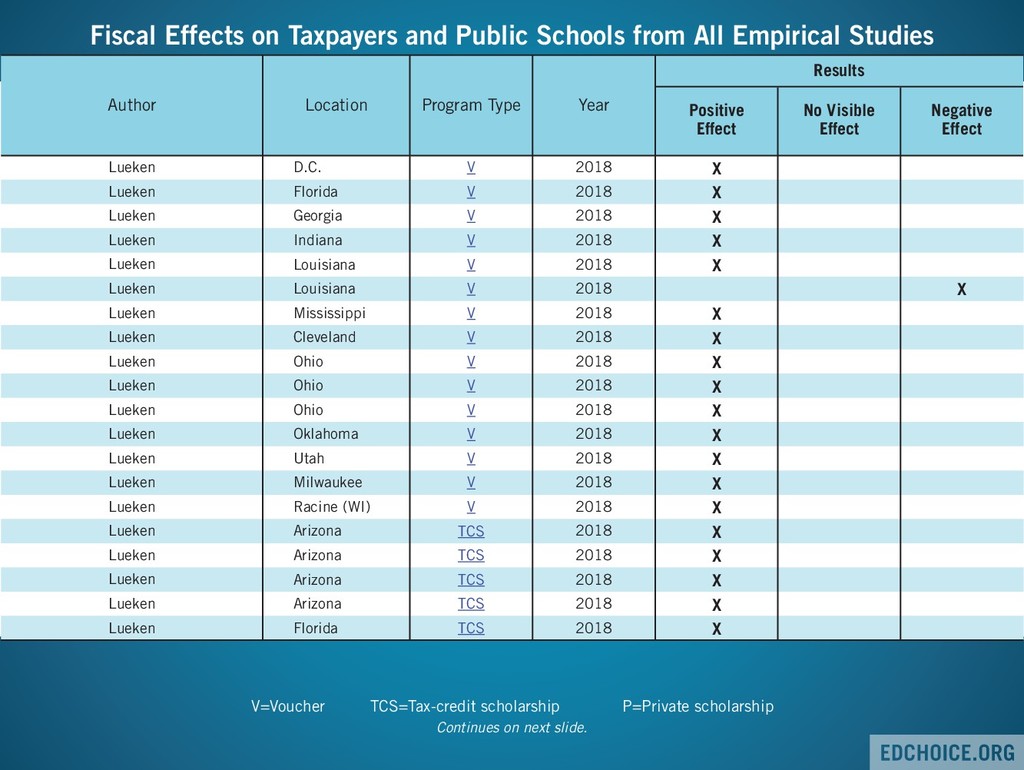
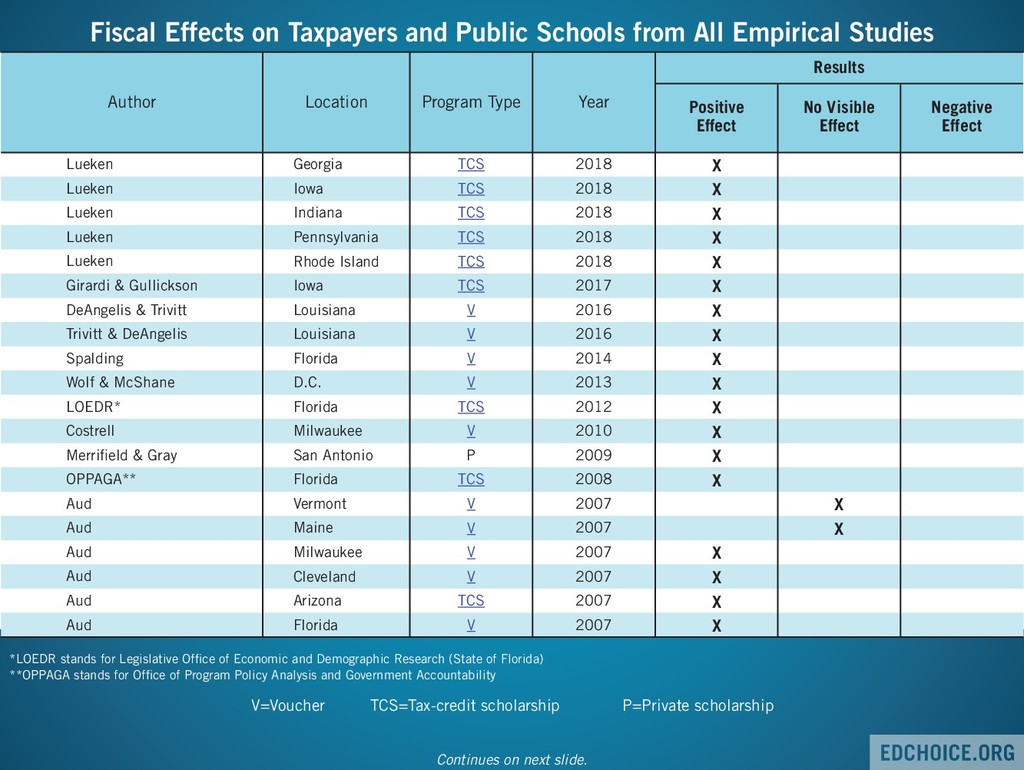
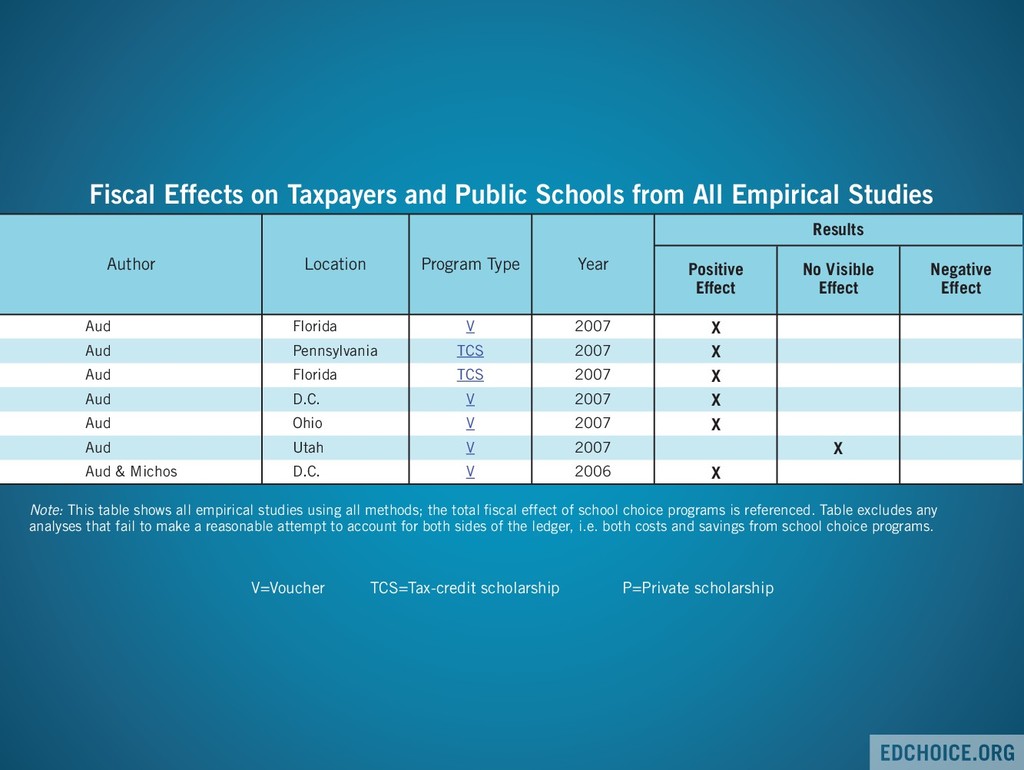
school choice programs, 43 found programs generated savings for taxpayers. Three found those programs were cost- neutral. One study has found a private school choice program generated net costs.
Effect No Visible Effect Negative Effect Results 2018 2018 2018 2018 2018 2018 2018 2018 2018 2018 2018 2018 2018 2018 2018 2018 2018 2018 2018 2018 V V V V V V V V V V V V V V V TCS TCS TCS TCS TCS X X X X X X X X X X X X X X X X X X X X D.C. Florida Georgia Indiana Louisiana Louisiana Mississippi Cleveland Ohio Ohio Ohio Oklahoma Utah Milwaukee Racine (WI) Arizona Arizona Arizona Arizona Florida Lueken Lueken Lueken Lueken Lueken Lueken Lueken Lueken Lueken Lueken Lueken Lueken Lueken Lueken Lueken Lueken Lueken Lueken Lueken Lueken Fiscal Effects on Taxpayers and Public Schools from All Empirical Studies V=Voucher TCS=Tax-credit scholarship P=Private scholarship
(State of Florida) **OPPAGA stands for Office of Program Policy Analysis and Government Accountability Continues on next slide. Author Location Program Type Year Positive Effect No Visible Effect Negative Effect Results 2018 2018 2018 2018 2018 2017 2016 2016 2014 2013 2012 2010 2009 2008 2007 2007 2007 2007 2007 2007 TCS TCS TCS TCS TCS TCS V V V V TCS V P TCS V V V V TCS V X X X X X X X X X X X X X X X X X X X X Georgia Iowa Indiana Pennsylvania Rhode Island Iowa Louisiana Louisiana Florida D.C. Florida Milwaukee San Antonio Florida Vermont Maine Milwaukee Cleveland Arizona Florida Lueken Lueken Lueken Lueken Lueken Girardi & Gullickson DeAngelis & Trivitt Trivitt & DeAngelis Spalding Wolf & McShane LOEDR* Costrell Merrifield & Gray OPPAGA** Aud Aud Aud Aud Aud Aud Fiscal Effects on Taxpayers and Public Schools from All Empirical Studies V=Voucher TCS=Tax-credit scholarship P=Private scholarship
the total fiscal effect of school choice programs is referenced. Table excludes any analyses that fail to make a reasonable attempt to account for both sides of the ledger, i.e. both costs and savings from school choice programs. Author Location Program Type Year Positive Effect No Visible Effect Negative Effect Results 2007 2007 2007 2007 2007 2007 2006 V TCS TCS V V V V X X X X X X X Florida Pennsylvania Florida D.C. Ohio Utah D.C. Aud Aud Aud Aud Aud Aud Aud & Michos Fiscal Effects on Taxpayers and Public Schools from All Empirical Studies V=Voucher TCS=Tax-credit scholarship P=Private scholarship
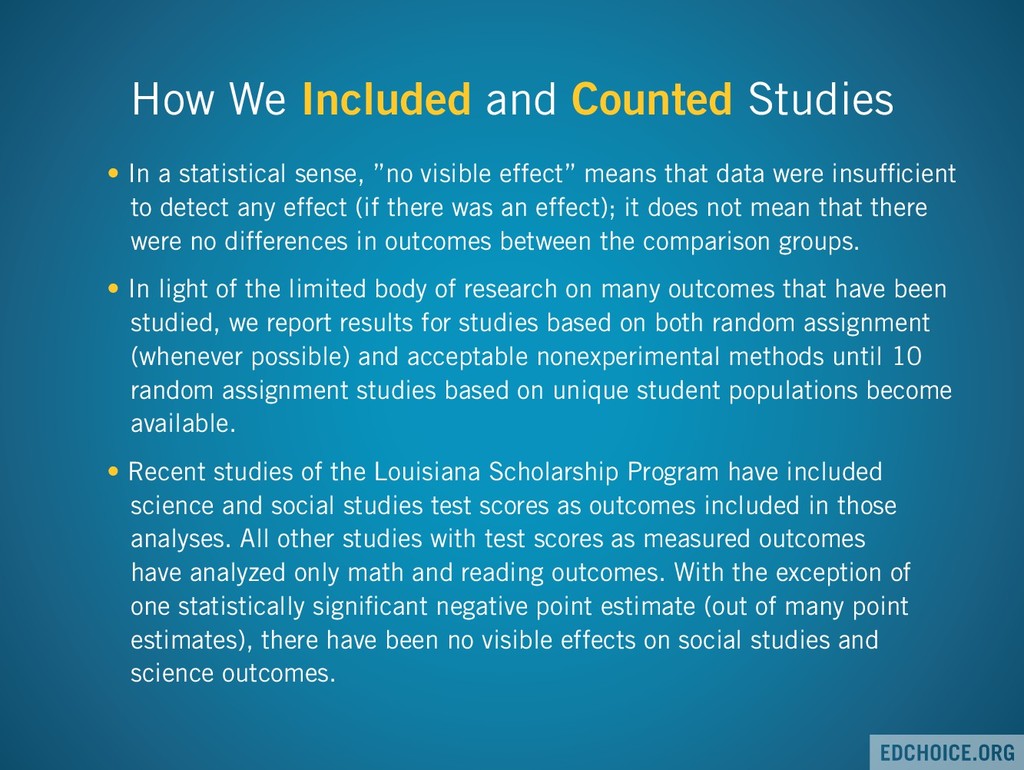
inclusion and counting criteria on methods used in EdChoice’s A Win-Win Solution: The Empirical Evidence on School Choice (4th ed.) report. • A “study” is defined as an analysis of a school choice program. We consider multiple studies on one program as unique if they study a different group of students or use different statistical models or research methods. • If a study’s analysis produced any positive or negative results or both, we classify those studies as positive, negative or both. • Studies that did not produce any statistically significant results are classified as “no visible effect.”
sense, ”no visible effect” means that data were insufficient to detect any effect (if there was an effect); it does not mean that there were no differences in outcomes between the comparison groups. • In light of the limited body of research on many outcomes that have been studied, we report results for studies based on both random assignment (whenever possible) and acceptable nonexperimental methods until 10 random assignment studies based on unique student populations become available. • Recent studies of the Louisiana Scholarship Program have included science and social studies test scores as outcomes included in those analyses. All other studies with test scores as measured outcomes have analyzed only math and reading outcomes. With the exception of one statistically significant negative point estimate (out of many point estimates), there have been no visible effects on social studies and science outcomes.