Upgrade to Pro — share decks privately, control downloads, hide ads and more …

Using Data and Charts

eHNA Team
September 25, 2015
470

Using Data and Charts

eHNA Team

September 25, 2015
Tweet

Transcript

  1. eHNA Data and Charts Data is collected each time a

    care plan is completed. The data includes concerns, actions as well as the pathway stages. This user guide will assist you to view and extract data that your trust has collected from performing the care plans. Please note that name and date of birth, are not collected. Index Viewing top concerns 3 Extracting data into spreadsheets 4 Display the concerns in a meaningful format 7 Data Store 8 Creating subsets of data 10-13 Looking at the data: Activity 14-15 Age and Gender 16 Clinical Information 17 Summary 18 Concerns 19 Concerns in detail 20 Information needs 21 Actions 22 Actions Breakdown 21
  2. Viewing top concerns Click on ‘Data & Charts’ located along

    the top of the screen. This screen shows the top 10 concerns overall from saved care plans. Just below this box, is a ‘See all’ button that expands the list to show every concern. •Note that sample data is shown here. 3
  3. Extracting data into spreadsheets Sometimes you may want to see

    the data in a different visual format such as graphs. You may also want to include this data in presentations or reports. If this is the case, click on the ‘Export to CSV’ link which is underneath the table. 4
  4. Extracting data into spreadsheets (cont) Once the CSV file has

    downloaded, you can click on it to open. 5
  5. Displaying the concerns in a meaningful format Clicking on the

    downloaded file, will open your data in Excel. You can then work with it to produce whatever graphs and charts you need. The example here shows the data being used to create a chart to the top 10 concerns for people diagnosis with cancer. 6
  6. Data Store Looking at the left column of the ‘Data

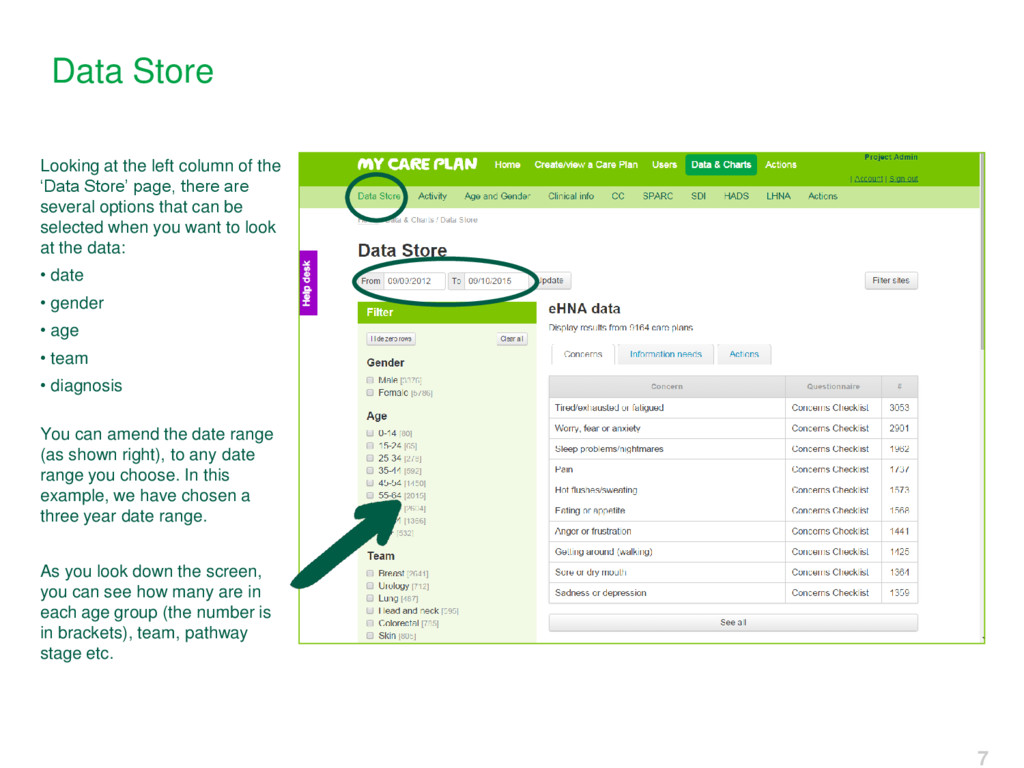
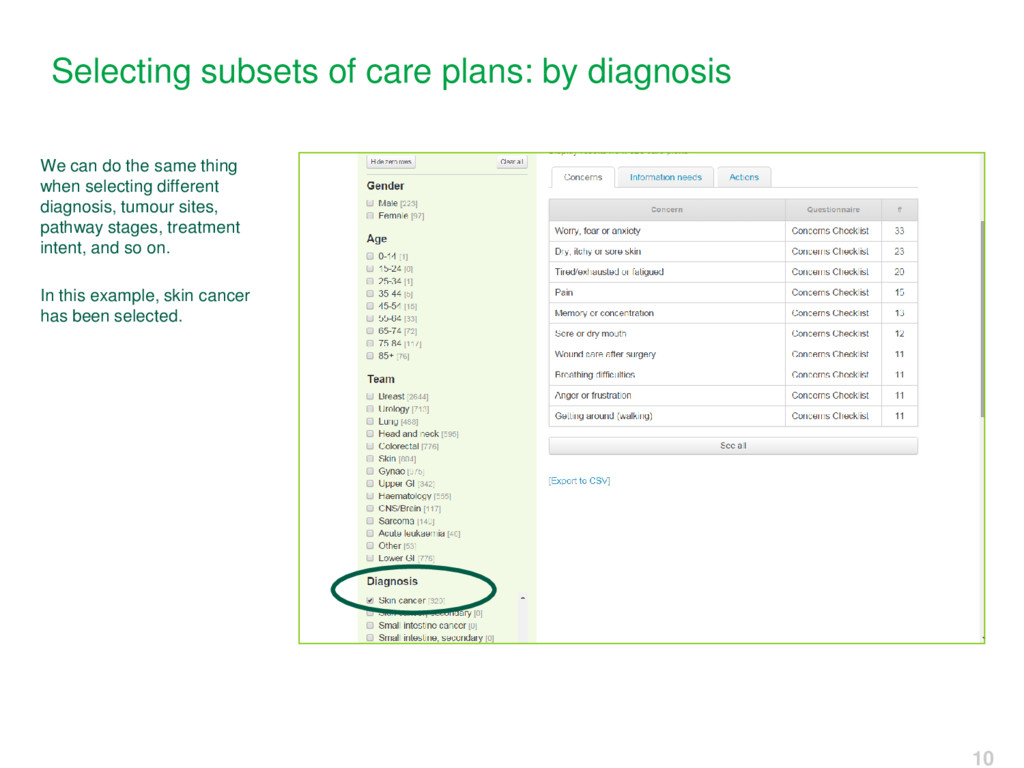
    Store’ page, there are several options that can be selected when you want to look at the data: • date • gender • age • team • diagnosis You can amend the date range (as shown right), to any date range you choose. In this example, we have chosen a three year date range. As you look down the screen, you can see how many are in each age group (the number is in brackets), team, pathway stage etc. 7
  7. Selecting subsets of data: 25-44 age groups Here, we’ve selected

    the 25- 44 age groups. As a result, the concerns will automatically update to those concerns for these age groups. The process is exactly the same whichever age range you select. You’ll notice that changing the age group, will change some of the concerns, or order, that appear in the list. 8
  8. Selecting subsets of care plans: by team You can also

    view care plan data by teams. By selecting a specific team such as colorectal (lower GI is automatically selected), you will see that the concerns automatically update to reflect that team’s top concerns. 9
  9. Selecting subsets of care plans: by diagnosis We can do

    the same thing when selecting different diagnosis, tumour sites, pathway stages, treatment intent, and so on. In this example, skin cancer has been selected. 10
  10. Looking at data: activity The ‘Activity’ page displays general data

    about the assessments and care plans undertaken within your site. You can also see further data under the heading ‘Assessment’. This will show the average number of concerns, average number of information needs and time taken for assessment to be completed. Information under the heading ‘Care plans’ shows the number of care plans completed, the conversion rate from assessments to care plans and the average number of actions per care plan. 11
  11. ‘Care plan downloads’ refers to the number of care plans

    downloaded at your site. It will show which format the care plan has been down loaded. ‘Care plan outcomes’, collates ‘how the care plan was shared with the patient’. Looking at data: activity (cont) 12
  12. Looking at data: age and gender As you’d expect, clicking

    on ‘Age and Gender’ displays the range of ages with the genders of people who have completed care plans. 13
  13. Looking at data: clinical information The next tab ‘Clinical info’,

    gives a quick overview of the diagnoses, pathway stages, stratified care and treatment status. You can see that in this sample, the biggest tumour type is breast cancer. Your site may perform care plans on different tumour sites, hence the numbers and tumour types will be different. 14
  14. Looking at data: summary If you click on CC, it

    will show the results for the Concerns Checklist (In London, click on LHNA). ‘Concerns by count’ will show the most commonly mentioned concerns. ‘Concerns by score’ takes into account the level of concern. ‘Information needs’ are shown below these two charts. 15
  15. Looking at data: concerns For a more detailed look, click

    on the Concerns tab. If you scroll down, you will see there is a table at the bottom listing all concerns raised, together with their score, number of times they were raised, and a male-female split. You can click on each concern for further detail. There is an ‘Export to CSV’ option at the bottom of this page. 16
  16. Looking at data: concerns in detail Clicking on a concern

    ‘Worry, fear or anxiety’, brings up more detail. We can see that around a quarter of assessments gave this concern a score of 1-4, and almost a half gave it a score of 7-10. We can see the familiar male- female split here. There is more information available if we scroll down the screen. 17
  17. Beneath the age and gender charts, we can see the

    most common diagnoses for ‘worry, fear or anxiety’. The pathway stage, stratified care, and treatment status are also shown on this screen. At the bottom of the page, you will see the list of actions for each concern. Looking at data: concerns in detail (cont) 18
  18. Looking at data: information needs If we go back to

    the previous page and select the ‘Information needs’ tab, we can see how many people have requested each type of information. *Note that this only applies to the Concerns Checklist, SPARC and SDI. LHNA does not ask information needs. You’ll notice that the list at the bottom is again in the form of links, and that clicking on these will go into more detail on those specific information requests. 19
  19. Looking at data: actions Finally, clicking on the ‘Actions’ tab

    at the top of the screen, will show you the summary of data collected, These are split into ‘Clinician Actions’, and ‘Patient Actions’ You can then click on ‘Actions Breakdown’ for further detail. 20
  20. Looking at data: actions breakdown Clicking the ‘Actions breakdown’ link,

    on the previous screen, will take you to this page. It shows the actions, how many times each has been raised, and the male-female split. There is also a ‘Export to CSV’ link at the bottom of the page. Note that there are separate lists for clinician and patient actions. 21
  21. Now you’re ready to explore your data That’s a very

    quick rundown of the data that’s available from eHNA at the moment. To produce the aggregate data, all personal data, such as name, date of birth has been removed. More reporting functions are on the way. If there’s something specific that you need, please let us know so that we can consider building it into the system. If you have any queries or concerns, please contact [email protected]