Upgrade to Pro — share decks privately, control downloads, hide ads and more …

Building an IT Health Check and Diagnosis App on the Elastic Stack

Elastic Co
February 18, 2016

Building an IT Health Check and Diagnosis App on the Elastic Stack

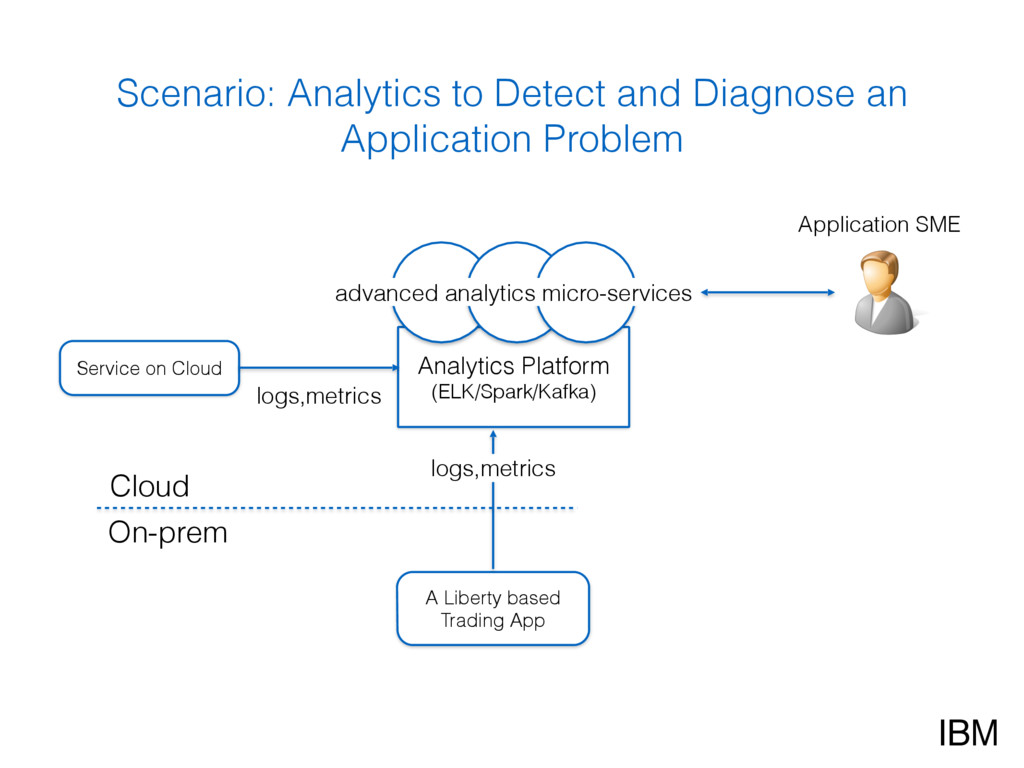
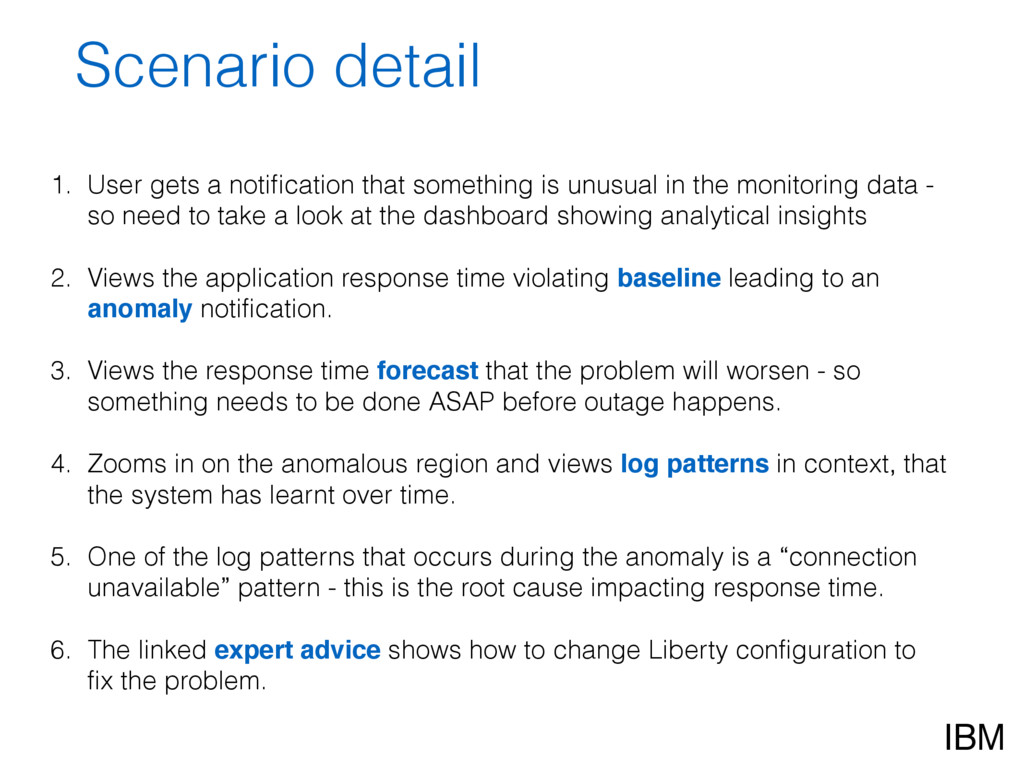
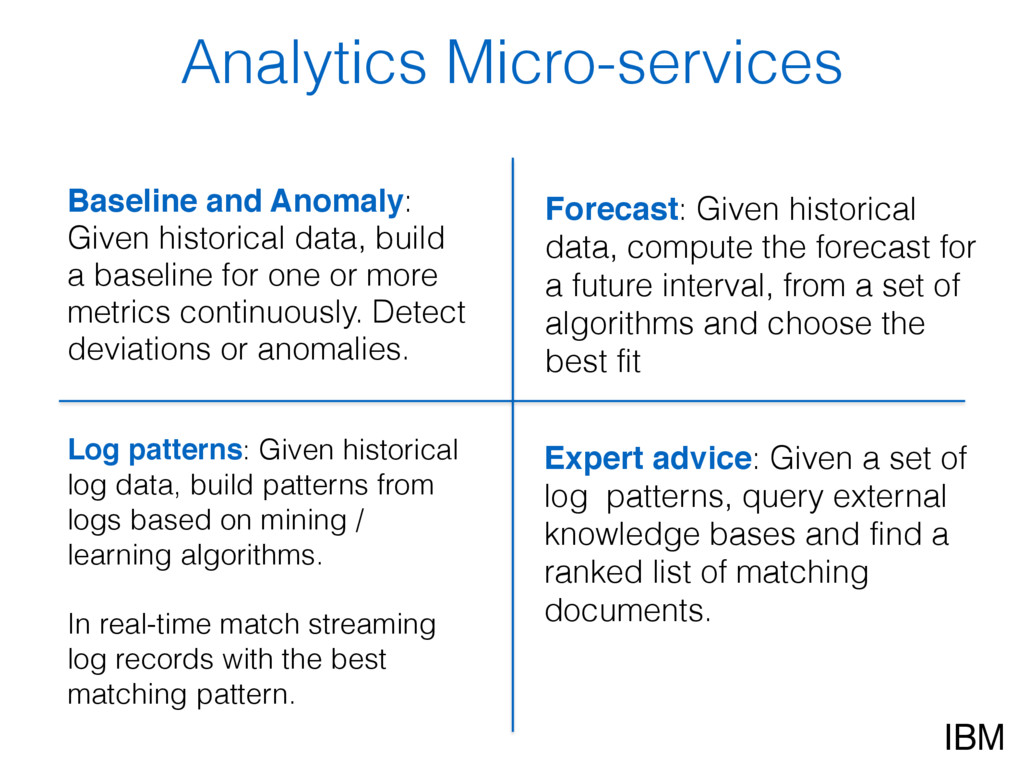
IT monitoring systems collect different types of operations data at an infrastructure and application level. This session will demonstrate how advanced analytics micro-services use the data to add value on top of monitoring dashboards, such as detect anomalies, forecast KPIs, and diagnose a problem quickly.

Elastic Co

February 18, 2016
Tweet

More Decks by Elastic Co

Other Decks in Technology

Transcript

  1. IBM Building an IT Health check and Diagnosis application on

    Elastic stack 18 Feb 2016 SpotLight Session at Elastic{ON}16 Anindya Neogi, PhD Chief Architect, IBM Operations Analytics IBM Cloud [email protected]
  2. IBM Agenda • Scenario • Demo • High level architecture

    on Elastic stack and Spark • Things to consider
  3. IBM A Liberty based Trading App Service on Cloud Analytics

    Platform (ELK/Spark/Kafka) Cloud On-prem logs,metrics advanced analytics micro-services logs,metrics Application SME Scenario: Analytics to Detect and Diagnose an Application Problem
  4. IBM Scenario detail 1. User gets a notification that something

    is unusual in the monitoring data - so need to take a look at the dashboard showing analytical insights 2. Views the application response time violating baseline leading to an anomaly notification. 3. Views the response time forecast that the problem will worsen - so something needs to be done ASAP before outage happens. 4. Zooms in on the anomalous region and views log patterns in context, that the system has learnt over time. 5. One of the log patterns that occurs during the anomaly is a “connection unavailable” pattern - this is the root cause impacting response time. 6. The linked expert advice shows how to change Liberty configuration to fix the problem.
  5. IBM Baseline and Anomaly: Given historical data, build a baseline

    for one or more metrics continuously. Detect deviations or anomalies. Analytics Micro-services Forecast: Given historical data, compute the forecast for a future interval, from a set of algorithms and choose the best fit Log patterns: Given historical log data, build patterns from logs based on mining / learning algorithms. In real-time match streaming log records with the best matching pattern. Expert advice: Given a set of log patterns, query external knowledge bases and find a ranked list of matching documents.
  6. Logstash ElasticSearch Other stores - e.g. Hive / HDFS Kibana

    Metric, Logs from collectors deployed on- prem or in Cloud send data tagged with tenant-id Analytics Micro-services Platform Data persistence with aggregation, join query capabilities Spark Kafka Building the Application on an open Platform Data at Rest Analysis e.g. behavior modeling, forecasting Data in Motion Analysis, e.g. generate alerts, detect anomalies in logs and metrics, dynamic thresholding etc. publish results data, results get data, publish results UI with modified widgets multi-tenant proxy get data, store results Indexers etc.
  7. IBM Things to consider • Multi-tenancy - modified log forwarder

    to insert tenant-id, added a proxy for query filtering based on tenant-id • Decide on data formats, Kafka topics, ES index structures so that log and metric consuming micro-services can execute on the data flow • Modify some Kibana widgets to get the right experience for metrics and logs, analytics output in one UI • Need more widget enhancements for timeline navigation, TimeLion does not sit in the dashboard with other charts • Putting metrics into ElasticSearch as JSON. Haven’t yet tested performance of accessing the data, aggregations etc. Aggregations are key to providing pre-processed data to higher level analytics. • Have a set of libraries for micro-services on Spark so that they can access Kafka data or ElasticSearch data. Built on existing community code. Need to test performance of data at rest analytics as the Spark logic and ElasticSearch data reside on different clusters.
  8. Demo: Kibana UI showing Analytics on Metrics and Logs to

    Detect and Diagnose a Problem Anomalous period Top/Bottom log patterns Log patterns Zoom in to Anomalous region log record instances for “connection unavailable” log pattern “connection unavailable” pattern Response time with baseline Forecast
  9. Using ElasticSearch Log and Metrics capability to Manage the Logging

    and Monitoring Service on IBM Bluemix • The IBM BlueMix Logging and Monitoring Service uses ElasticSearch today as our log management solution to help us run the 
 live service. • We also track various metrics about each component that makes up the service so we can quickly find and resolve issues. • We’ve recently started investigating ElasticSearch’s metrics capability as a replacement for what we currently use. • I’ll show you a quick demo of this in a development environment we have running in the cloud.