in online advertising space and early-stage startups • Large-scale Infrastructure, both Linux/Windows • Working with Log Aggregation Systems since 2008 • Elastic LA Meetup Organizer since March 2015 About Me 2
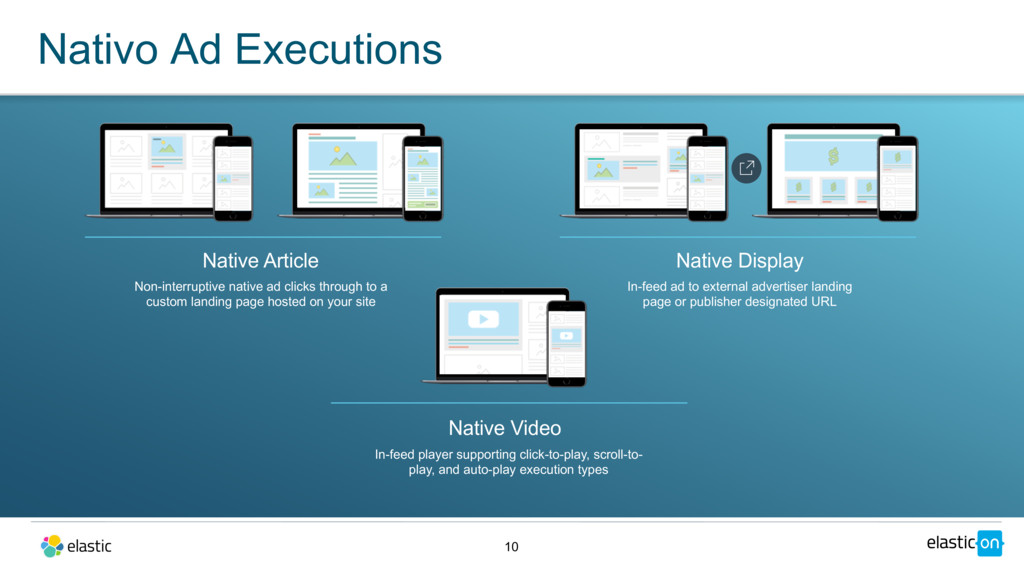
and auto-play execution types Native Video Non-interruptive native ad clicks through to a custom landing page hosted on your site Native Article In-feed ad to external advertiser landing page or publisher designated URL Native Display
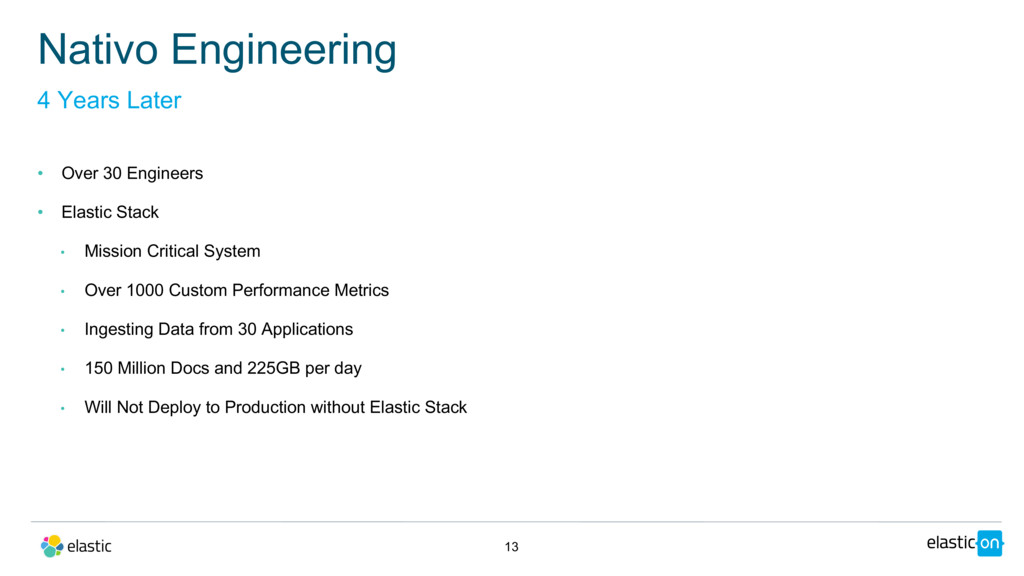
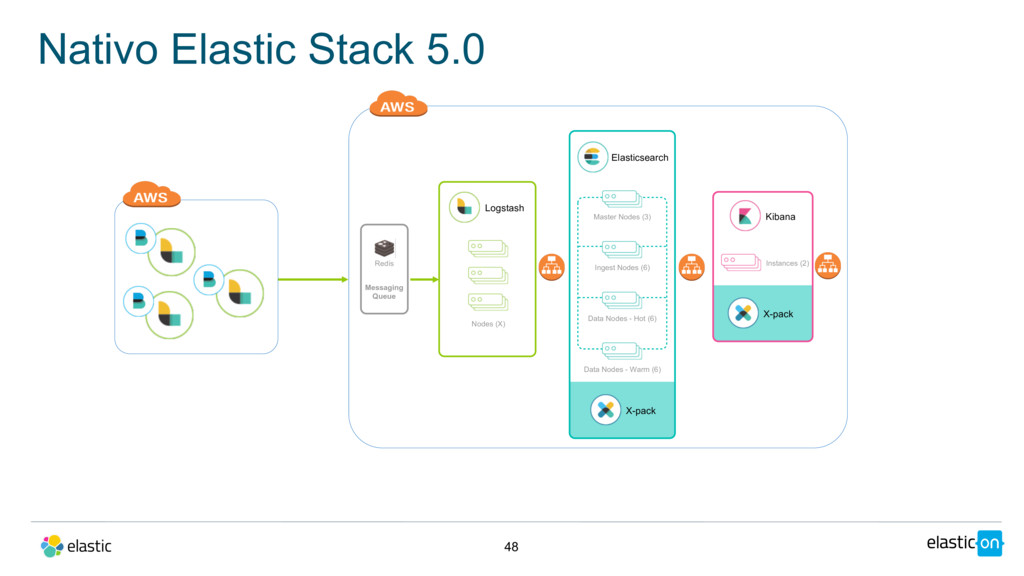
System • Over 1000 Custom Performance Metrics • Ingesting Data from 30 Applications • 150 Million Docs and 225GB per day • Will Not Deploy to Production without Elastic Stack Nativo Engineering 13 4 Years Later
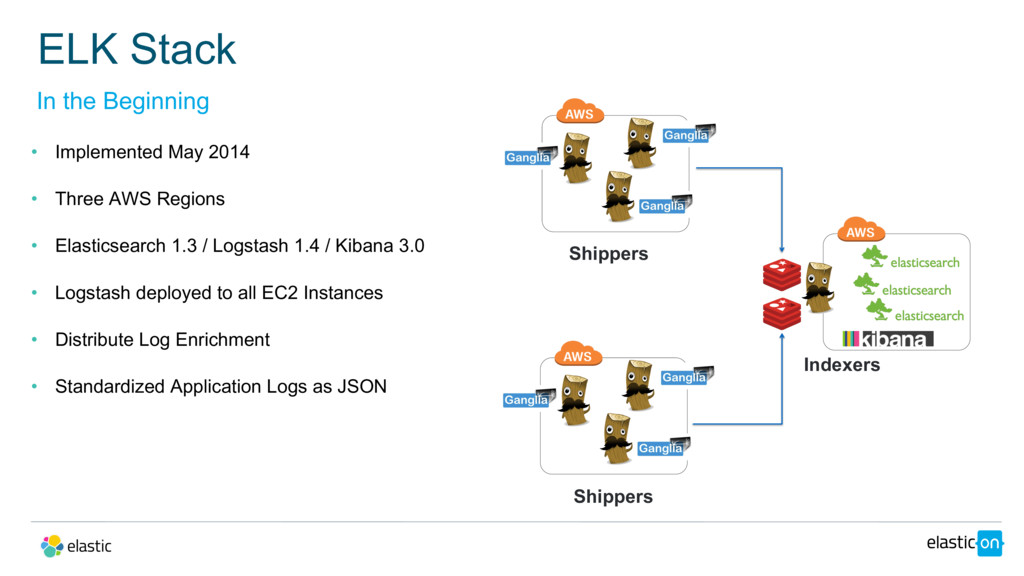
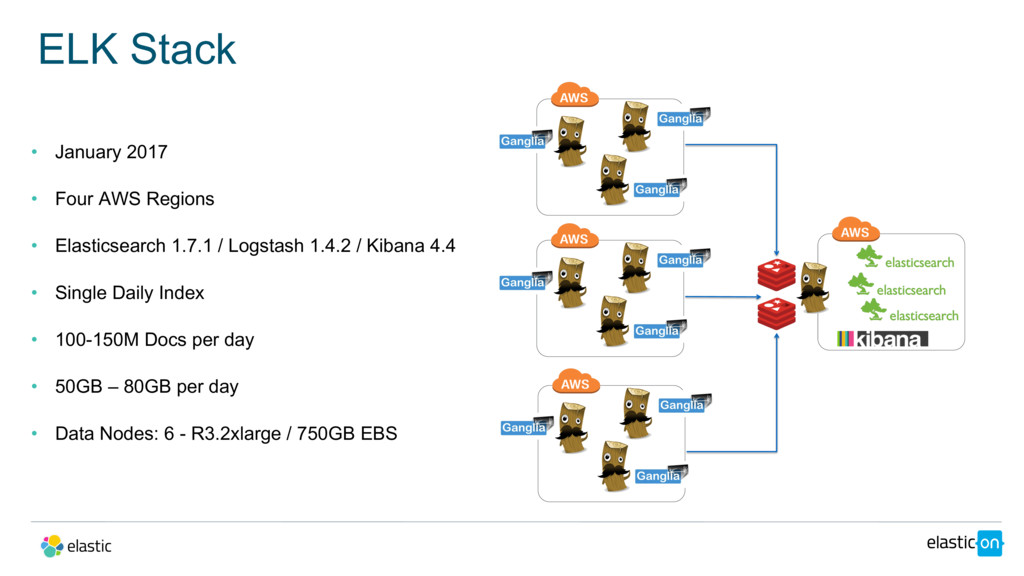
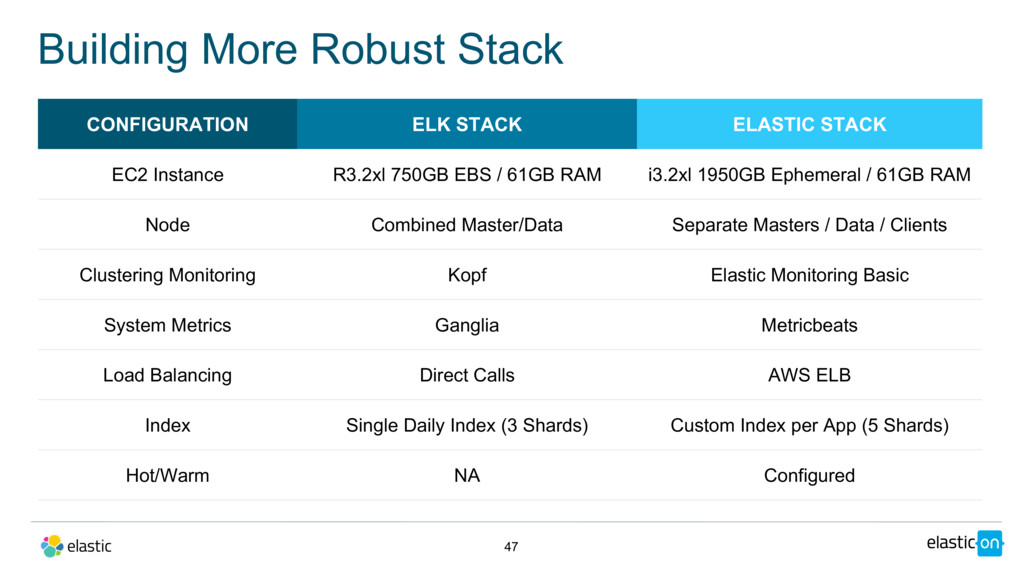
Elasticsearch 1.7.1 / Logstash 1.4.2 / Kibana 4.4 • Single Daily Index • 100-150M Docs per day • 50GB – 80GB per day • Data Nodes: 6 - R3.2xlarge / 750GB EBS
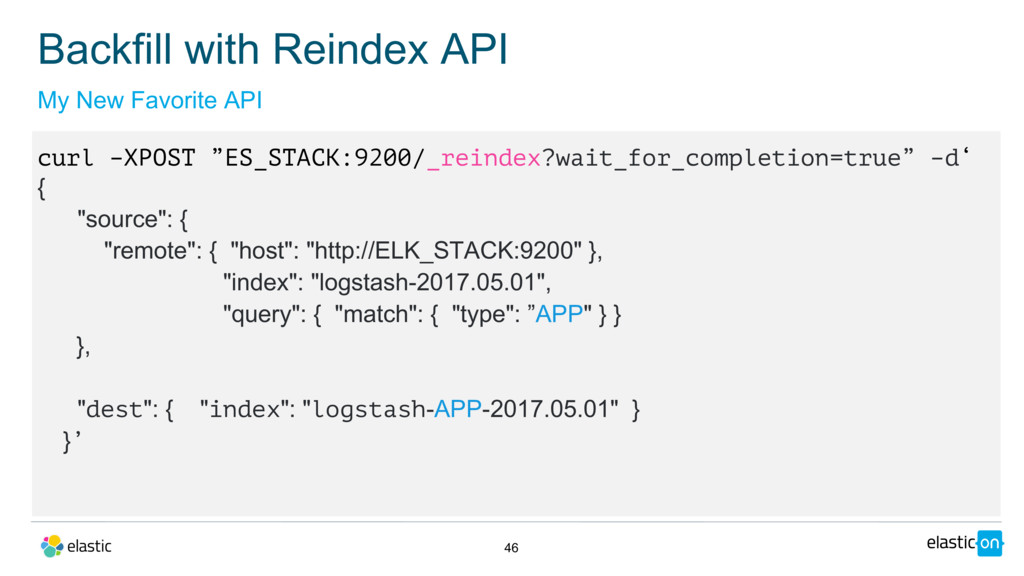
• metricbeat-[AppName]-YYYY.MM.DD • More flexibility • Per App Retention • Re-process Raw Logs • Utilize Reindex API Index Strategy 42 Abandon Single Daily Index
Creative Commons and the double C in a circle are registered trademarks of Creative Commons in the United States and other countries. Third party marks and brands are the property of their respective holders. 76 Please attribute Elastic with a link to elastic.co
![23 input { file { path => [ "/path/{ec2.APP}.json"] sincedb_path](https://files.speakerdeck.com/presentations/05a405e2771d42ea91564da480173bca/slide_22.jpg)
![28 output { elasticsearch { hosts =>[ “http://es01:9200”, “http://es02:9200”] flush_size](https://files.speakerdeck.com/presentations/05a405e2771d42ea91564da480173bca/slide_27.jpg)
![• Indices per App • Metrics vs Logging • logstash-[AppName]-YYYY.MM.DD](https://files.speakerdeck.com/presentations/05a405e2771d42ea91564da480173bca/slide_41.jpg)
![54 input { file { path => [ "/path/{ec2.APP}.json"] sincedb_path](https://files.speakerdeck.com/presentations/05a405e2771d42ea91564da480173bca/slide_53.jpg)
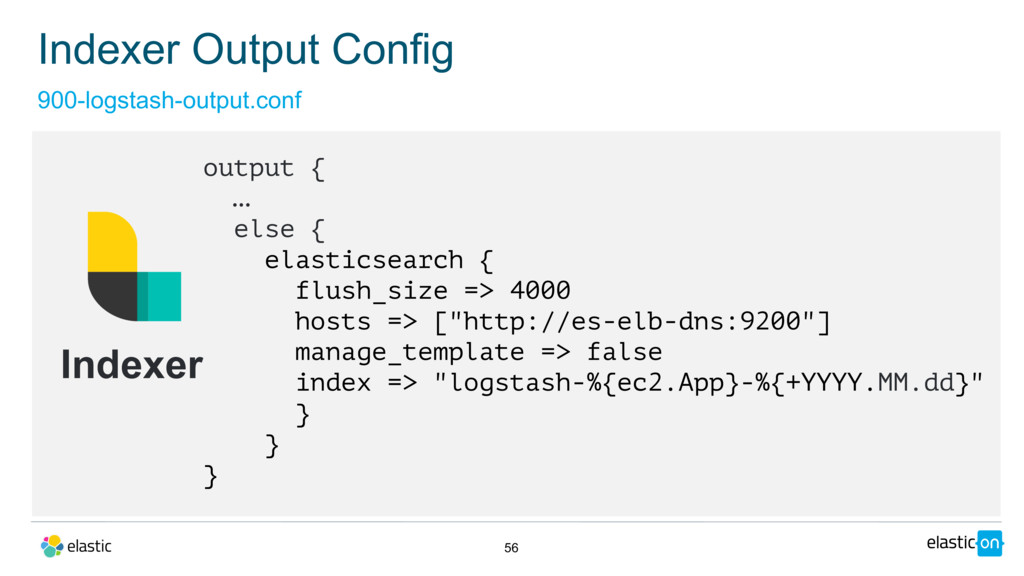
![55 output { if [ec2.IndxPat] == “weekly” { elasticsearch {](https://files.speakerdeck.com/presentations/05a405e2771d42ea91564da480173bca/slide_54.jpg)
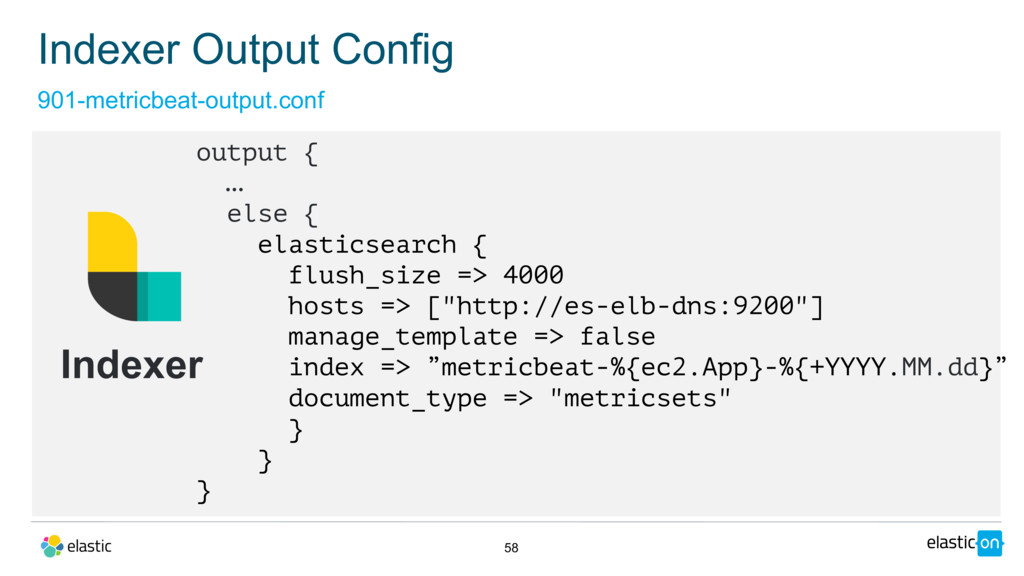
![57 output { if [ec2.IndxPat] == “weekly” { elasticsearch {](https://files.speakerdeck.com/presentations/05a405e2771d42ea91564da480173bca/slide_56.jpg)