Upgrade to Pro — share decks privately, control downloads, hide ads and more …

Monitoring Docker with Metricbeat

Elastic Co
March 08, 2017

Monitoring Docker with Metricbeat

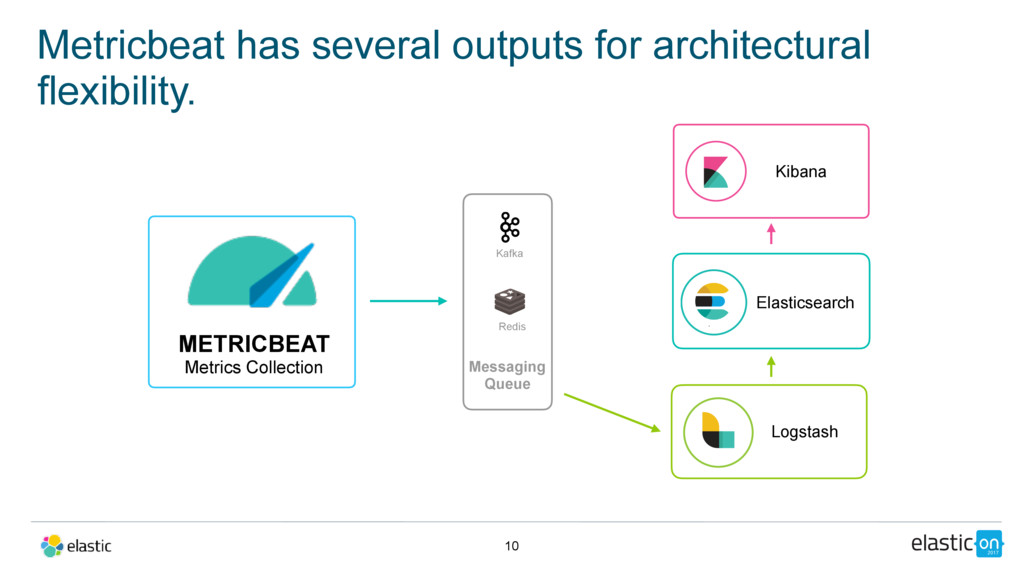
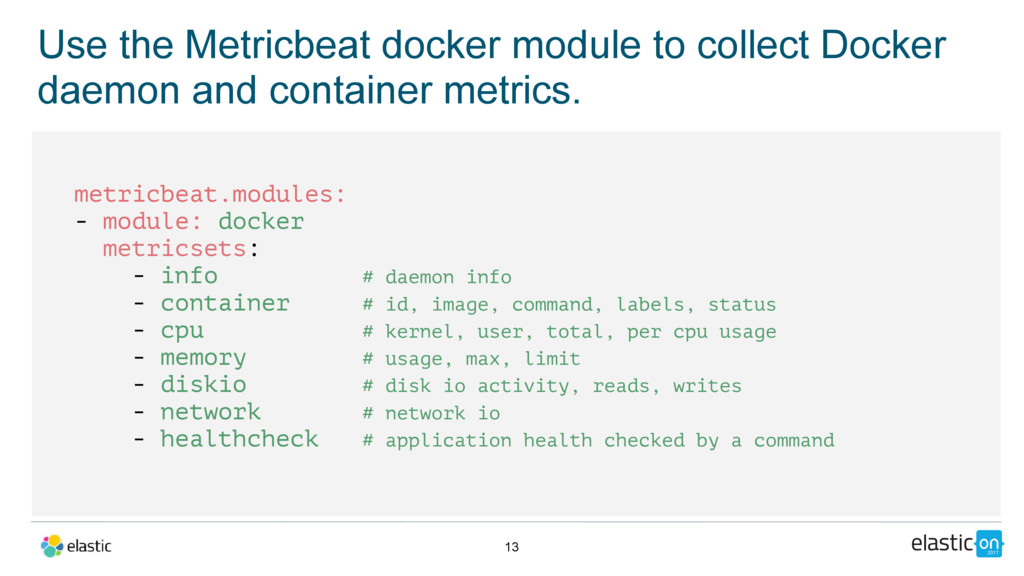
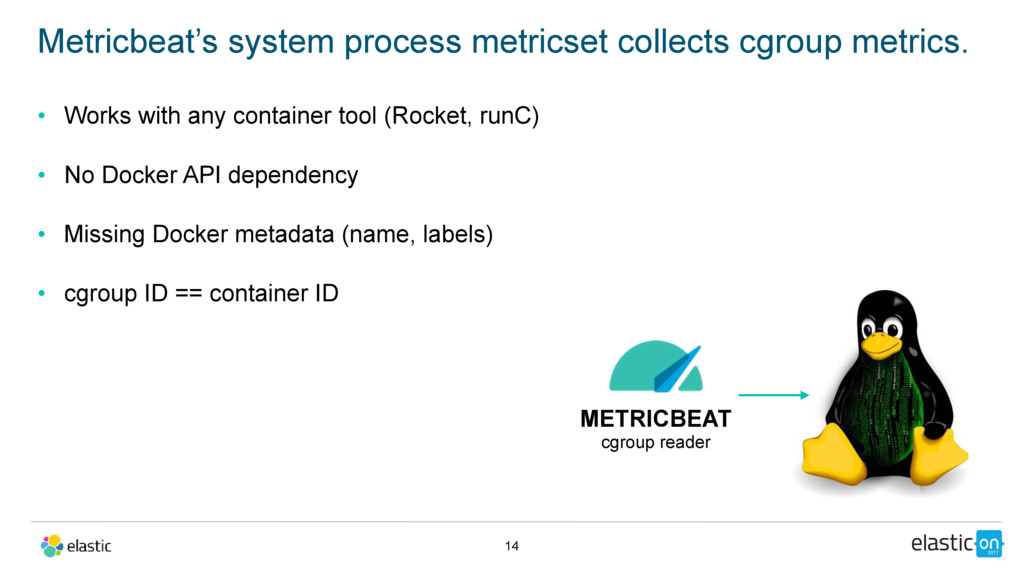
Over the past couple years, Docker environments have become more and more common. It is critical to monitor these environments. Metricbeat offers two different possibilities to monitor Docker containers: cgroups and Docker API.

In this talk, Andrew will discuss the differences and similarities between the two approaches with the pros and cons of each. He will also give a live demo to show how to set up Metricbeat for Docker monitoring and get insights.

Andrew Kroh l Software Engineer l Elastic

Elastic Co

March 08, 2017
Tweet

More Decks by Elastic Co

Other Decks in Technology

Transcript

  1. Elastic March 8, 2017 - 16:40 @andrewkroh Monitoring Docker with

    Metricbeat Andrew Kroh, Software Engineer
  2. • What should you be monitoring in your microservice architecture?

    • What is Metricbeat? • How can Metricbeat help monitor you container infrastructure? • Demo Agenda 3
  3. 4 • Decentralized • No Historical Data • Reactive monitoring

    • Doesn’t Scale docker ps / docker stats Built-in Tooling
  4. Monitor all the things that are critical to the availability

    of your service. 5 1 Network 2 Hosts 3 Containers 4 Applications
  5. Monitor all of the things that are critical to the

    availability of your service. 6 1 Network - switch / router monitoring via syslog and snmp traps with Logstash 2 Hosts 3 Containers 4 Applications
  6. Monitor all of the things that are critical to the

    availability of your service. 7 1 Network 2 Hosts - Metricbeat 3 Containers 4 Applications
  7. 8 metricbeat.modules: - module: system metricsets: - cpu # /proc/stat

    - load # /proc/loadavg - memory # /proc/meminfo - network # /proc/net/dev - diskio # /proc/diskstats - filesystem # /etc/mtab -> statfs() - fsstat - process # /proc/[pid]/{stat,status,statm,cmdline,environ} processes: ['.*'] cgroups: true Use the Metricbeat system module to monitor your hosts.
  8. 9 docker run \ -v /proc:/hostfs/proc:ro \ -v /sys/fs/cgroup:/hostfs/sys/fs/cgroup:ro \

    -v /:/hostfs:ro \ -v /var/run/docker.sock:/var/run/docker.sock \ my/metricbeat:latest -system.hostfs=/hostfs Metricbeat can be deployed on the host or in a container.
  9. 10 Metricbeat has several outputs for architectural flexibility. Logstash Elasticsearch

    Kafka Redis Messaging Queue Kibana METRICBEAT Metrics Collection
  10. 11 Elastic now has official container images for Beats. https://github.com/elastic/beats-docker

    FROM docker.elastic.co/beats/metricbeat:5.2.2 COPY metricbeat.yml /usr/share/metricbeat/metricbeat.yml
  11. Monitor all the things that are critical to the availability

    of your service. 12 1 Network 2 Hosts 3 Containers - Metricbeat 4 Applications
  12. 13 metricbeat.modules: - module: docker metricsets: - info # daemon

    info - container # id, image, command, labels, status - cpu # kernel, user, total, per cpu usage - memory # usage, max, limit - diskio # disk io activity, reads, writes - network # network io - healthcheck # application health checked by a command Use the Metricbeat docker module to collect Docker daemon and container metrics.
  13. • Works with any container tool (Rocket, runC) • No

    Docker API dependency • Missing Docker metadata (name, labels) • cgroup ID == container ID Metricbeat’s system process metricset collects cgroup metrics. 14 METRICBEAT cgroup reader
  14. Monitor all of the things that are critical to the

    availability of your service. 15 1 Network 2 Hosts 3 Containers 4 Applications - Metricbeat
  15. 16 metricbeat.modules: - module: mysql metricsets: [status] hosts: [“tcp(mysql01:3306)/"] username:

    root password: "${MYSQL_ROOT_PASSWORD}" Use the Metricbeat modules to monitor common applications.
  16. Monitor external services 17 Apache CEPH Couch base Docker Golang

    HAProxy Kafka MySQL NGINX PHP FPM Postgres Redis Prometheus Zoo keeper Mem cache
  17. 18 HEALTHCHECK CMD curl -f -s http://localhost:8081/metrics?json Parse the Docker

    healthcheck output to get metrics from your custom apps. In your Dockerfile: processors: - decode_json_fields: when.equals: docker.container.labels.service: myservice fields: - docker.healthcheck.event.output target: docker.healthcheck.myservice And in your metricbeat.yml:
  18. Monitor all the things that are critical to the availability

    of your service. 19 1 Network 2 Hosts 3 Containers 4 Applications
  19. 20 One Metricbeat container per Host Use Labels Set Resource

    Limits • Monitor the host, docker, and your apps from one container • Keep your sanity when scaling • Makes it easier to build dashboards and alerts • Set bounds for CPU, memory, block I/O Pro Tips
  20. Except where otherwise noted, this work is licensed under http://creativecommons.org/licenses/by-nd/4.0/

    Creative Commons and the double C in a circle are registered trademarks of Creative Commons in the United States and other countries. Third party marks and brands are the property of their respective holders. 24 Please attribute Elastic with a link to elastic.co
  21. 26

  22. 27

  23. Sample healthcheck event 28 "docker": { "container": { "id": "83c3355dc06f8b2fbe225c4e3638bd025f5140ef638c6b115e85995c217fbe1f",

    "labels": { "co_elastic_service_name": "elasticon", "com_docker_compose_config-hash": "ee66c7f94c1a134acad038ac9bc583424806f96446f594f623c45c76f615ff4e", "com_docker_compose_container-number": "1", "com_docker_compose_oneoff": "False", "com_docker_compose_project": "metricbeatdocker", "com_docker_compose_service": "elasticon", "com_docker_compose_version": "1.11.2" }, "name": "metricbeatdocker_elasticon_1" }, "healthcheck": { "elasticon": { "http_200": 15032, "http_404": 20875, "http_total_requests": 35907 }, "event": { "end_date": "2017-03-08T07:06:51.514Z", "exit_code": 0, "output": "{\n\"http_200\": 15032,\n\"http_404\": 20875,\n\"http_total_requests\": 35907\n}\n", "start_date": "2017-03-08T07:06:51.345Z" }, "failingstreak": 0, "status": "healthy" } }