Upgrade to Pro — share decks privately, control downloads, hide ads and more …

Performance Monitoring with the ELK Stack: collectd AND An Early Look at Alerting for Elasticsearch

Performance Monitoring with the ELK Stack: collectd AND An Early Look at Alerting for Elasticsearch

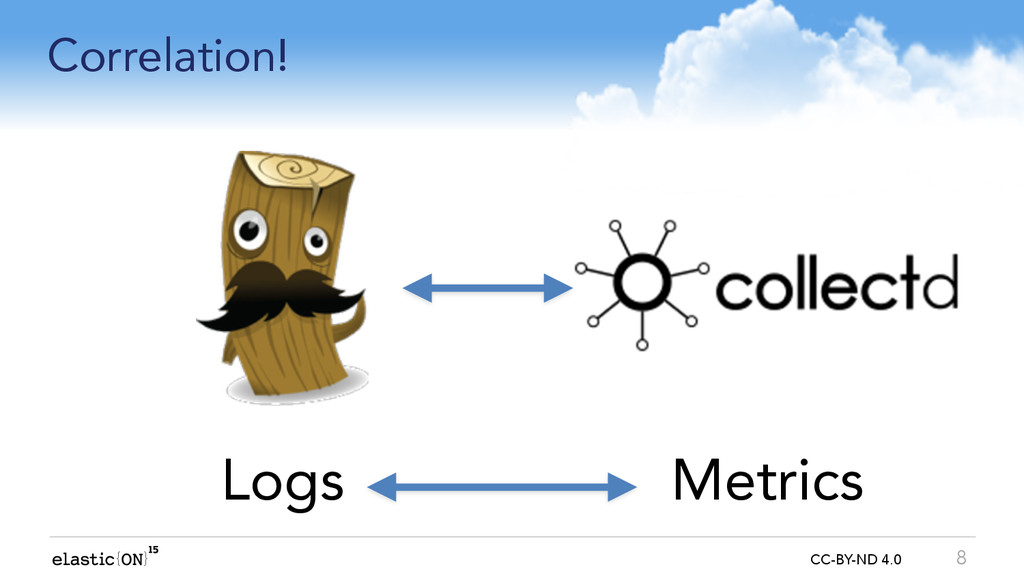
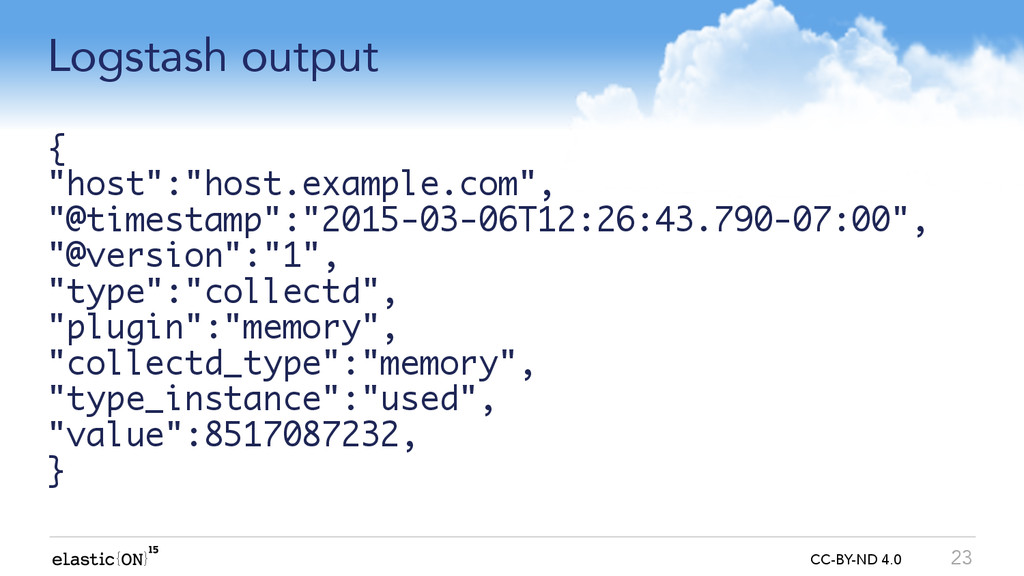
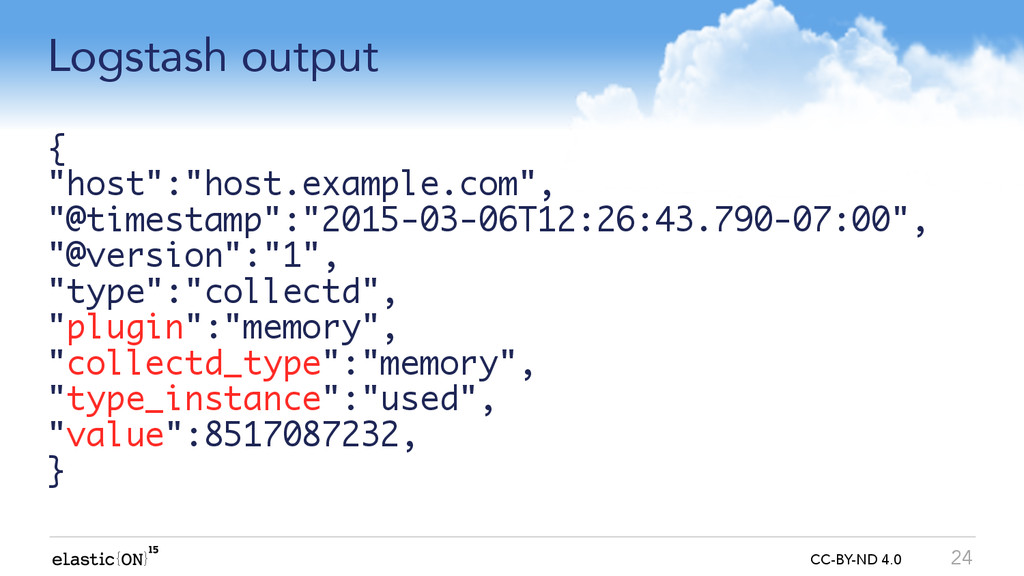
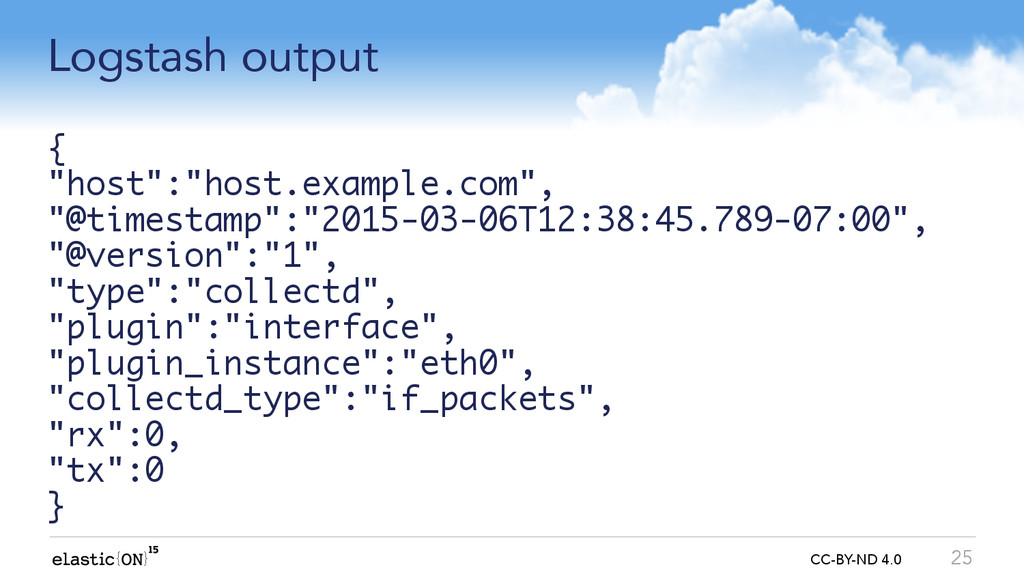
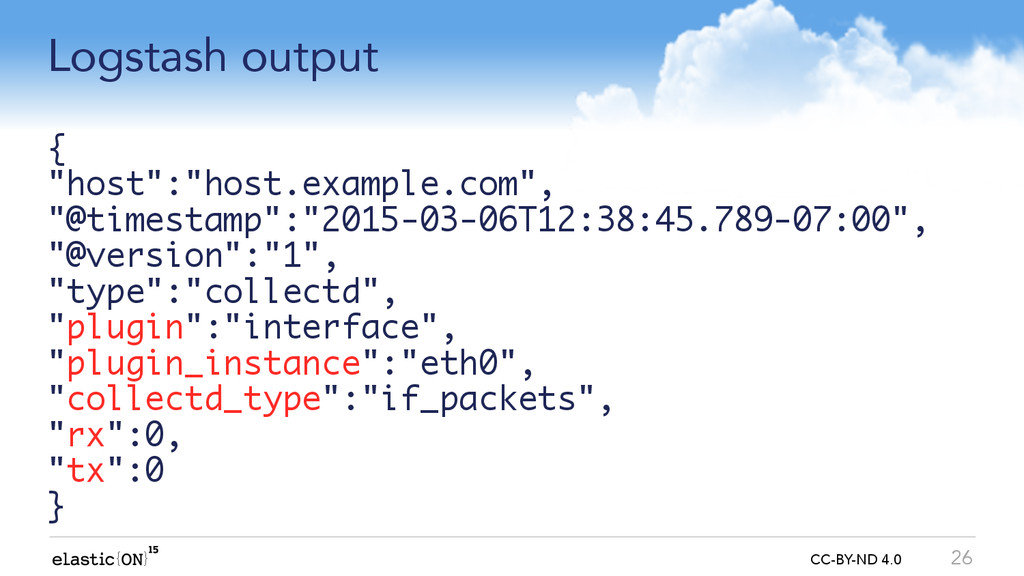
Logstash isn't just for logs! Did you know that Logstash can translate all kind of data into metrics you can use to monitor and track system performance?

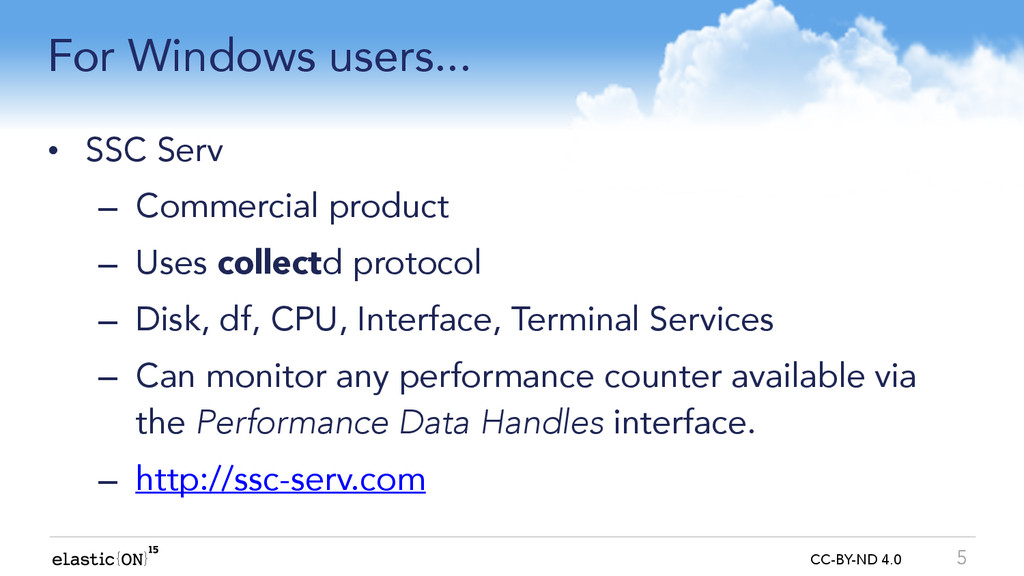
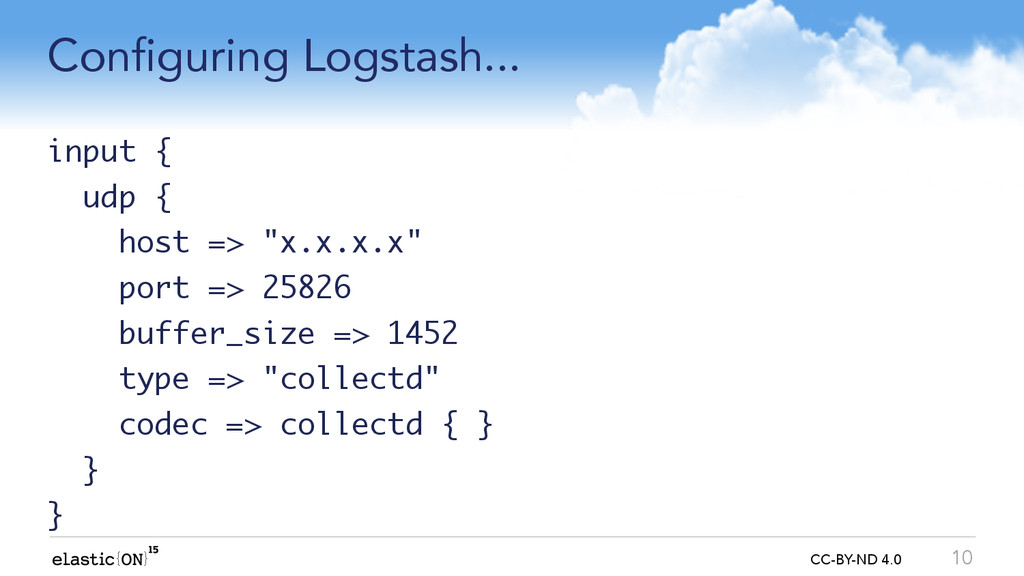
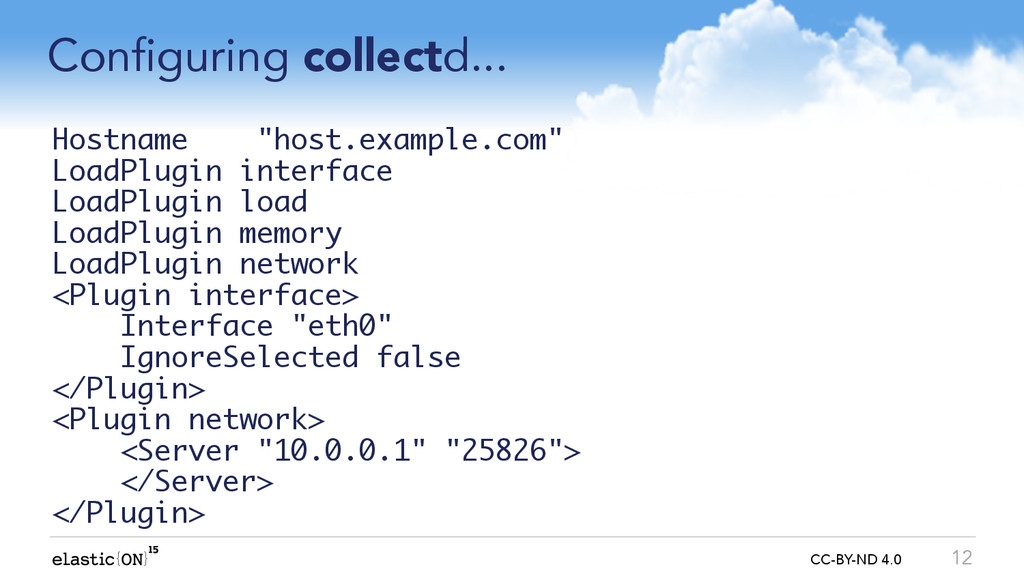
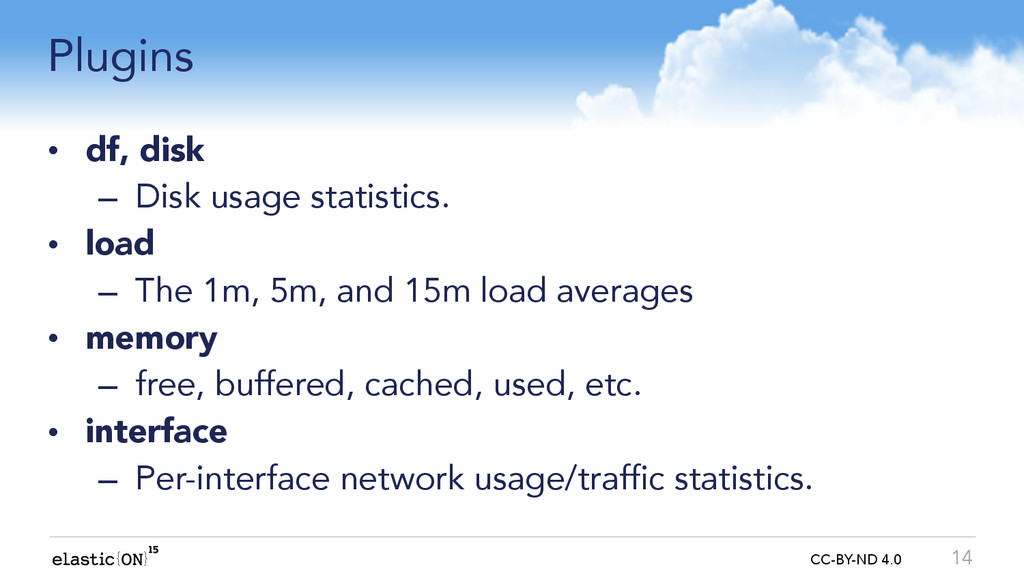
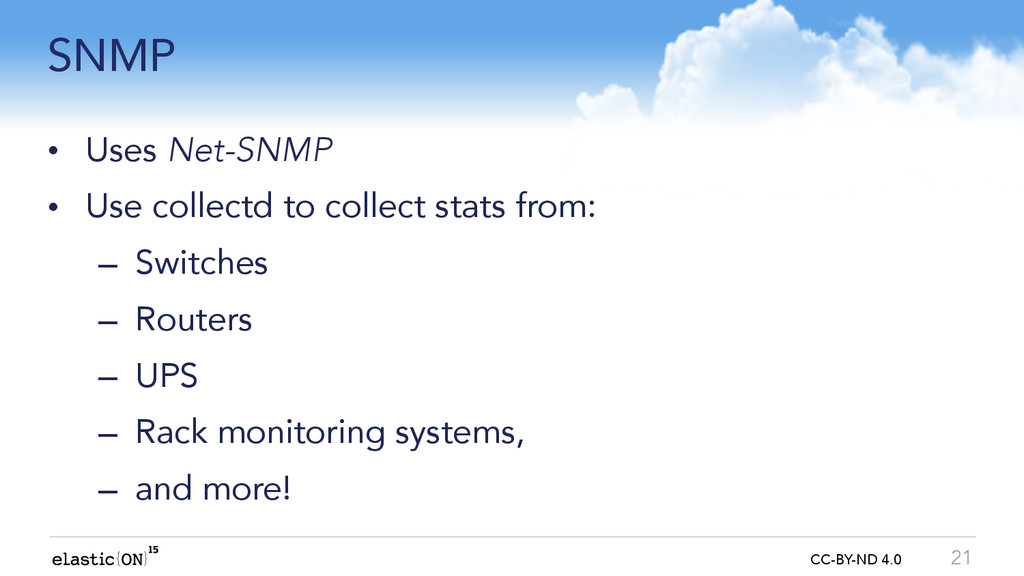
One of these plugins allows Logstash to collect data from collectd. collectd is a metric collecting and delivery program with dozens of plugins which range from Apache to ZFS, databases, hardware performance metrics and so much more.
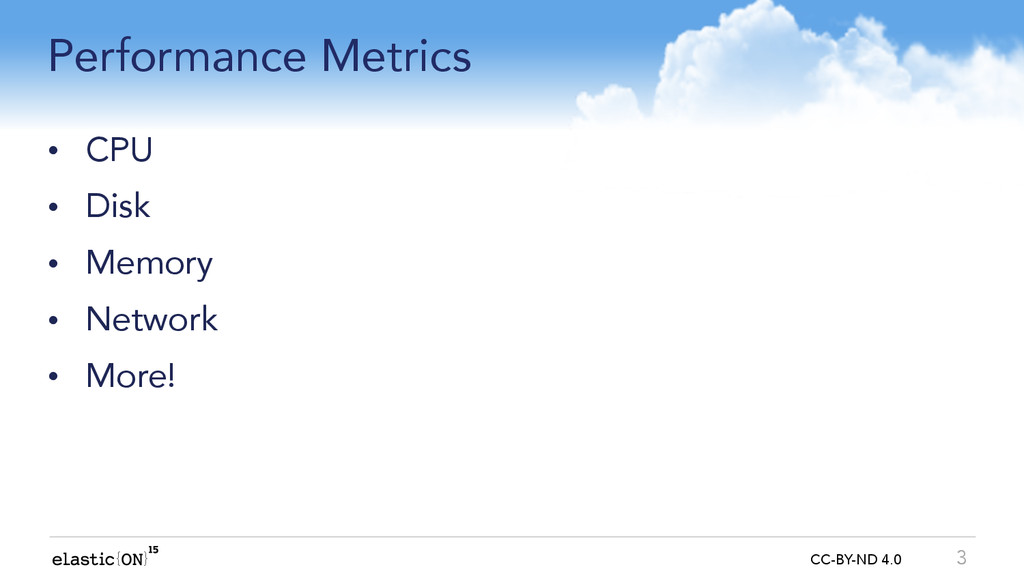
Learn how Logstash can help you start to keep track of your performance metric data!

Elastic Co

March 11, 2015
Tweet

More Decks by Elastic Co

Other Decks in Technology

Transcript

  1. { } CC-BY-ND 4.0 Why would I want to do

    performance monitoring with ELK? 2
  2. { } CC-BY-ND 4.0 Performance Metrics • CPU • Disk

    • Memory • Network • More! 3
  3. { } CC-BY-ND 4.0 For Windows users... • SSC Serv

    – Commercial product – Uses collectd protocol – Disk, df, CPU, Interface, Terminal Services – Can monitor any performance counter available via the Performance Data Handles interface. – http://ssc-serv.com 5
  4. { } CC-BY-ND 4.0 Configuring Logstash... input { udp {

    host => "x.x.x.x" port => 25826 buffer_size => 1452 type => "collectd" codec => collectd { } } } 10
  5. { } CC-BY-ND 4.0 Configuring Logstash... • Authentication & Security

    • NaN handling • Interval pruning • typesdb 11
  6. { } CC-BY-ND 4.0 Configuring collectd... Hostname "host.example.com" LoadPlugin interface

    LoadPlugin load LoadPlugin memory LoadPlugin network <Plugin interface> Interface "eth0" IgnoreSelected false </Plugin> <Plugin network> <Server "10.0.0.1" "25826"> </Server> </Plugin> 12
  7. { } CC-BY-ND 4.0 Plugins • df, disk – Disk

    usage statistics. • load – The 1m, 5m, and 15m load averages • memory – free, buffered, cached, used, etc. • interface – Per-interface network usage/traffic statistics. 14
  8. { } CC-BY-ND 4.0 Plugins • ConnTrack – Tracks the

    number of entries in Linux's connection tracking table. • ContextSwitch – Collects the number of context switches done by the operating system. 15
  9. { } CC-BY-ND 4.0 Plugins • DBI/PostgreSQL/Oracle – Returns values

    from queries. • Entropy – Collects the available entropy on a system 16
  10. { } CC-BY-ND 4.0 Plugins • memcached – Collects the

    number of connections and requests handled by the daemon, the CPU resources consumed, number of items cached, number of threads, and bytes sent and received. • MySQL – Connects to a MySQL db, issues a SHOW STATUS command, and returns many of the variables. 17
  11. { } CC-BY-ND 4.0 Plugins • Swap – Collects the

    amount of memory currently written onto hard disk (or whatever the system calls “swap”) • TCPConns – Counts the number of TCP connections to or from a specified port. Results include each state: LISTEN, ESTABLISHED, CLOSE_WAIT, etc. 18
  12. { } CC-BY-ND 4.0 BIND (9.5.0+) Global statistics ▪ OpCodes

    ▪ Query types (A, MX, AAAA, …) ▪ Overall server statistics (#Queries, #Responses, …) ▪ Zone maintenance statistics (#Notifications, #Updates, …) ▪ Resolver statistics (usually empty) ▪ Memory statistics Per-view statistics ▪ Query types ▪ Resolver statistics (#Queries, #Responses, #NXDOMAIN, …) ▪ RR-set cache statistics (#entries by type) Per-zone statistics ▪ Overall statistics (Success, #NXRRSET, …) 19
  13. { } CC-BY-ND 4.0 IP Tables • Per-rule byte and

    packet counters, selected by: – Position (e.g. “the fourth rule in the ‘INPUT’ queue in the ‘filter’ table”) – Comment (using the “COMMENT” match). • Low overhead – Uses libiptc. Communicates with the kernel directly. 20
  14. { } CC-BY-ND 4.0 SNMP • Uses Net-SNMP • Use

    collectd to collect stats from: – Switches – Routers – UPS – Rack monitoring systems, – and more! 21
  15. { } CC-BY-ND 4.0 Custom Plugins & Extensions • C

    • Perl • Python • Exec • Unix-sockets • Java • Java MBean support, via jcollectd 22
  16. { } CC-BY-ND 4.0 Logstash output { "host":"host.example.com", "@timestamp":"2015-03-06T12:26:43.790-07:00", "@version":"1",

    "type":"collectd", "plugin":"memory", "collectd_type":"memory", "type_instance":"used", "value":8517087232, } 23
  17. { } CC-BY-ND 4.0 Logstash output { "host":"host.example.com", "@timestamp":"2015-03-06T12:26:43.790-07:00", "@version":"1",

    "type":"collectd", "plugin":"memory", "collectd_type":"memory", "type_instance":"used", "value":8517087232, } 24
  18. { } CC-BY-ND 4.0 Logstash output { "host":"host.example.com", "@timestamp":"2015-03-06T12:38:45.789-07:00", "@version":"1",

    "type":"collectd", "plugin":"interface", "plugin_instance":"eth0", "collectd_type":"if_packets", "rx":0, "tx":0 } 25
  19. { } CC-BY-ND 4.0 Logstash output { "host":"host.example.com", "@timestamp":"2015-03-06T12:38:45.789-07:00", "@version":"1",

    "type":"collectd", "plugin":"interface", "plugin_instance":"eth0", "collectd_type":"if_packets", "rx":0, "tx":0 } 26
  20. CC-BY-ND 4.0 CC-BY-ND 4.0 Why ? • No point in

    having the data unless you can act on it. • Dashboards are great for an overview but don’ t allow you to get notified when things go wrong. • The time something happens is as important as what happens.
  21. CC-BY-ND 4.0 CC-BY-ND 4.0 Alerting vs Percolator ? Percolator is

    fantastic at what it does but it has some limitations • Only processes a single event at a time. • No access to aggregations. • No history of what was percolated and what matched.
  22. CC-BY-ND 4.0 CC-BY-ND 4.0 Anatomy of an Alert An alert

    is defined by four key elements • Schedule • Input • Condition • Actions
  23. CC-BY-ND 4.0 CC-BY-ND 4.0 Schedule The schedule defines when and

    how often an alert should run. • Every 5 mins (check the load on my production web server) • Every hour (count how many errors my database logs contain) • On the last day of the month (run a check to see if my traffic has gone up from last month)
  24. CC-BY-ND 4.0 CC-BY-ND 4.0 Cron Alert schedules can be defined

    by a cron syntax. • Great for people who know cron. • Terrible for people who don’t.
  25. CC-BY-ND 4.0 CC-BY-ND 4.0 Cron Cron syntax is very powerful

    but hard (at least for me). 0 0,12 1 */2 * Run every 12am and 12pm on the 1st day of every 2nd month. * 12 16 * Mon Run every minute during the 12th hour of Monday, 16th, but only if the day is the 16th of the month.
  26. CC-BY-ND 4.0 CC-BY-ND 4.0 Simpler We will support a simplified

    syntax for defining schedules. "hourly" : { "minute" : 30 } Run every hour on the 30th minute. "daily" : { "at" : [ "midnight", "noon", "17:00" ] } Run at 00:00, 12:00 and 17:00 every day. "interval" : "5m" Run every 5 minutes.
  27. CC-BY-ND 4.0 CC-BY-ND 4.0 Input The input generates or loads

    the data that will be used by a running alert • Run an aggregation on my collectd index to get my load average over the last 5 minutes. • Count how many errors my log index had for my database server. • Run a date histogram aggregation to get my web traffic for the last two months.
  28. CC-BY-ND 4.0 CC-BY-ND 4.0 Input Inputs can be (for now)

    elasticsearch searches or static data. Searches give you full access to the elasticsearch query dsl and can span multiple indices. Searches can be templated with access to two special variables 1. The time the alert ran. 2. The time the alert was scheduled to run.
  29. CC-BY-ND 4.0 CC-BY-ND 4.0 Input "query" : { "filtered": {

    "query": { "match": { "response": 404 } }, "filter": { "range": { "@timestamp" : { "from": "{{ctx.scheduled_fire_time}}||-5m", "to": "{{ctx.scheduled_fire_time}}" } } } } }
  30. CC-BY-ND 4.0 CC-BY-ND 4.0 Condition The condition decides whether the

    alert actions should be executed • Is the load result from the input over a threshold. • Does the count from the input mean that I need to be paged? • Is the trend in a date histogram unexpected ?
  31. CC-BY-ND 4.0 CC-BY-ND 4.0 Condition Conditions can be evaluated using

    scripts. "script" : "return ctx.payload.total_hits > 5" "script" : "ok_count = 0.0;error_count = 0.0;for(bucket in ctx.payload. aggregations.response.buckets) {if (bucket.key < 400){ok_count += bucket. doc_count;} else {error_count += bucket. doc_count;}}; return error_count/ (ok_count+1) >= 0.1;"
  32. CC-BY-ND 4.0 CC-BY-ND 4.0 Condition Even simpler if you use

    on disk on indexed scripts. • "script" : "hit_checker" "type" : "indexed" "params" : { "threshold" : 5 }
  33. CC-BY-ND 4.0 CC-BY-ND 4.0 Actions The actions take the result

    of the alert and deliver it to external and internal systems. • Email the sysadmin to let him know that load on the cluster is too high. • Generate a pagerduty API call to all database administrators. • Index the result of the alert.
  34. CC-BY-ND 4.0 CC-BY-ND 4.0 Actions The email and webhook actions

    support templating. "email" : { "to" : "[email protected]", "subject" : "{{alert_name}} has triggered with {{ctx.payload.hits.total}} results", "body" : "The {{alert_name}} found errors on {{#ctx.payload.aggregations.names}} {{name}}, {{/ctx.payload.aggregations.name}} servers. " }
  35. CC-BY-ND 4.0 CC-BY-ND 4.0 Actions The email and webhook actions

    support templating. "webhook" : { "method" : "POST", "url" : "http://host.domain/third-party- system/{{alert_name}}", "body" : "Encountered {ctx.payload.hits. total}} errors" }
  36. CC-BY-ND 4.0 CC-BY-ND 4.0 Alerts and elasticsearch Alerts are indexed

    elasticsearch documents. Every time an alert runs an elasticsearch `alert_history` document is generated in a time based index. This document contains all the information from the alert run along with whether or not the condition matched and the status of the actions.
  37. CC-BY-ND 4.0 CC-BY-ND 4.0 Alerts and elasticsearch Since alerts and

    alert runs are indexed documents in elasticsearch you can generate kibana dashboards of your alerts and run alerts on alerts. • Run an alert every day and check the number of triggered alerts that failed to execute their actions • Run an alert every day that checks that the expected number of alerts ran. • Run an alert that checks if the one node is triggering alerts more than others.
  38. CC-BY-ND 4.0 CC-BY-ND 4.0 When ? Soon. There will be

    a beta, if you are interested please let our product team know.