Upgrade to Pro — share decks privately, control downloads, hide ads and more …

Joint models for survival and longitudinal data when the observation process is informative

Joint models for survival and longitudinal data when the observation process is informative

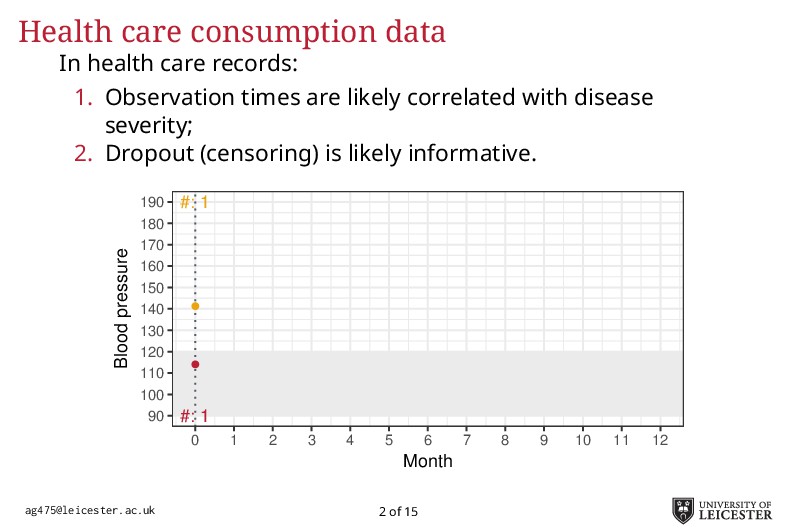
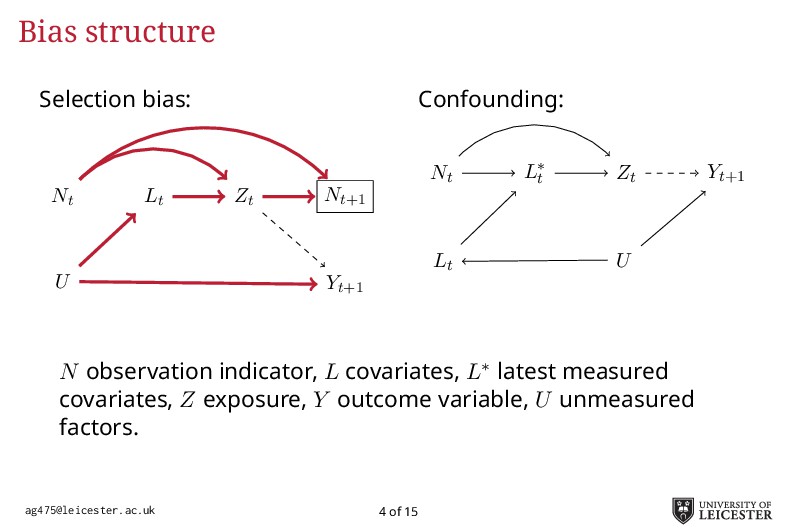
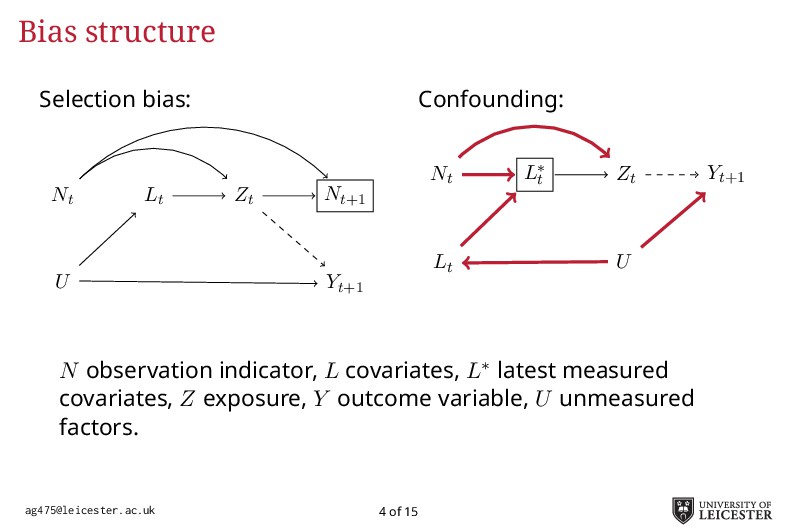
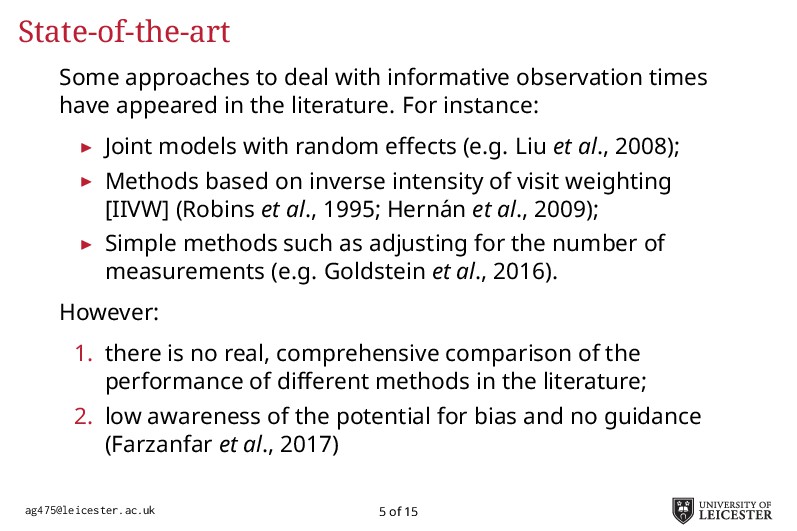
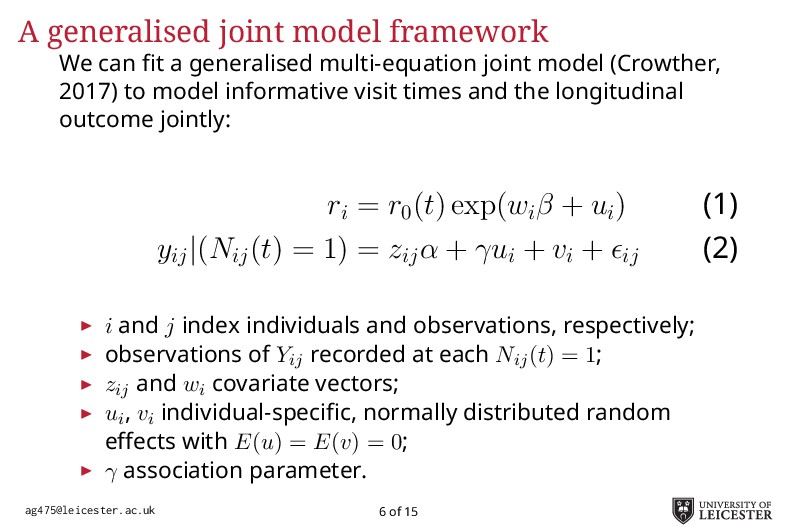
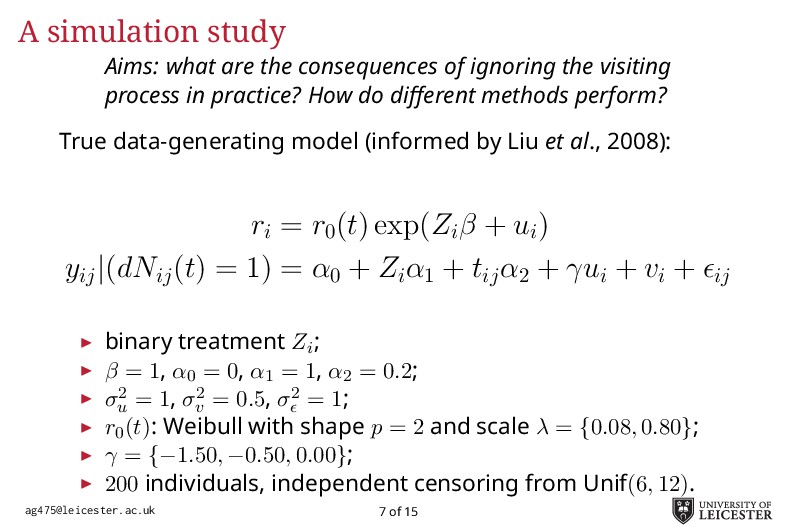
Electronic health records are being increasingly used in medical research to answer more relevant and detailed clinical questions; however, they pose new and significant methodological challenges. For instance, observation times are likely correlated with the underlying disease severity: patients with worse conditions utilise healthcare more and have worse biomarkers recorded. Additionally, a terminal event truncating observation of the longitudinal process is deemed informative when it correlates with disease severity. Traditional methods for analysing longitudinal data assume independence between observation times and disease severity; yet, with healthcare data such assumption unlikely holds leading to biased model estimates. Joint models for longitudinal and survival data can account for informative dropout processes, but research is scarce on whether inference is valid when the observation process is informative. Through extensive simulation studies, we compare different analytical approaches proposed to account for an informative visiting process. We cover both simple (including the number of measurements as a covariate) and complex methods (e.g. trivariate joint models for the longitudinal, survival, and visiting processes; Liu, 2008). We conclude by summarising which methods lead to valid inference, and under which settings, and describe how to fit the more complex models within an extended joint modelling framework (Crowther, 2017).

Alessandro Gasparini

April 25, 2018
Tweet

Other Decks in Research

Transcript

  1. Joint models for survival and longitudinal data when the observation

    process is informative Alessandro Gasparini1 Keith R Abrams1 Jessica K Barrett2,3 Michael J Sweeting1,2 Michael J Crowther1 1Department of Health Sciences, University of Leicester, Leicester, United Kingdom 2Cardiovascular Epidemiology Unit, University of Cambridge, Cambridge, United Kingdom 3MRC Biostatistics Unit, Cambridge, United Kingdom 7th Survival Analysis for Junior Researchers Conference Leiden, 24th-26th April 2018
  2. Background Health care consumption data is being increasingly used in

    medical research: Answering new, more relevant and detailed clinical questions, but... New and significant methodological challenges: 1. Informative censoring; 2. Informative observation process; 3. Reporting (REPORT guidelines, Benchimol et al., 2015); 4. ... [email protected] 1 of 15
  3. Health care consumption data In health care records: 1. Observation

    times are likely correlated with disease severity; 2. Dropout (censoring) is likely informative. 90 100 110 120 130 140 150 160 170 180 190 0 1 2 3 4 5 6 7 8 9 10 11 12 Month Blood pressure [email protected] 2 of 15
  4. Health care consumption data In health care records: 1. Observation

    times are likely correlated with disease severity; 2. Dropout (censoring) is likely informative. [email protected] 2 of 15 #: 1 #: 1 90 100 110 120 130 140 150 160 170 180 190 0 1 2 3 4 5 6 7 8 9 10 11 12 Month Blood pressure
  5. Informative observation process Common assumption with traditional methods for analysing

    longitudinal data: The mechanism that controls the observation time is independent of disease severity Joint models for longitudinal-survival data can account for an informative censoring process; Research is scarce on whether inference is valid when the observation process is informative. If the observation plan is dynamic, we must account for it in the analysis. Otherwise, two types of bias can arise: selection bias and confounding. [email protected] 3 of 15
  6. Bias structure Selection bias: Nt Lt Zt Nt+1 Yt+1 U

    Confounding: Nt L∗ t Zt Yt+1 Lt U N observation indicator, L covariates, L∗ latest measured covariates, Z exposure, Y outcome variable, U unmeasured factors. [email protected] 4 of 15
  7. Bias structure Selection bias: Nt Lt Zt Nt+1 Yt+1 U

    Confounding: Nt L∗ t Zt Yt+1 Lt U N observation indicator, L covariates, L∗ latest measured covariates, Z exposure, Y outcome variable, U unmeasured factors. [email protected] 4 of 15
  8. Bias structure Selection bias: Nt Lt Zt Nt+1 Yt+1 U

    Confounding: Nt L∗ t Zt Yt+1 Lt U N observation indicator, L covariates, L∗ latest measured covariates, Z exposure, Y outcome variable, U unmeasured factors. [email protected] 4 of 15
  9. Bias structure Selection bias: Nt Lt Zt Nt+1 Yt+1 U

    Confounding: Nt L∗ t Zt Yt+1 Lt U N observation indicator, L covariates, L∗ latest measured covariates, Z exposure, Y outcome variable, U unmeasured factors. [email protected] 4 of 15
  10. Bias structure Selection bias: Nt Lt Zt Nt+1 Yt+1 U

    Confounding: Nt L∗ t Zt Yt+1 Lt U N observation indicator, L covariates, L∗ latest measured covariates, Z exposure, Y outcome variable, U unmeasured factors. [email protected] 4 of 15
  11. State-of-the-art Some approaches to deal with informative observation times have

    appeared in the literature. For instance: Joint models with random effects (e.g. Liu et al., 2008); Methods based on inverse intensity of visit weighting [IIVW] (Robins et al., 1995; Hern´ an et al., 2009); Simple methods such as adjusting for the number of measurements (e.g. Goldstein et al., 2016). However: 1. there is no real, comprehensive comparison of the performance of different methods in the literature; 2. low awareness of the potential for bias and no guidance (Farzanfar et al., 2017) [email protected] 5 of 15
  12. A generalised joint model framework We can fit a generalised

    multi-equation joint model (Crowther, 2017) to model informative visit times and the longitudinal outcome jointly: ri = r0 (t) exp(wi β + ui ) (1) yij |(Nij (t) = 1) = zij α + γui + vi + ij (2) i and j index individuals and observations, respectively; observations of Yij recorded at each Nij(t) = 1; zij and wi covariate vectors; ui , vi individual-specific, normally distributed random effects with E(u) = E(v) = 0; γ association parameter. [email protected] 6 of 15
  13. A simulation study Aims: what are the consequences of ignoring

    the visiting process in practice? How do di erent methods perform? True data-generating model (informed by Liu et al., 2008): ri = r0 (t) exp(Zi β + ui ) yij |(dNij (t) = 1) = α0 + Zi α1 + tij α2 + γui + vi + ij binary treatment Zi ; β = 1, α0 = 0, α1 = 1, α2 = 0.2; σ2 u = 1, σ2 v = 0.5, σ2 = 1; r0(t): Weibull with shape p = 2 and scale λ = {0.08, 0.80}; γ = {−1.50, −0.50, 0.00}; 200 individuals, independent censoring from Unif(6, 12). [email protected] 7 of 15
  14. Models included in our comparison 1. True model; 2. A

    mixed effects model, adjusting for the total number of measurements; 3. A mixed effects model, adjusting for the cumulative number of measurements up to the current time (as a time-varying covariate); 4. A mixed effects model disregarding the observation process; 5. A model fit using generalised estimating equations [GEE] and IIVW (Van Ness et al., 2009). [email protected] 8 of 15
  15. Results: informative observation process γ = −1.50 γ = −0.50

    γ = 0.00 0 20 40 60 0 20 40 60 0 20 40 60 0.000 0.050 0.100 0.150 0.200 0.250 Number of observations per individual Density λ : 0.08 0.80 Treatment Not treated Treated γ = −1.50 γ = −0.50 γ = 0.00 0.0 2.5 5.0 7.5 10.0 0.0 2.5 5.0 7.5 10.0 0.0 2.5 5.0 7.5 10.0 0.000 0.400 0.800 1.200 Gap time between observations Density [email protected] 9 of 15
  16. Results: bias of treatment e ect 0.000 0.250 0.500 0.750

    1.000 True ME (Total) ME (Cumul.) ME (No adj.) GEE (IIVW) Model Bias of α1 λ : 0.08 0.80 γ : −1.50 −0.50 0.00 True value of α1 : 1 [email protected] 10 of 15
  17. Results: bias of xed intercept −0.600 −0.400 −0.200 0.000 True

    ME (Total) ME (Cumul.) ME (No adj.) GEE (IIVW) Model Bias of α0 λ : 0.08 0.80 γ : −1.50 −0.50 0.00 True value of α0 : 0 [email protected] 11 of 15
  18. Results: bias of time e ect −0.050 −0.025 0.000 0.025

    True ME (Total) ME (Cumul.) ME (No adj.) GEE (IIVW) Model Bias of α2 γ : −1.50 −0.50 0.00 λ : 0.08 0.80 True value of α2 : 0.2 [email protected] 12 of 15
  19. Results: bias of variance of random intercept 0.000 0.500 1.000

    1.500 2.000 True ME (Total) ME (Cumul.) ME (No adj.) GEE (IIVW) Model Bias of V(v) λ : 0.08 0.80 γ : −1.50 −0.50 0.00 True value of V(v): 0.5 [email protected] 13 of 15
  20. Conclusions Take-home messages: 1. Failing to account for a dynamic

    visiting process yields biased results because of selection bias or confounding; 2. There is a variety of methods that can be utilised to account for an informative visiting process, but they are severely underutilised. Extension of current work: Application to a variety of real data examples; Exploring more complex model structures (time-dependent frailties, ...); Formalising the joint model in a causal inference framework; Additional methods such as multiple outputation (Pullenayegum, 2016). [email protected] 14 of 15
  21. References EI Benchimol, L Smeeth, A Guttmann, K Harron, D

    Moher, I Petersen, HT Sørensen, E von Elm, SM Langan, RECORD Working Committee (2015). The REporting of studies Conducted using Observational Routinely-collected health Data (RECORD) statement. PLoS medicine 12(10):e1001885 L Liu, X Huang, J O’Quigley (2008). Analysis of longitudinal data in presence of informative observational times and a dependent terminal event, with application to medical cost data. Biometrics 64:950-958 JM Robins, A Rotnitzky, LP Zhao (1995). Analysis of semiparametric regression models for repeated outcomes in the presence of missing data. Journal of the American Statistical Association 90(429):106-121 MA Hern´ an, M McAdams, N McGrath, E Lanoy, D Costagliola (2009). Observation plans in longitudinal studies with time-varying treatments. Statistical Methods in Medical Research 18(1):27-52 BA Goldstein, NA Bhavsar, M Phelan, MJ Pencina (2016). Controlling for informed presence bias due to the number of health encounters in an electronic health record. American Journal of Epidemiology 184(11):847-855 D Farzanfar, A Abumuamar, J Kim, E Sirotich, Y Wang, EM Pullenayegum (2017). Longitudinal studies that use data collected as part of usual care risk reporting biased results: a systematic review. BMC Medical Research Methodology 17(1):133 MJ Crowther (2017). Extended multivariate generalised linear and non-linear mixed e ects models. arXiv preprint arXiv:1710.02223, https://arxiv.org/abs/1710.02223 PH Van Ness, HG Allore, TR Fried, H Lin (2009). Inverse intensity weighting in generalized linear models as an option for analyzing longitudinal data with triggered observations. American Journal of Epidemiology 171(1):105-112 Pullenayegum EM (2016). Multiple outputation for the analysis of longitudinal data subject to irregular observation. Statistics in Medicine 35(11):1800-1818 [email protected] 15 of 15