$30 off During Our Annual Pro Sale. View Details »

Can rainfall be a useful predictor of epidemic risk across temporal and spatial scales?

Can rainfall be a useful predictor of epidemic risk across temporal and spatial scales?

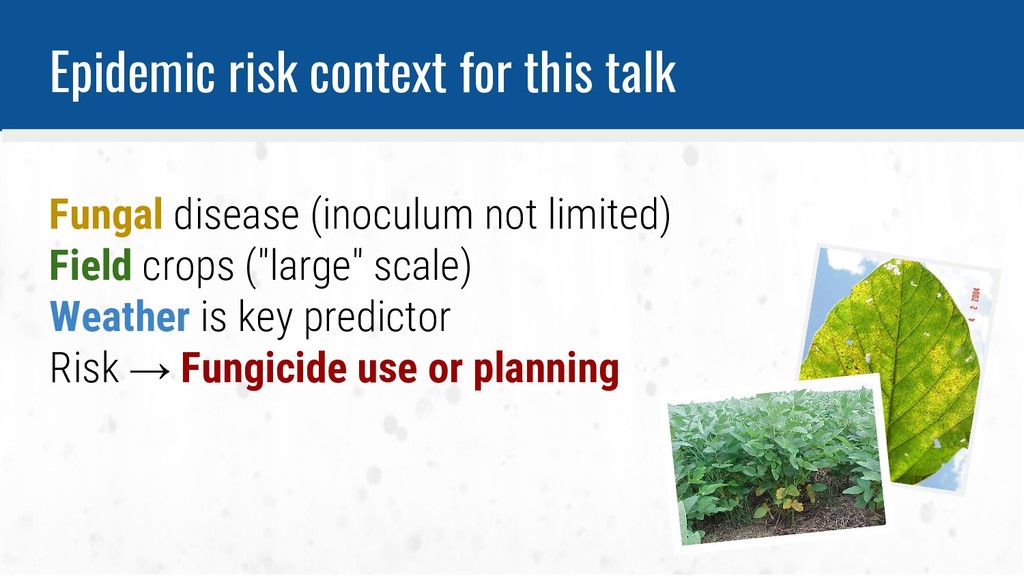
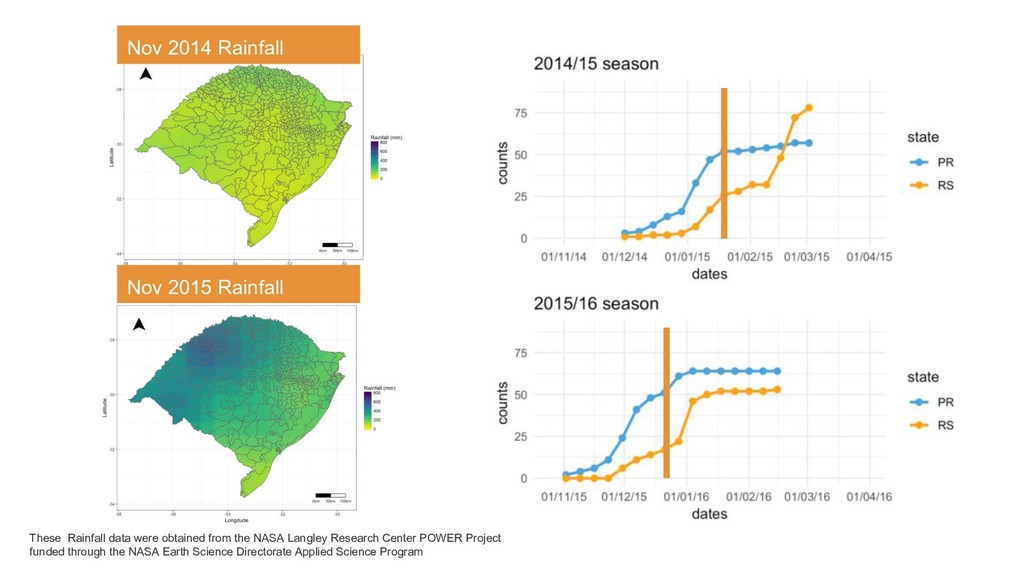
Plant disease epidemics are largely driven by within-season weather variables when inoculum is not limiting. Commonly, predictors in risk assessment models are based on the interaction of temperature and wetness-related variables, relationships which are determined experimentally. There is an increasing interest in providing within-season or inter-seasonal risk information at the region or continent scale, which commonly use models developed for a smaller scale. Hence, the scale matching dilemma that challenges epidemiologists and meteorologists: upscale models or downscale weather data? Successful applications may be found in both cases, which should be supported by validation datasets whenever possible, to prove the usefulness of the approach. For some diseases, rainfall is key for inoculum dispersal and, in warmer regions (e.g., tropics) where temperature is less limiting for epidemics, rainfall extends wetness periods. The drawbacks of using rainfall at small scales relate to its discrete nature and high spatial variability. However, for pre- or early-season predictions at large spatial scales sources of reasonably accurate rainfall summaries are available and may prove useful. The availability of disease datasets at various scales allows the development and evaluation of new models to be applied at the correct scale. We will showcase examples and discuss the usefulness of rainfall as key variable to predict soybean rust and wheat scab from field to region.

Emerson M. Del Ponte

July 31, 2018
Tweet

More Decks by Emerson M. Del Ponte

Other Decks in Science

Transcript

  1. Can rainfall be a useful
    predictor of epidemic risk across
    temporal and spatial scales?
    Emerson Del Ponte
    Discussions with: Adam Sparks, Nik Cunniffe, Larry Madden
    Collaboration: Kaique Alves, Gustavo Beruski

    View Slide

  2. Epidemic risk context for this talk
    Fungal disease (inoculum not limited)
    Field crops ("large" scale)
    Weather is key predictor
    Risk → Fungicide use or planning

    View Slide

  3. Agrios (2005)
    "Classical" disease (infection) risk model
    Relative humidity and T
    Dew
    Rainfall
    Leaf / Hour
    Field / Day
    LWD measured or estimated
    LWD

    View Slide

  4. Which wetness-variable?
    What is the model-building approach?
    Data-driven or Concept-driven?
    Biological or technical reasons
    Are Data available/accurate for the Scale?

    View Slide

  5. Several rainfall-based variables have
    been selected/used in disease risk models
    Together with other variables
    Rainfall duration in hours (continuous)
    Presence/absence (binary)
    Number of rain days (count)
    Daily total (continuous)
    Weekly total (continuous)
    Weekly rain events (count)
    Rain gauges
    Satellite
    Gridded data
    Model estimations

    View Slide

  6. Dispersal
    Infection
    Cloud cover
    wet deposition
    Survival
    (build-up)
    moisture
    splash
    moisture
    splash
    Effects of rainfall on epidemics?

    View Slide

  7. Soybean rust (SBR) in Brazil
    Data-driven model - natural field epidemics
    Only rainfall (30-day after detection) explained variation in final disease severity
    Del et (2006)

    View Slide

  8. SBR epidemics and rainfall
    Frequency and amount of rainfall during the epidemics

    View Slide

  9. Three Uses
    of the SBR Rainfall Model
    1) Risk analysis 2) Warning system 3) Early-season risk
    SEV = -2.14 + 0.18CR30
    + 1.28RD30
    Historical rain (day)
    Maximum Risk
    Region
    Real-time rain (day)
    More likely Risk
    Field
    Real time/forecast rain
    Likely Risk
    Large region
    Cumulative rain n. of Rain Days

    View Slide

  10. 1) Risk analysis
    Del Ponte et al (2011)
    How frequent severe epidemics?
    When during the season?
    Are they influenced by ENSO?

    View Slide

  11. 1) Risk analysis
    Risk of SEV > 70%
    1 in 3-4 years
    30 years daily rainfall (1979 to 2009)
    30 disease onset dates > Jan 1st
    24 locations

    View Slide

  12. ENSO effects
    Warm
    Warm = El Niño
    Cold = La Niña

    View Slide

  13. Time and space ENSO effects

    View Slide

  14. Was the model/result too wrong?
    Warm
    Warm
    Cold
    Cold
    Warm
    Cold

    View Slide

  15. Warning system
    Site-specific risk advisory system
    Daily severity values and action thresholds
    SEV15
    = -2.14 + 0.18CR15
    + 1.28RD15
    15A 15B
    DSV
    SEV15A x
    0.3 + SEV15B x
    0.7
    3-day mean
    daily severity value

    View Slide

  16. Rainfall warning system
    Site-specific risk advisory system
    DSV50 action threshold - more conservative
    DSV80 action threshold - less conservative

    View Slide

  17. Number of sprays
    (9 trials - 3 locations, Gustavo Beruski PhD Dissertation at Esalq)
    4.6
    4.0
    2.6
    4.8
    5.3

    View Slide

  18. Yield gains from using the systems
    (9 trials - 3 locations, Gustavo Beruski PhD Dissertation at Esalq)

    View Slide

  19. Is it worth not follow calendar?
    Fungicide efficacy (%)

    View Slide

  20. 3) Early Season Risk (regional)
    PR
    RS
    Database: first report of soybean rust in commercial fields of a municipality
    Source: Consórcio Antiferrugem

    View Slide

  21. 2014/15 2015/16

    View Slide

  22. 2014/15 2015/16

    View Slide

  23. Nov 2015 Rainfall
    These Rainfall data were obtained from the NASA Langley Research Center POWER Project
    funded through the NASA Earth Science Directorate Applied Science Program
    Nov 2014 Rainfall

    View Slide

  24. These Rainfall data were obtained from the NASA Langley Research Center POWER Project
    funded through the NASA Earth Science Directorate Applied Science Program
    Nov 2015 Rainfall
    Nov 2014 Rainfall

    View Slide

  25. These Rainfall data were obtained from the NASA Langley Research Center POWER Project
    funded through the NASA Earth Science Directorate Applied Science Program
    Nov 2016 Rainfall
    Nov 2017 Rainfall

    View Slide

  26. http://origin.cpc.ncep.noaa.gov/products/analysis_monitoring/ensostuff/ONI_v5.php
    What happened in 2015?
    El Niño!
    ENSO predictions for OND 2018

    View Slide

  27. Past 30-day observed rainfall
    7-day forecast rainfall
    Favorability risk maps

    View Slide

  28. So, can rain be useful?
    Yes! for some diseases and crop production
    situations, is a very important weather
    variable driving epidemics from field to
    regional scales
    Tha y !
    @edelponte

    View Slide