Upgrade to Pro — share decks privately, control downloads, hide ads and more …

The Reporting Engine Product Tour Presentation

The Reporting Engine Product Tour Presentation

The Most Powerful Online Call Center Reporting Software

Avatar for eMetrix Systems

eMetrix Systems

January 03, 2013
Tweet

Other Decks in Technology

Transcript

  1. INTRODUCTION Thank you for taking the time to view this

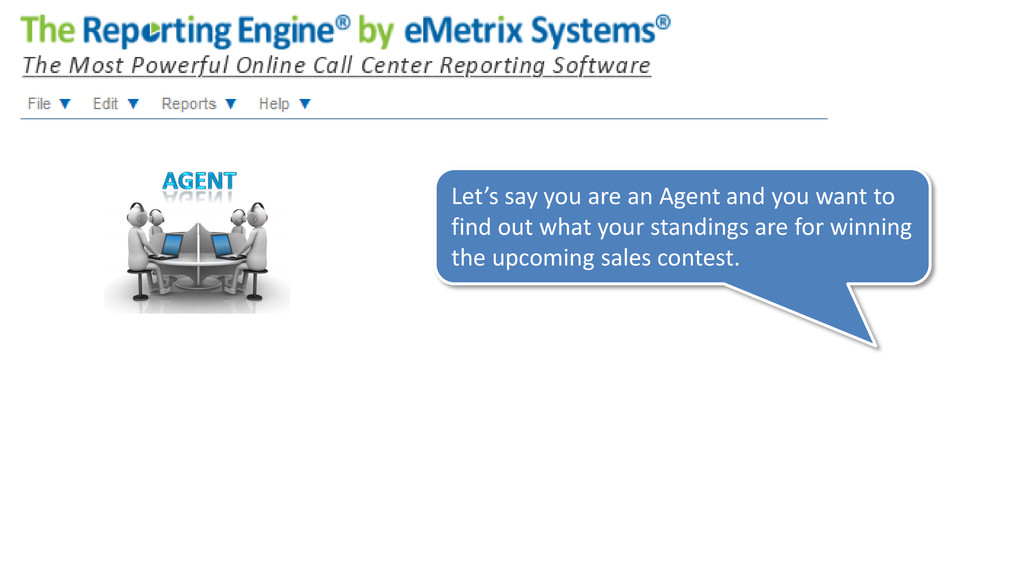
    presentation. We will demonstrate our product by “walking a mile in their shoes” Different points of view for different types of users. 20 years of call center management experience
  2. Let’s say you are a team leader and you need

    to prepare for a coaching session.
  3. Click on the selectors to filter the list to narrow

    down to your agents. Then click “Run”.
  4. Click on “+ Indicator” to add as many indicators as

    you need. Select from the numerous indicators.
  5. Voilà! The report is created. Default first level view is

    Yearly View… “see the forest before the trees”… (select any year)
  6. View agent results broken down by month. Drill down to

    view daily or weekly details by clicking on any month.
  7. 1 Go back to Monthly View and drill down to

    Weekly View and analyze the past 52 weeks from the month selected. 2
  8. Click on “+” next to Favorites and save this Weekly

    report for this Agent. This will save you from having to rebuild this report.
  9. 1 2 You can then retrace your original analysis by

    clicking “Back”. The Favorites remember everything.
  10. Let’s say you are a Business Analyst and you need

    to analyze which Product line has the best performance.
  11. Click on the selectors to filter the details of the

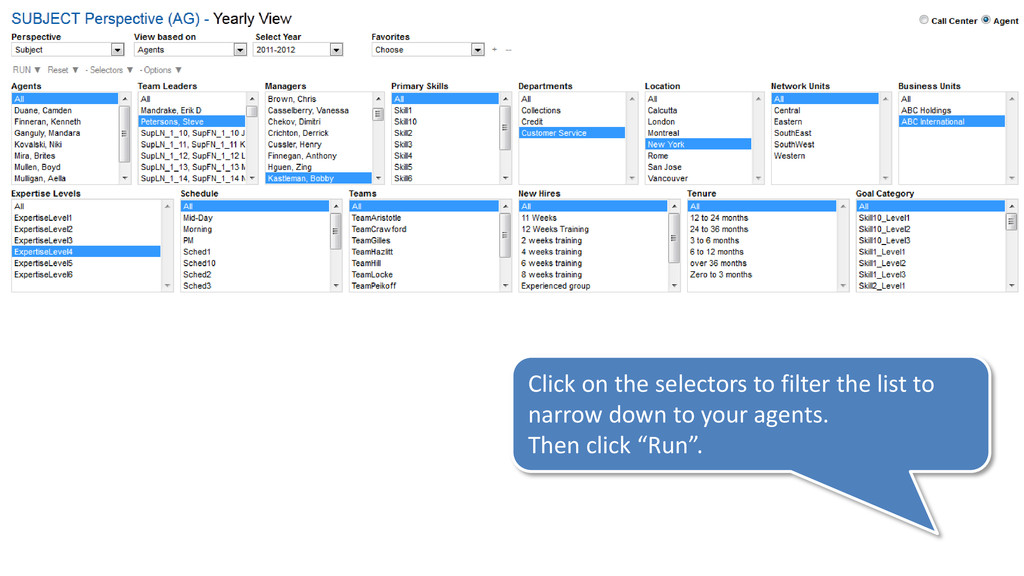
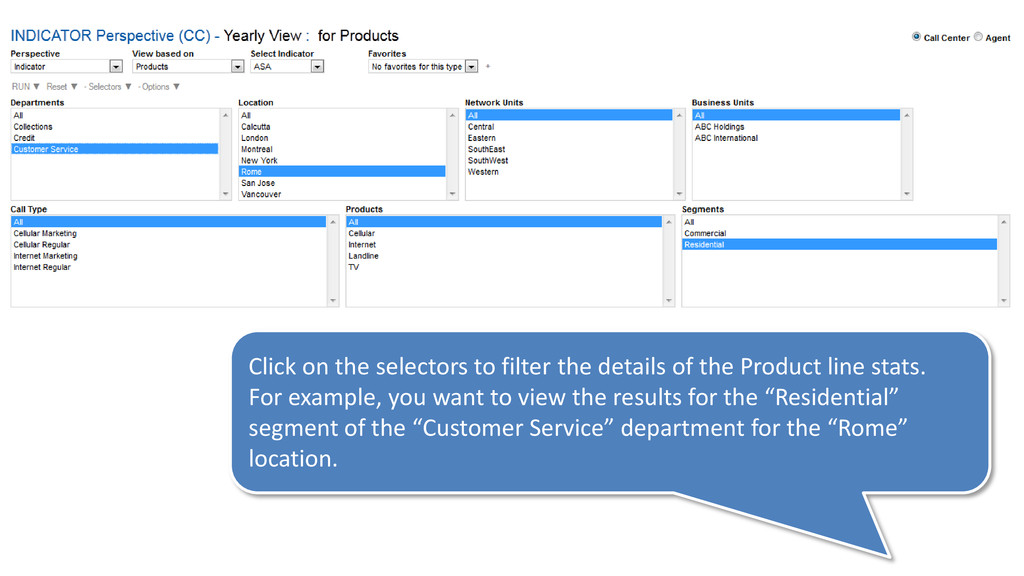
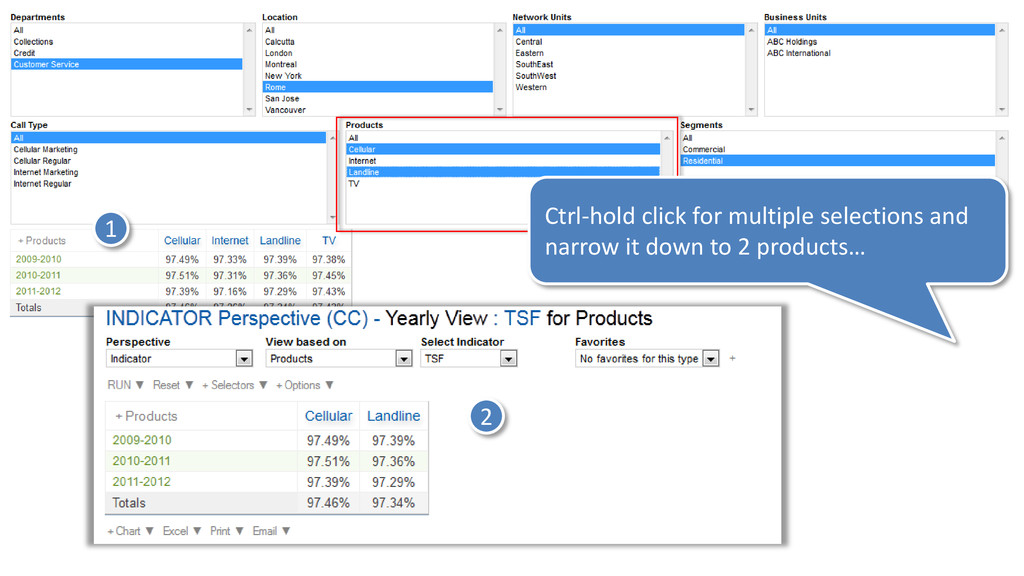
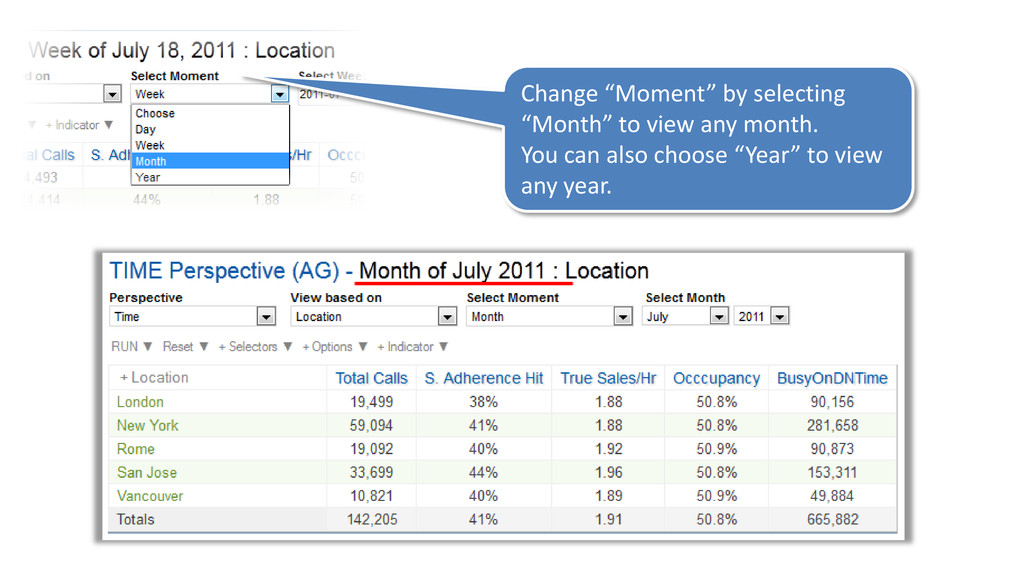
    Product line stats. For example, you want to view the results for the “Residential” segment of the “Customer Service” department for the “Rome” location.
  12. Voilà! The report is created. Default first level view is

    Yearly View… “see the forest before the trees”.
  13. One click and you can change the indicator and have

    a new report. You can analyze the next indicator and compare results.
  14. Click on “- Fiscal” and change to the calendar year

    display mode. Toggle back by clicking on “+ Fiscal”.
  15. 1 2 3 Drill down from Monthly View, to Daily

    View to Hourly View one click at a time. Easy as 1-2-3.
  16. 1 - Narrow down or expand your days. 2 -

    Narrow down the intervals. 1 2
  17. Another example as a Business Analyst : this time you

    want to analyze which New Hire training program works best.
  18. Narrow down your analysis by filtering data with the selectors.

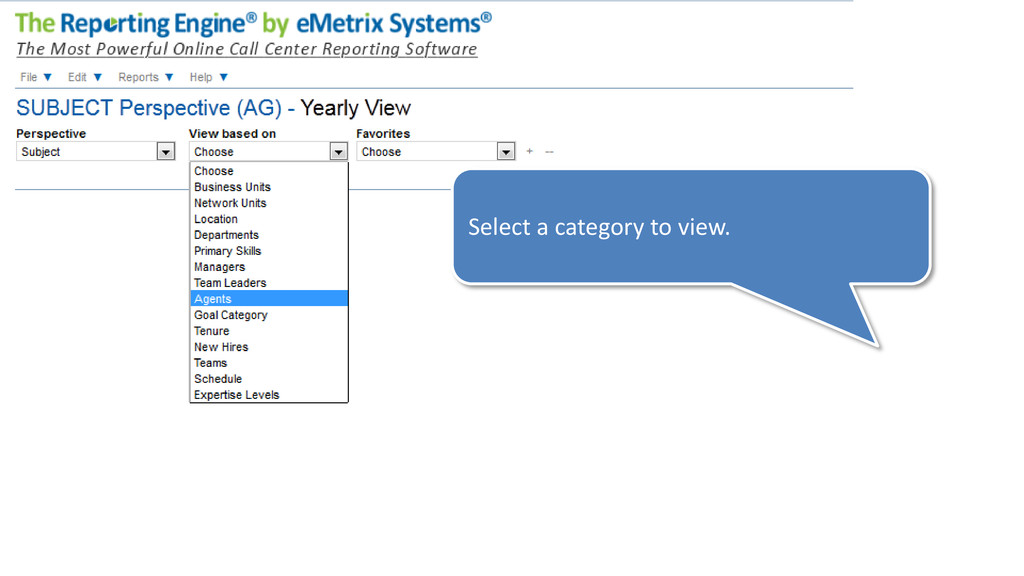
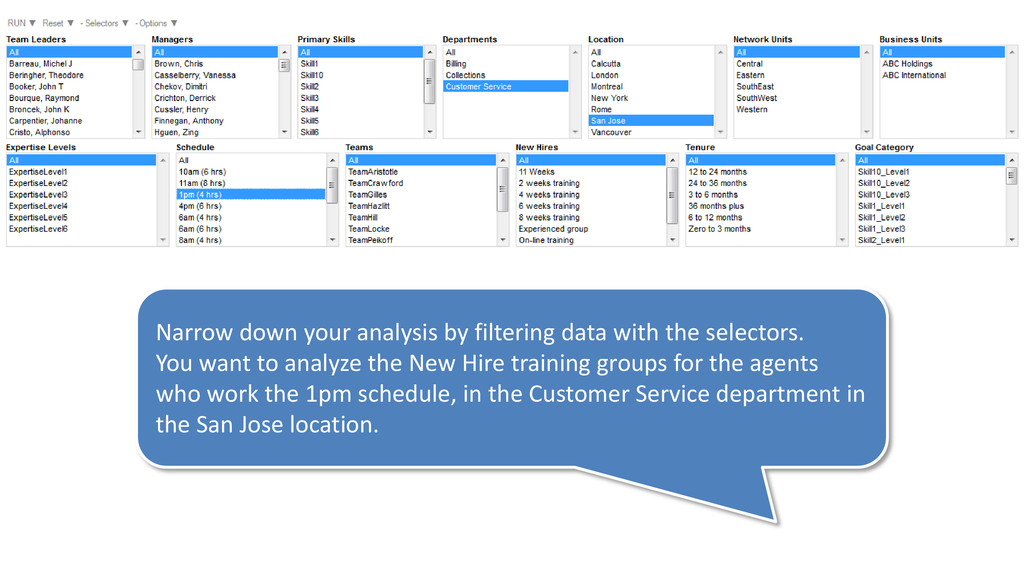
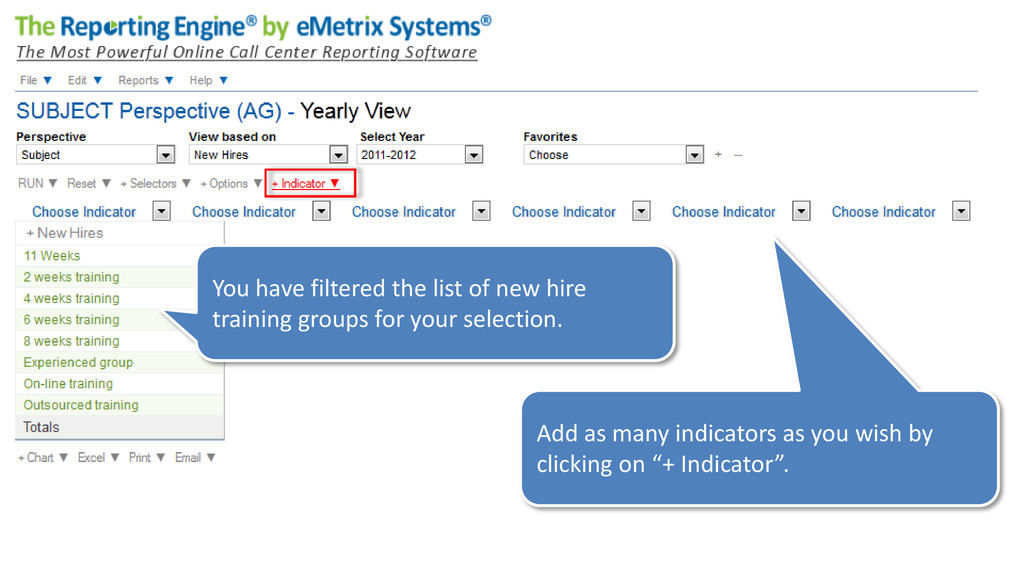
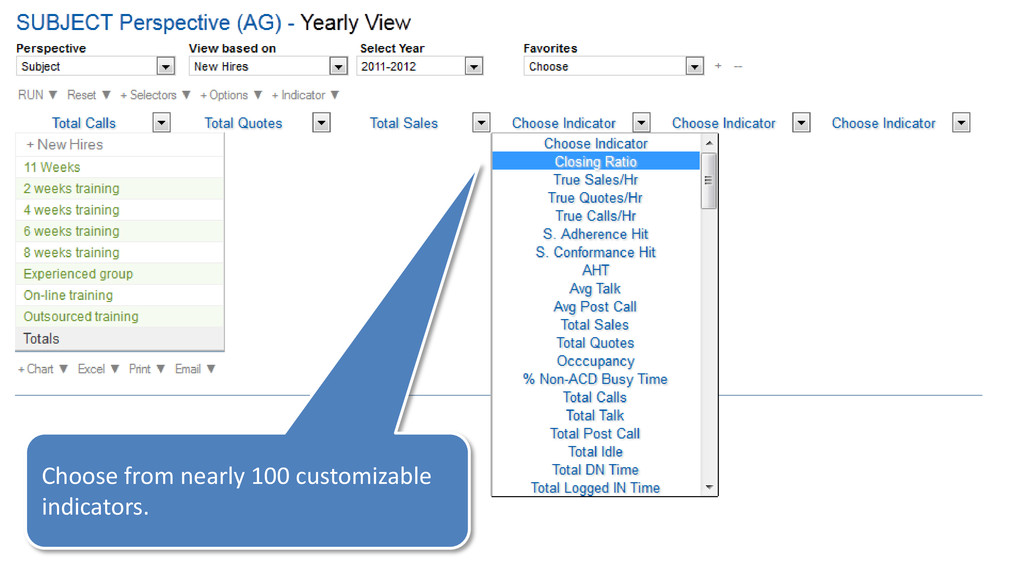
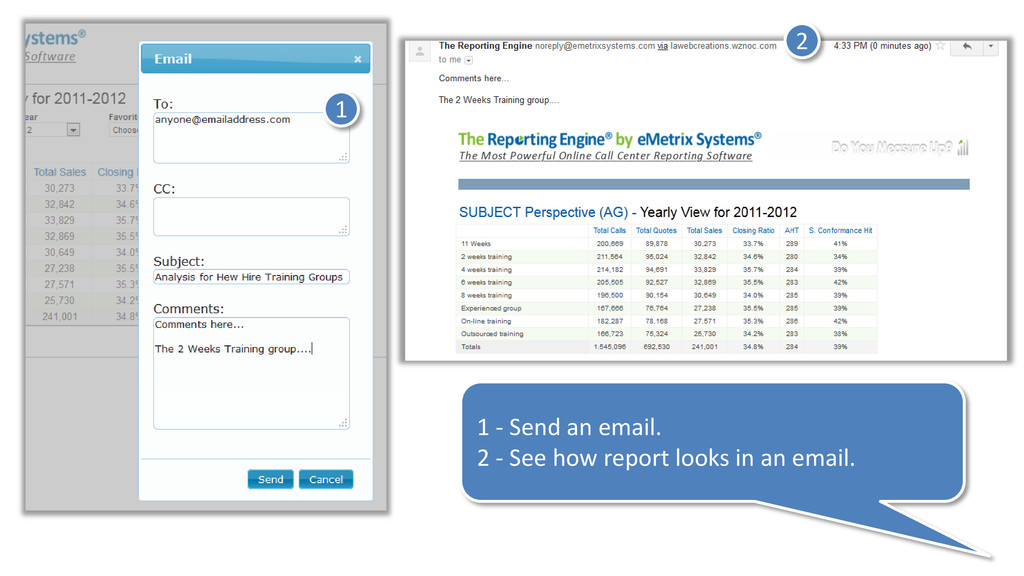
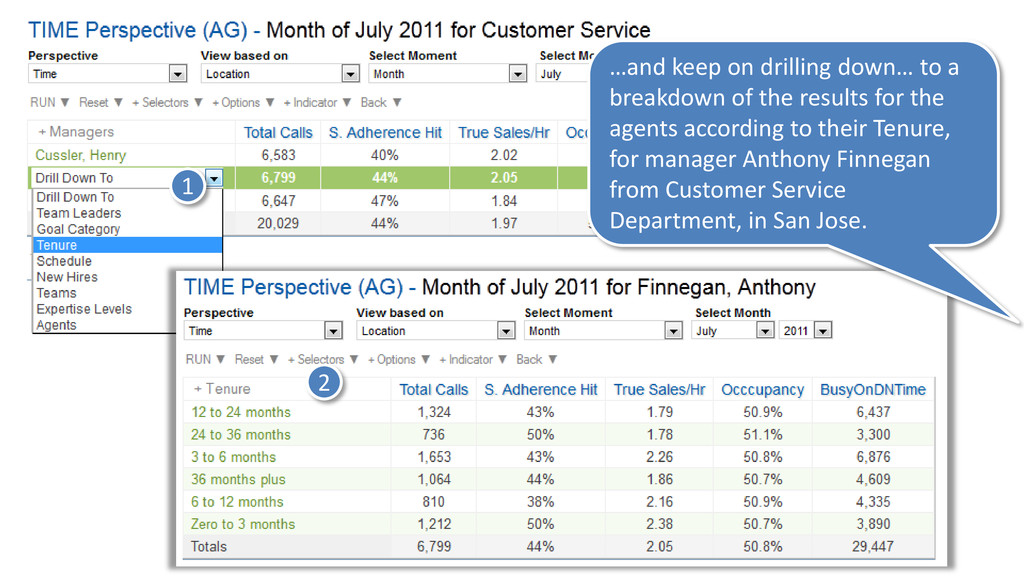
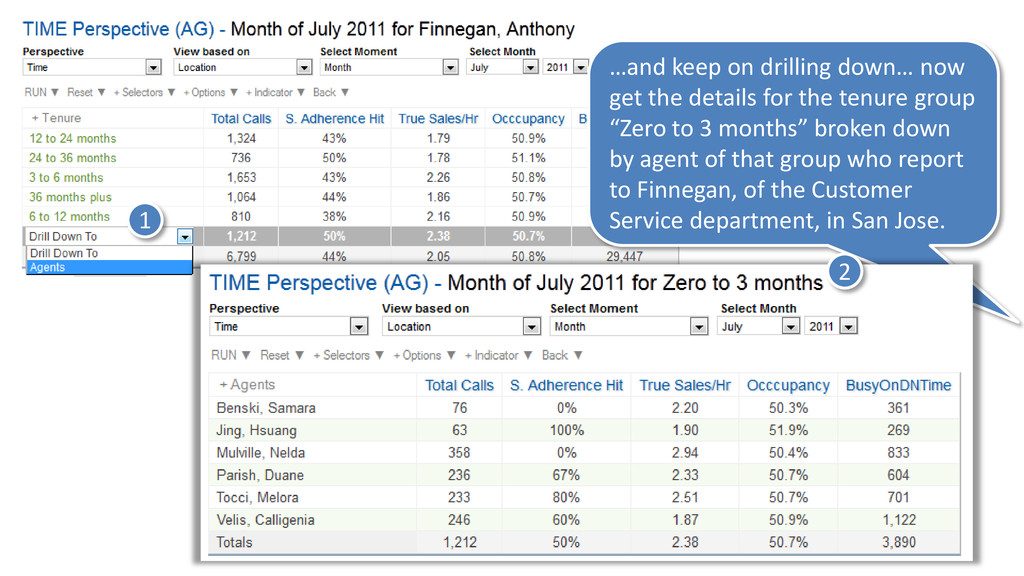
    You want to analyze the New Hire training groups for the agents who work the 1pm schedule, in the Customer Service department in the San Jose location.
  19. You have filtered the list of new hire training groups

    for your selection. Add as many indicators as you wish by clicking on “+ Indicator”.
  20. Voilà! The report is created. Default first level view is

    Yearly View… “see the forest before the trees”
  21. Click the “plus” sign or the “minus” sign to add

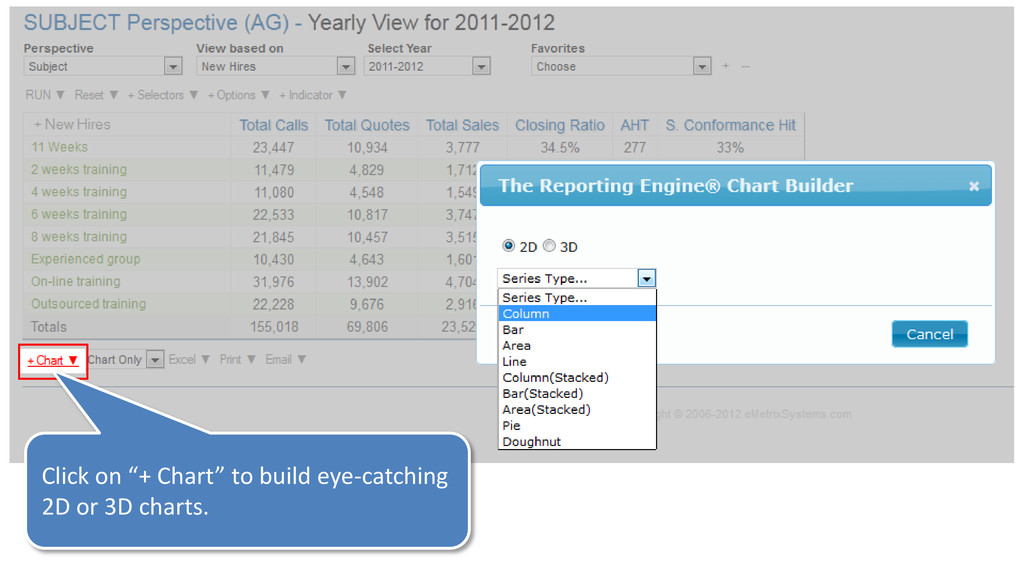
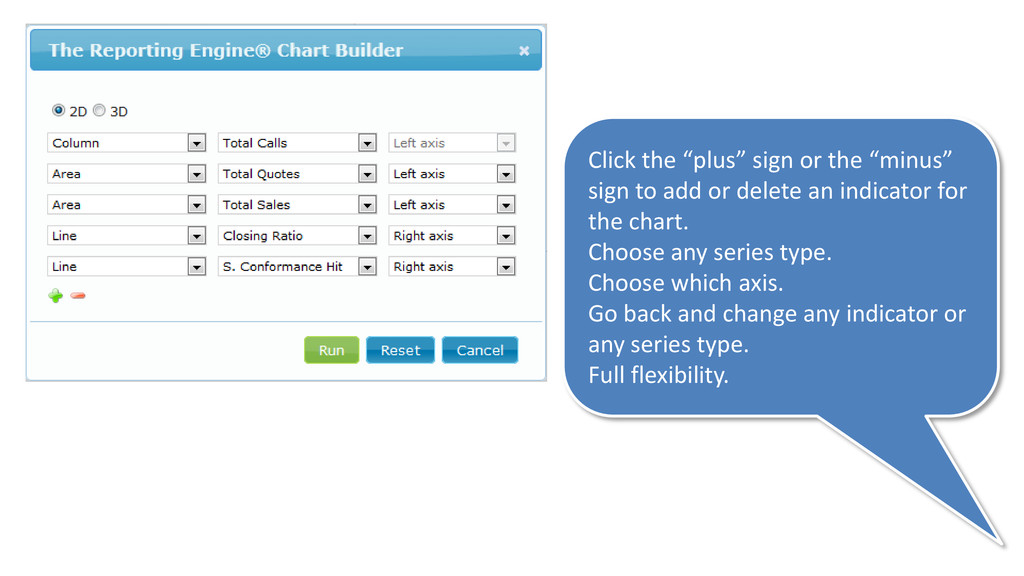
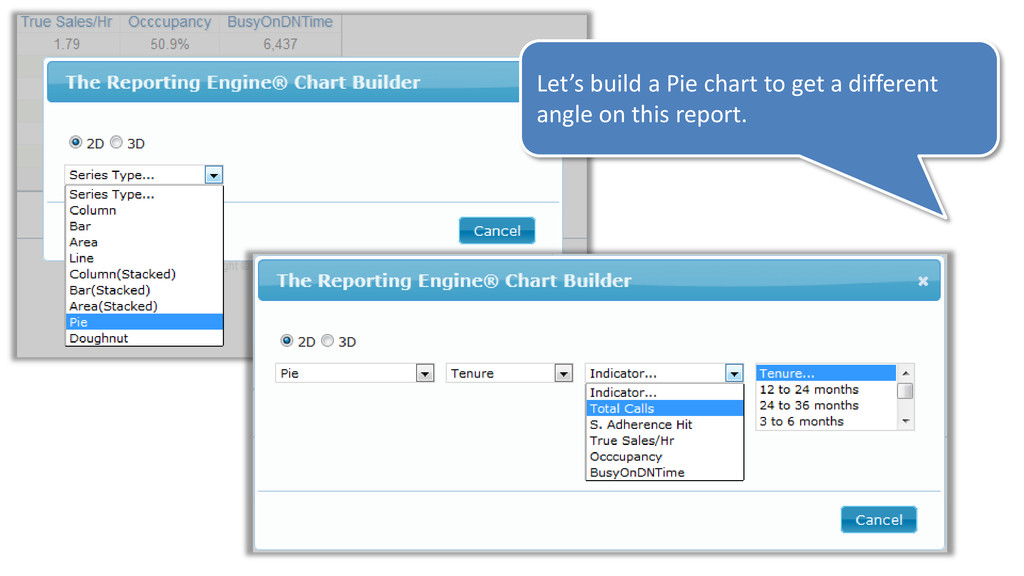
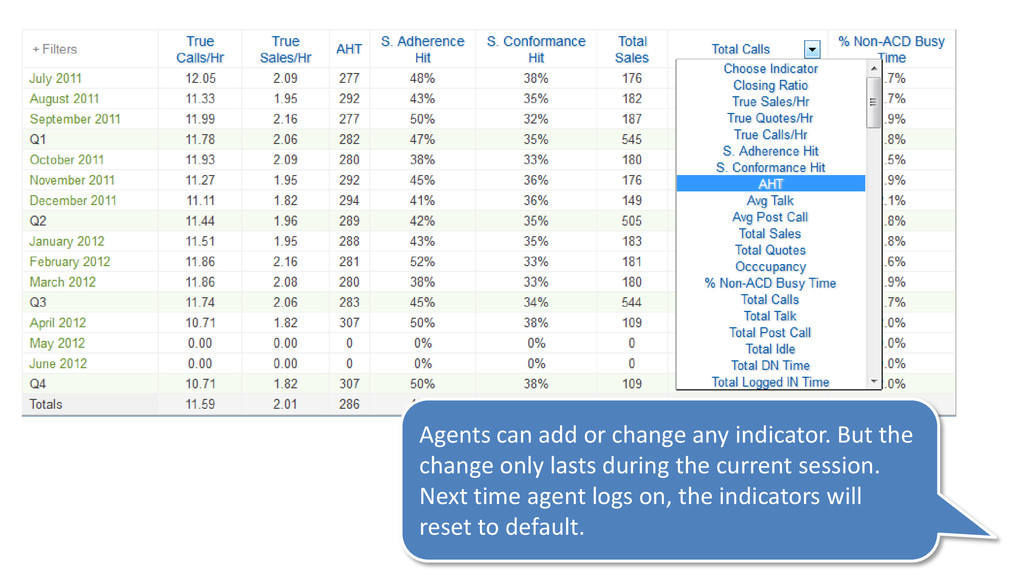
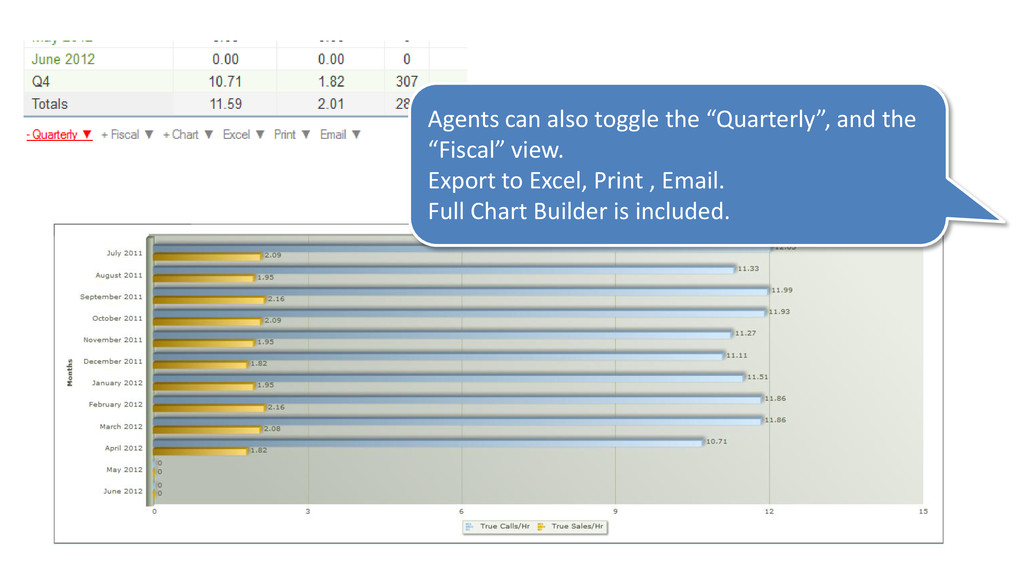
    or delete an indicator for the chart. Choose any series type. Choose which axis. Go back and change any indicator or any series type. Full flexibility.
  22. The Charts are interactive too. You can click on the

    legend to hide or show any indicator from the chart.
  23. To view more details for the “2 weeks training” group,

    just click on it… and pursue your analysis. 1 2
  24. 1 2 For more details, you can drill down to

    weeks… and select a week to view … (see next slide)
  25. Clicking on a specific week will break down the results

    according to which agents, from that group, worked that week. …wait there’s more…. 2 1
  26. Click on a specific agent to display that agent’s overall

    results… the forest for the trees … and you can continue for more details by drilling down to weeks or days for that agent. 1 2
  27. 1 2 Clicking on a specific day will break down

    the results according to which agents, from that group, worked that day. …wait there’s more….
  28. 1 Click on a specific agent to display that agent’s

    overall results… the forest for the trees … and you can continue for more details by drilling down to weeks or days for that agent. 2
  29. 1 2 Clicking on a specific month and choosing “Agent”

    will break down the results according to which agents, from that group, worked that month. …wait there’s more….
  30. 1 2 Click on a specific agent to display that

    agent’s overall results… the forest for the trees … and you can continue for more details by drilling down to weeks or days for that agent.
  31. 1 2 1 - Send an email. 2 - See

    how report looks in an email.
  32. Let’s say you are an Executive and you want to

    determine which Location needs your attention the most.
  33. Narrow down your analysis by filtering data with the selectors.

    You want to analyze the location with agents with “Level 2” expertise, and working for the “ABC International” business unit.
  34. You have filtered the list of location according to your

    selection. Add as many indicators as you wish by clicking on “+ Indicator”.
  35. Change “Moment” by selecting “Month” to view any month. You

    can also choose “Year” to view any year.
  36. 1 2 The beauty of the TIME perspective is also

    in the way you can drill down for details. Here we have a breakdown of the results by Department for San Jose.
  37. …and keep on drilling down… for example, this is a

    breakdown of the results for the Managers for the Customer Service Department, in San Jose. 1 2
  38. …and keep on drilling down… to a breakdown of the

    results for the agents according to their Tenure, for manager Anthony Finnegan from Customer Service Department, in San Jose. 1 2
  39. …and keep on drilling down… now get the details for

    the tenure group “Zero to 3 months” broken down by agent of that group who report to Finnegan, of the Customer Service department, in San Jose. 1 2
  40. Let’s say you are an Agent and you want to

    find out what your standings are for winning the upcoming sales contest.
  41. Log on as any user would, and let The Reporting

    Engine determine your level of access.
  42. This is the default view if Agents are only allowed

    to view their own stats. This is the default view if Agents are allowed to view other agents.
  43. Agents can add or change any indicator. But the change

    only lasts during the current session. Next time agent logs on, the indicators will reset to default.
  44. Agents can also toggle the “Quarterly”, and the “Fiscal” view.

    Export to Excel, Print , Email. Full Chart Builder is included.
  45. This concludes our product tour For more details, please click

    on “Request Live Demo” at the top right of this page.