Upgrade to Pro — share decks privately, control downloads, hide ads and more …

Monitory Report [Monitorama 2018] - Ian Bennett

Monitory Report [Monitorama 2018] - Ian Bennett

Slides used during Ian Bennett's Monitorama 2018 presentation. Visit http://www.monitorama.com for accompanying video/audio, as these slides do not tell the whole story. You can also visit https://github.com/twitter/sekhmet for more.

Avatar for Ian Bennett

Ian Bennett

June 04, 2018

Other Decks in Technology

Transcript

  1. I HAVE SEEN YOUR O B S E R V

    A B I L I T Y FUTURE
  2. YOU

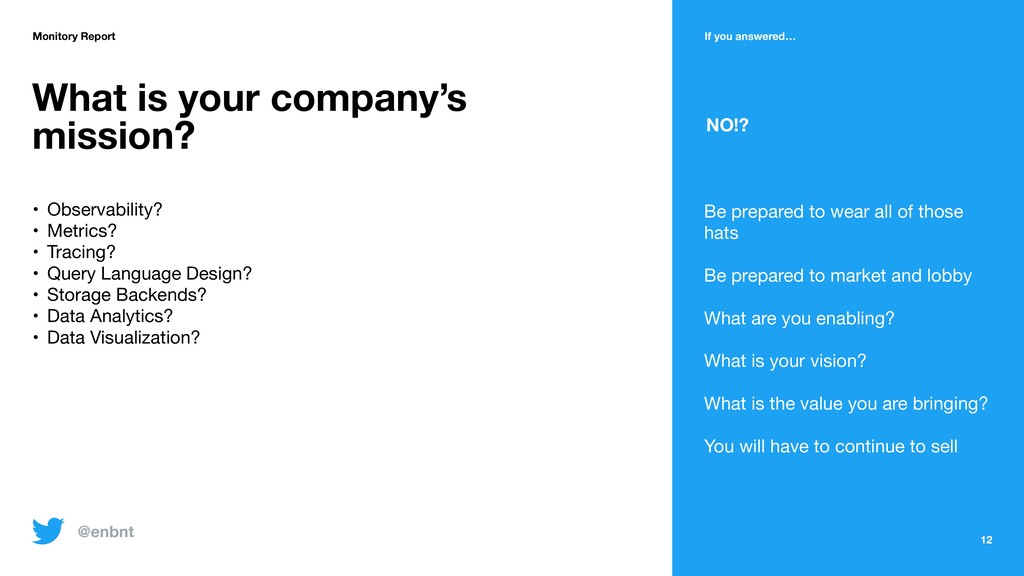
  3. 12 Monitory Report If you answered… What is your company’s

    mission? Be prepared to wear all of those hats Be prepared to market and lobby What are you enabling? What is your vision? What is the value you are bringing? You will have to continue to sell NO!? • Observability? • Metrics? • Tracing? • Query Language Design? • Storage Backends? • Data Analytics? • Data Visualization? @enbnt
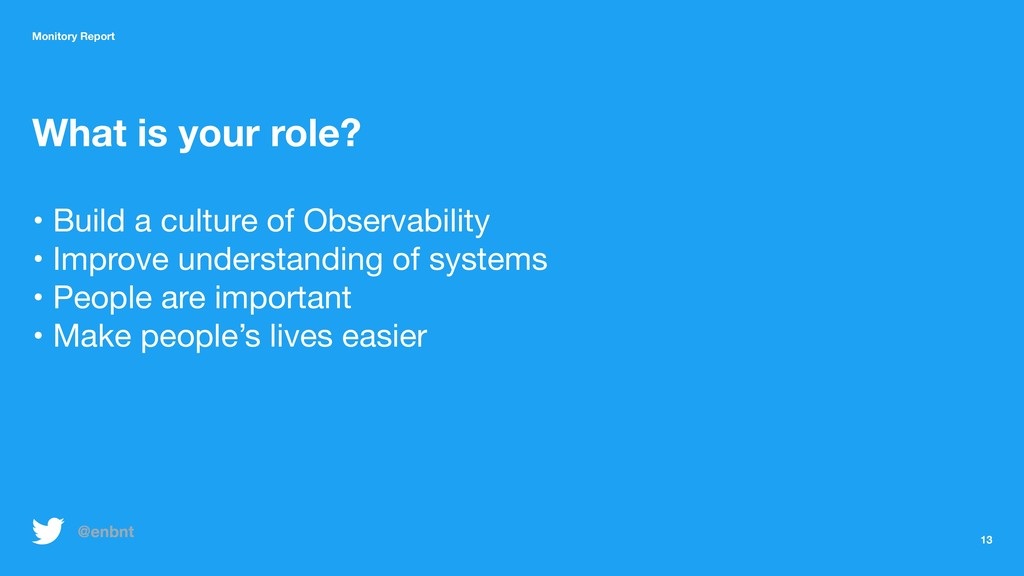
  4. 13 Monitory Report What is your role? • Build a

    culture of Observability • Improve understanding of systems • People are important • Make people’s lives easier @enbnt
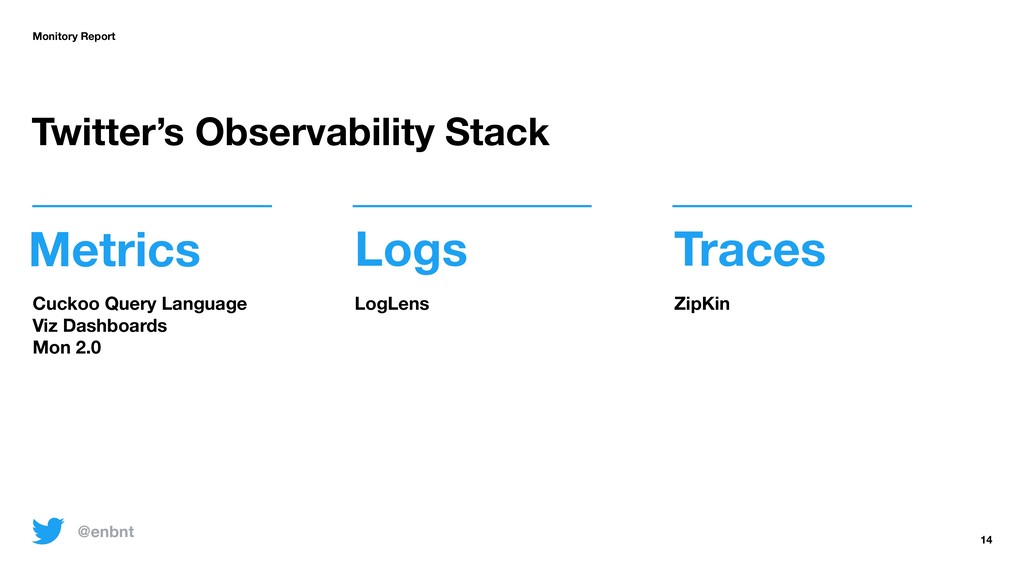
  5. Metrics Monitory Report Logs Traces Cuckoo Query Language Viz Dashboards

    Mon 2.0 LogLens ZipKin Twitter’s Observability Stack 14 @enbnt
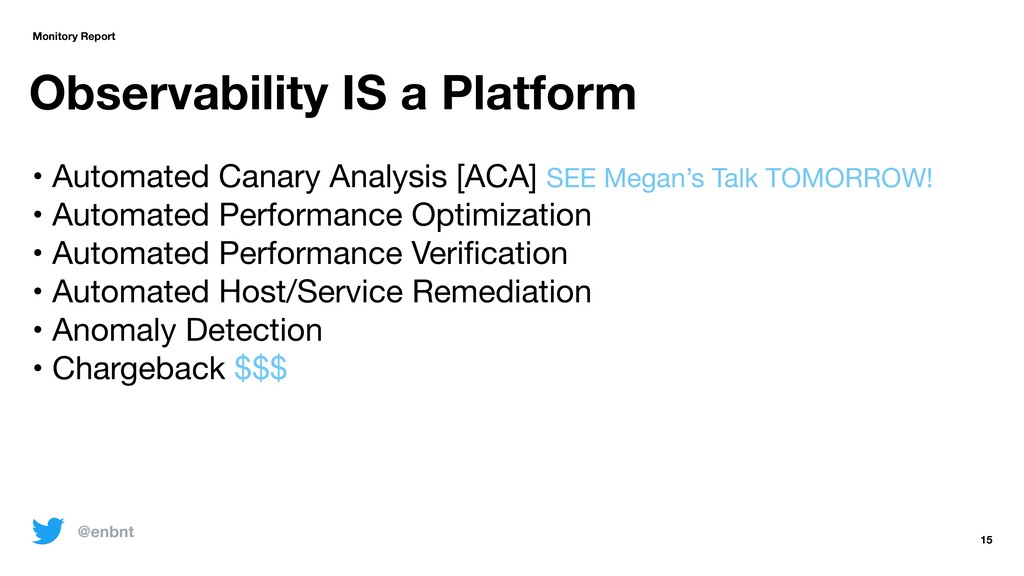
  6. Observability IS a Platform 15 Monitory Report • Automated Canary

    Analysis [ACA] SEE Megan’s Talk TOMORROW! • Automated Performance Optimization • Automated Performance Verification • Automated Host/Service Remediation • Anomaly Detection • Chargeback $$$ @enbnt
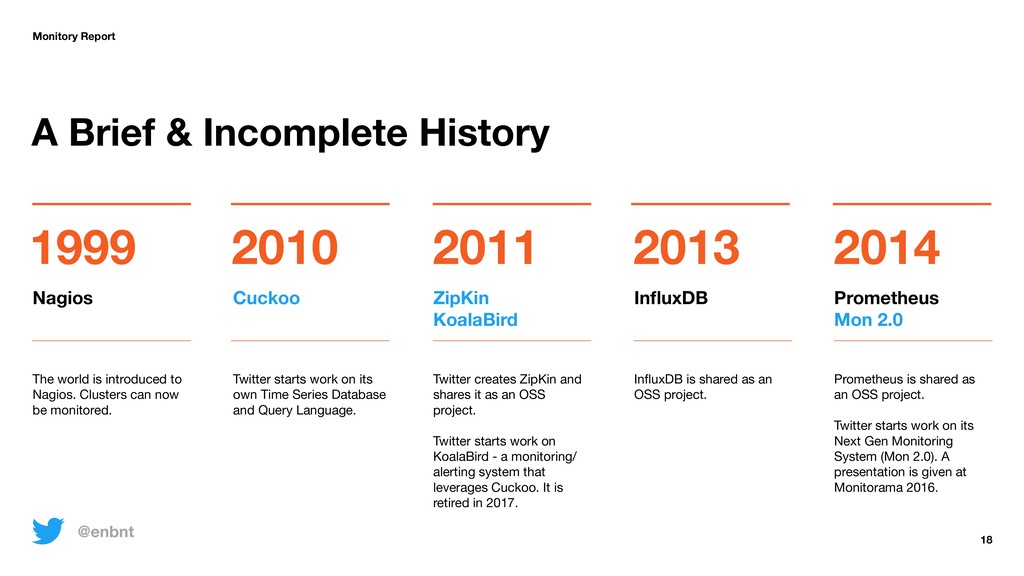
  7. 18 Monitory Report 1999 2010 2011 The world is introduced

    to Nagios. Clusters can now be monitored. Twitter starts work on its own Time Series Database and Query Language. Twitter creates ZipKin and shares it as an OSS project. Twitter starts work on KoalaBird - a monitoring/ alerting system that leverages Cuckoo. It is retired in 2017. 2013 InfluxDB is shared as an OSS project. 2014 Prometheus is shared as an OSS project. Twitter starts work on its Next Gen Monitoring System (Mon 2.0). A presentation is given at Monitorama 2016. A Brief & Incomplete History Nagios Cuckoo ZipKin KoalaBird InfluxDB Prometheus Mon 2.0 @enbnt
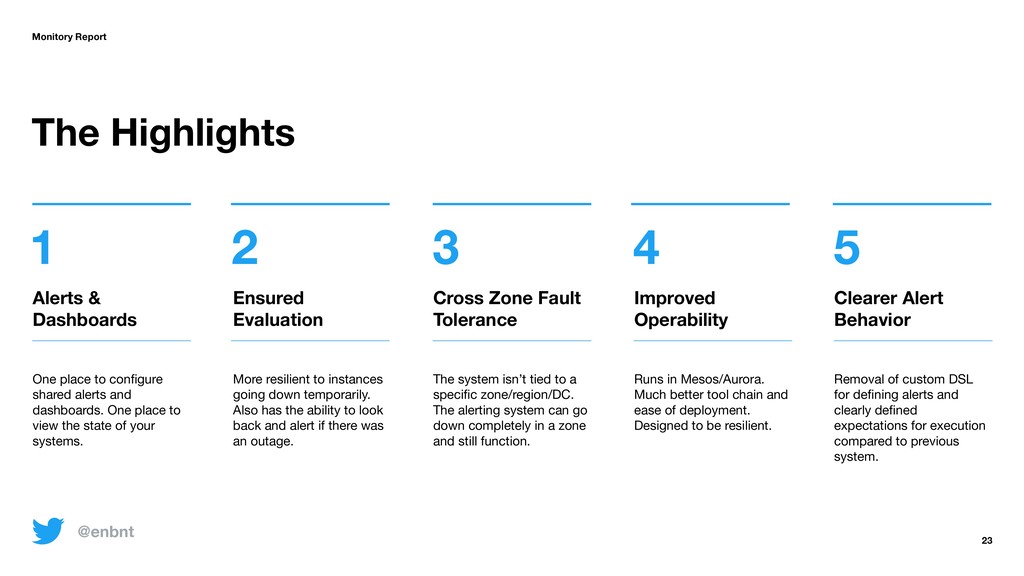
  8. 23 Alerts & Dashboards 1 2 3 Ensured Evaluation Cross

    Zone Fault Tolerance One place to configure shared alerts and dashboards. One place to view the state of your systems. More resilient to instances going down temporarily. Also has the ability to look back and alert if there was an outage. The system isn’t tied to a specific zone/region/DC. The alerting system can go down completely in a zone and still function. 4 Improved Operability Runs in Mesos/Aurora. Much better tool chain and ease of deployment. Designed to be resilient. 5 Clearer Alert Behavior Removal of custom DSL for defining alerts and clearly defined expectations for execution compared to previous system. The Highlights Monitory Report @enbnt
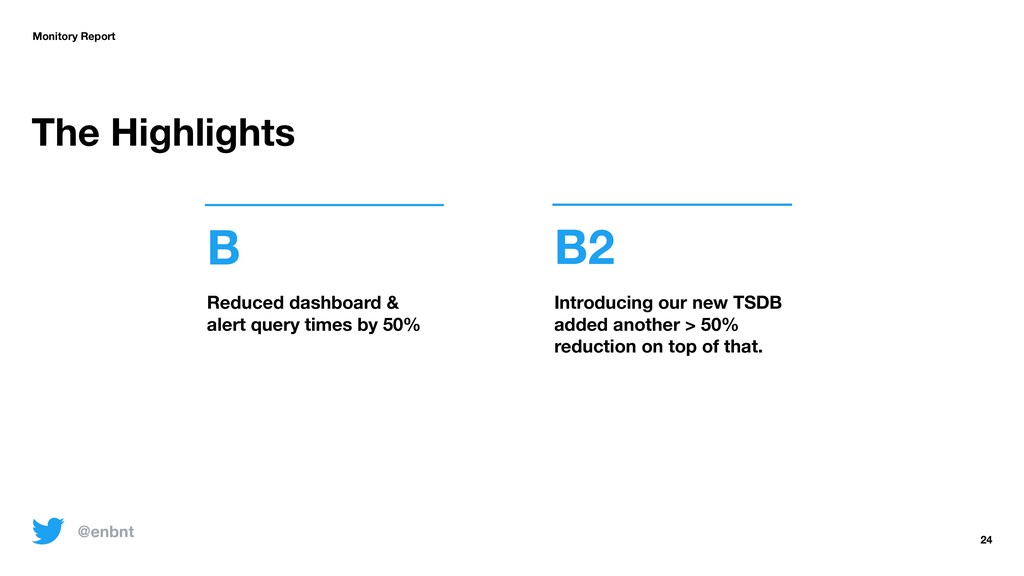
  9. Monitory Report B B2 Reduced dashboard & alert query times

    by 50% Introducing our new TSDB added another > 50% reduction on top of that. 24 @enbnt The Highlights
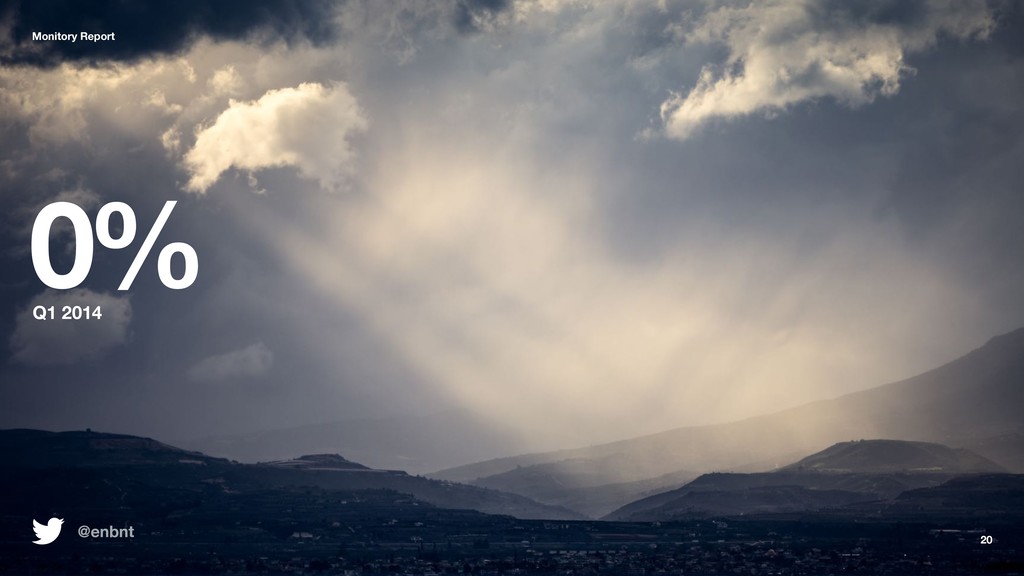
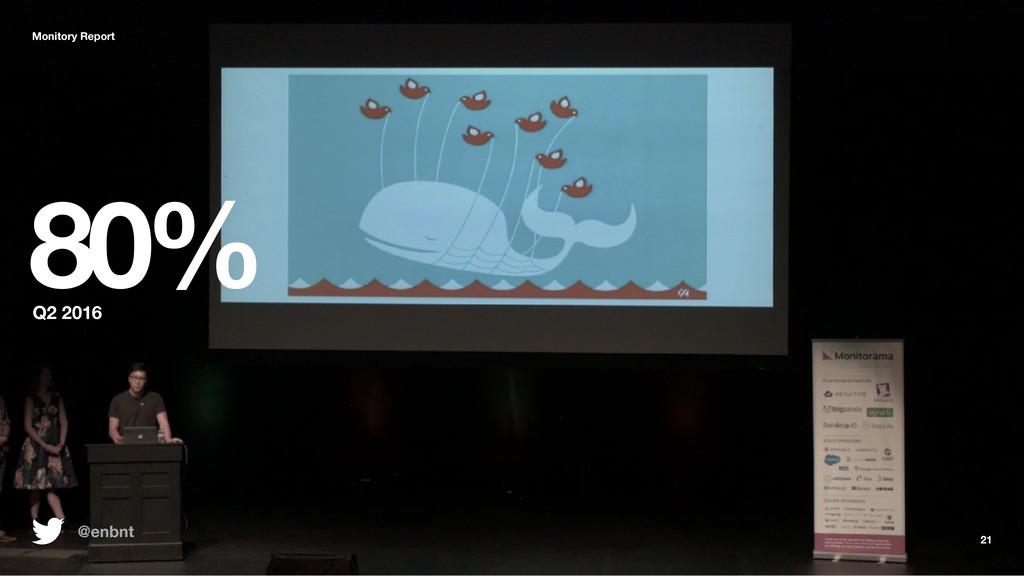
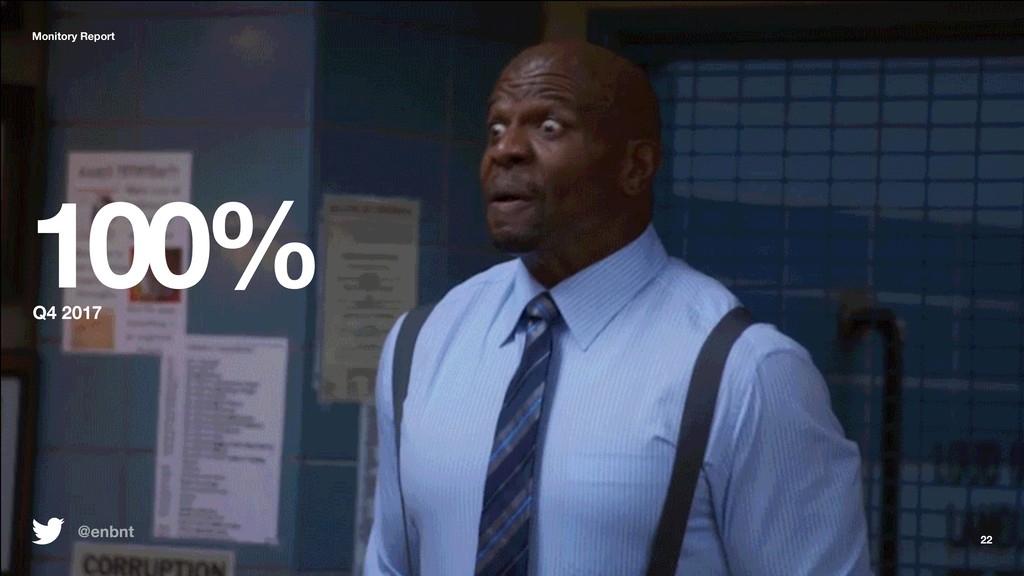
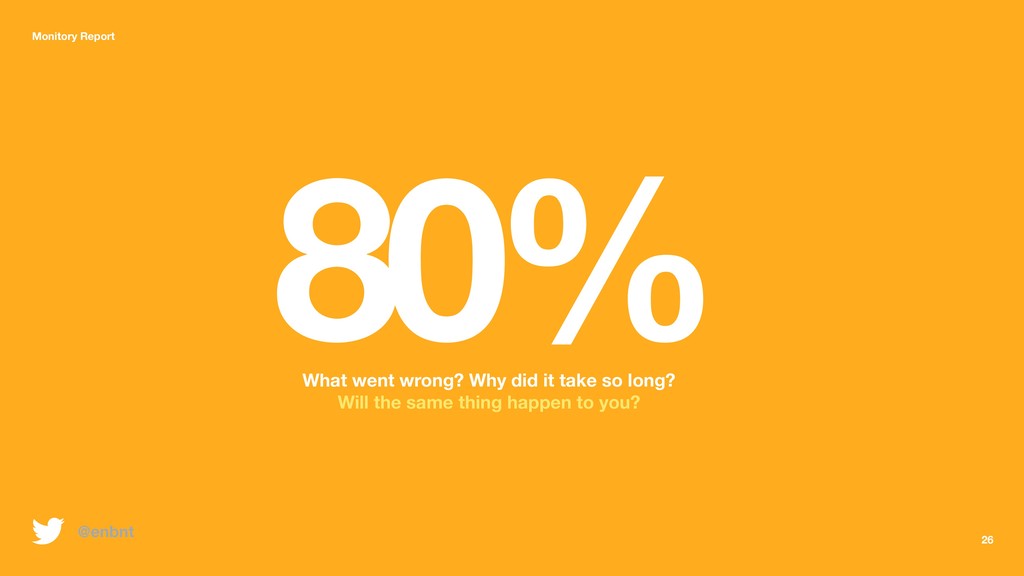
  10. 80% What went wrong? Why did it take so long?

    Will the same thing happen to you? 26 Monitory Report @enbnt
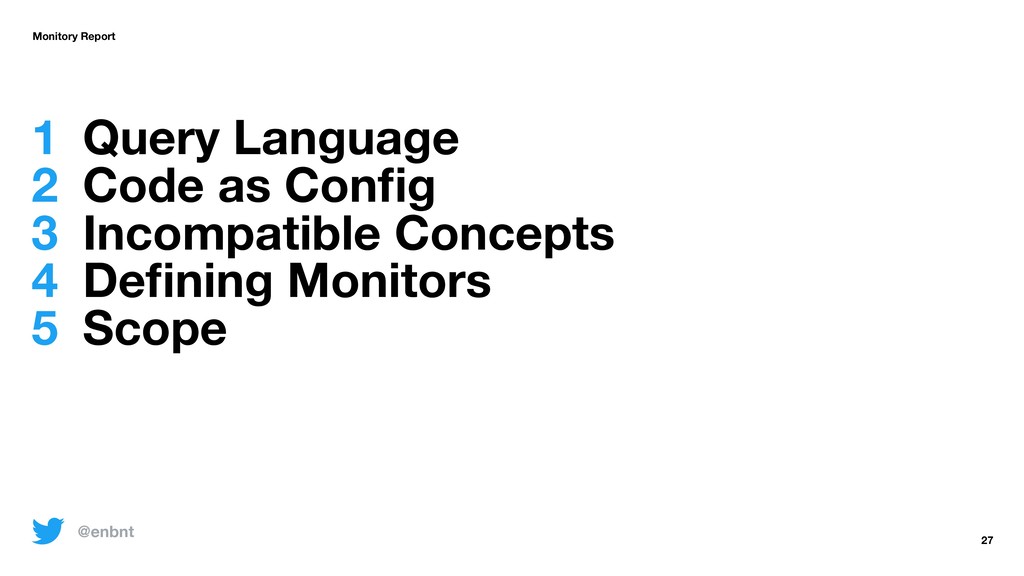
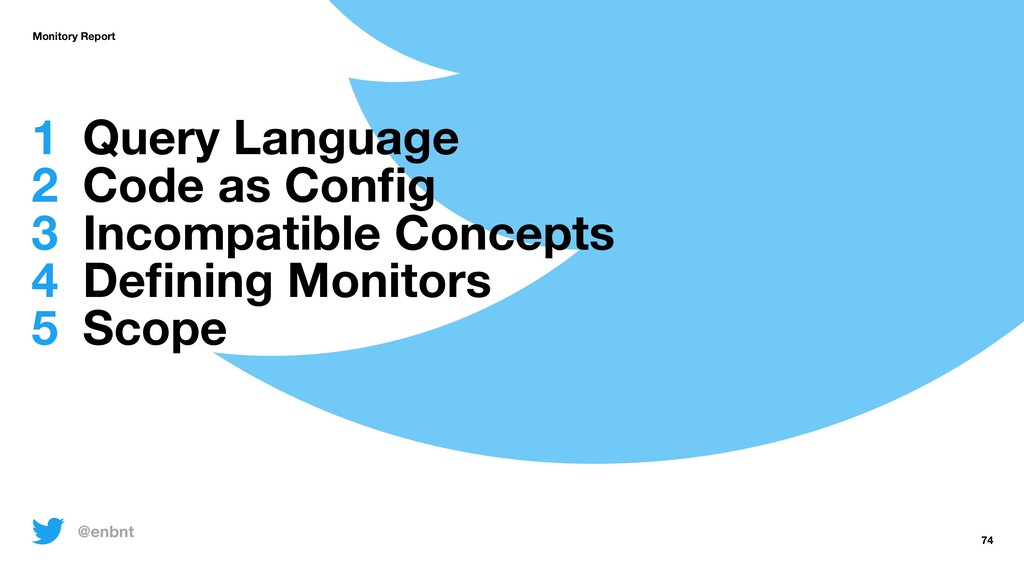
  11. 27 1 2 3 4 5 Query Language Code as

    Config Incompatible Concepts Defining Monitors Scope Monitory Report @enbnt
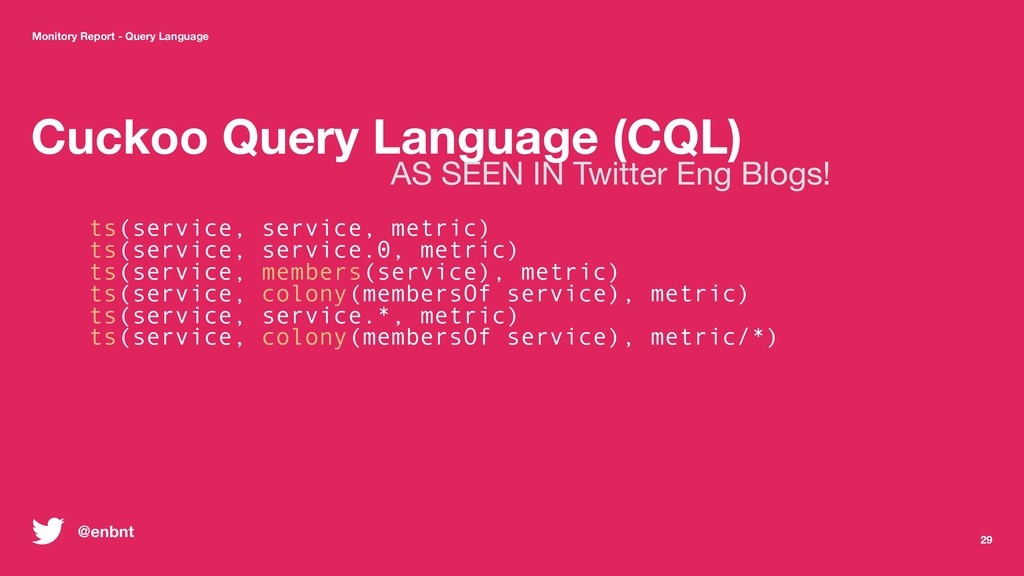
  12. 29 Monitory Report - Query Language Cuckoo Query Language (CQL)

    AS SEEN IN Twitter Eng Blogs! ts(service, service, metric) ts(service, service.0, metric) ts(service, members(service), metric) ts(service, colony(membersOf service), metric) ts(service, service.*, metric) ts(service, colony(membersOf service), metric/*) @enbnt
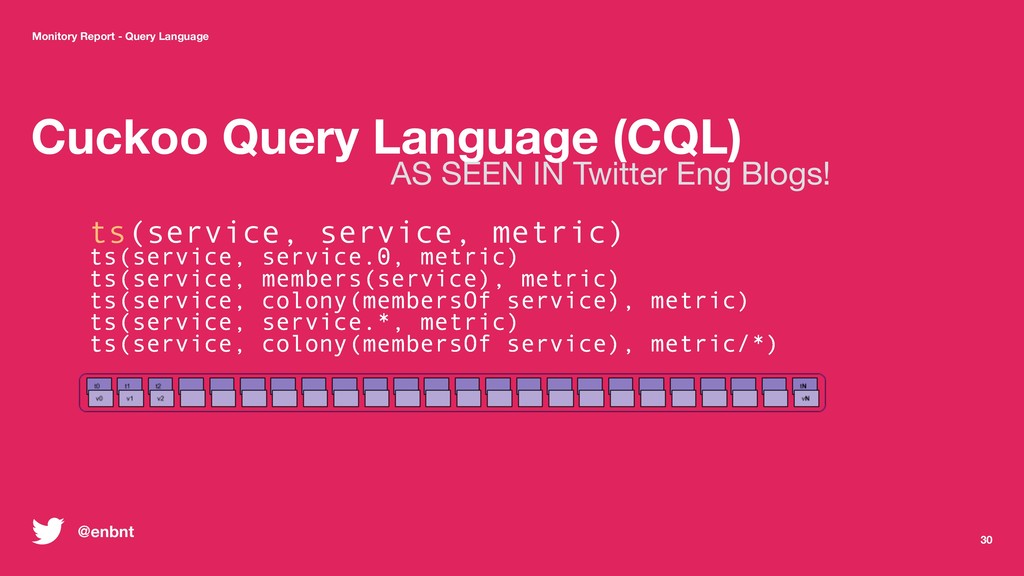
  13. 30 Monitory Report - Query Language Cuckoo Query Language (CQL)

    AS SEEN IN Twitter Eng Blogs! ts(service, service, metric) ts(service, service.0, metric) ts(service, members(service), metric) ts(service, colony(membersOf service), metric) ts(service, service.*, metric) ts(service, colony(membersOf service), metric/*) @enbnt
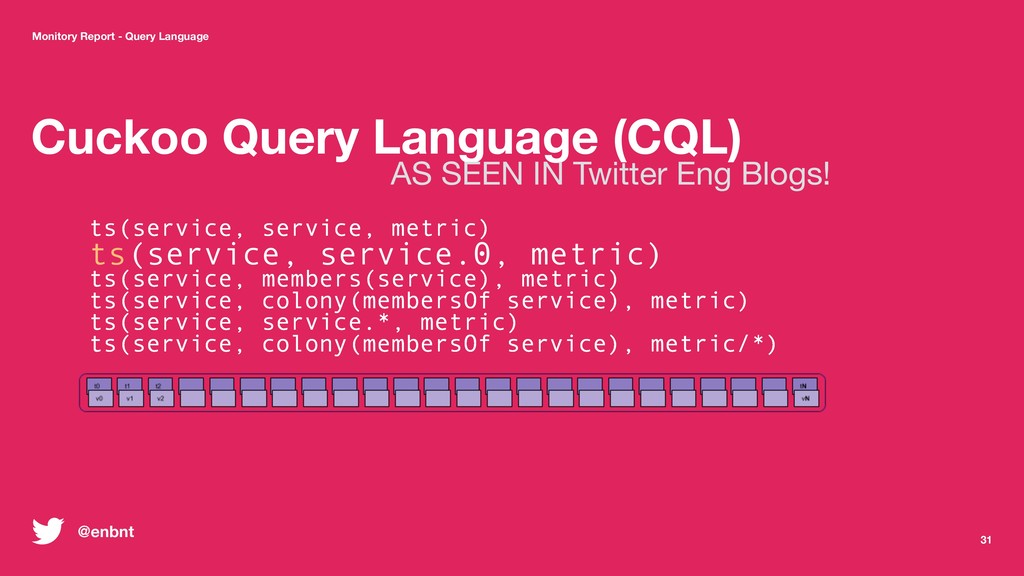
  14. 31 Monitory Report - Query Language Cuckoo Query Language (CQL)

    AS SEEN IN Twitter Eng Blogs! ts(service, service, metric) ts(service, service.0, metric) ts(service, members(service), metric) ts(service, colony(membersOf service), metric) ts(service, service.*, metric) ts(service, colony(membersOf service), metric/*) @enbnt
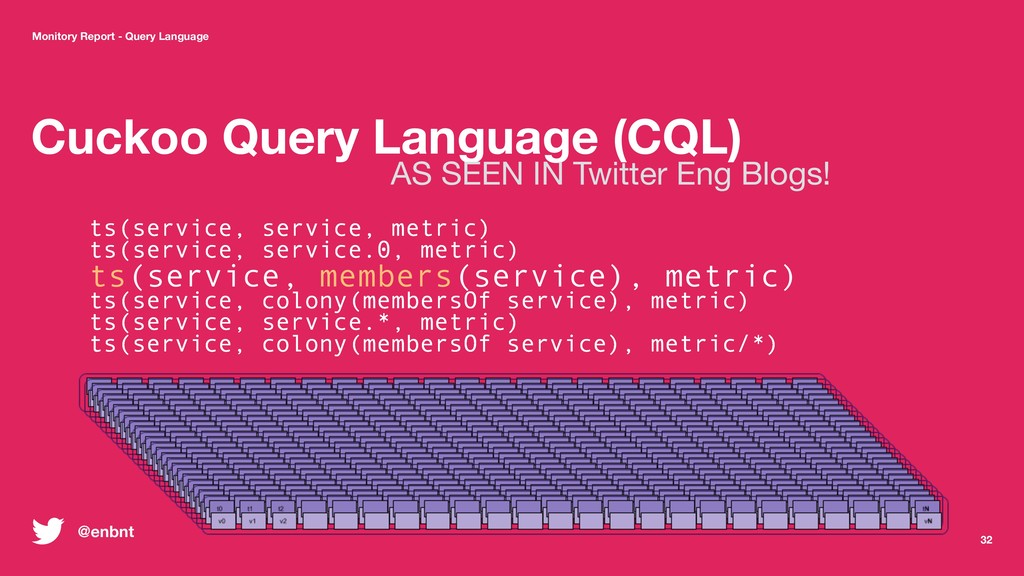
  15. 32 Monitory Report - Query Language Cuckoo Query Language (CQL)

    AS SEEN IN Twitter Eng Blogs! ts(service, service, metric) ts(service, service.0, metric) ts(service, members(service), metric) ts(service, colony(membersOf service), metric) ts(service, service.*, metric) ts(service, colony(membersOf service), metric/*) @enbnt
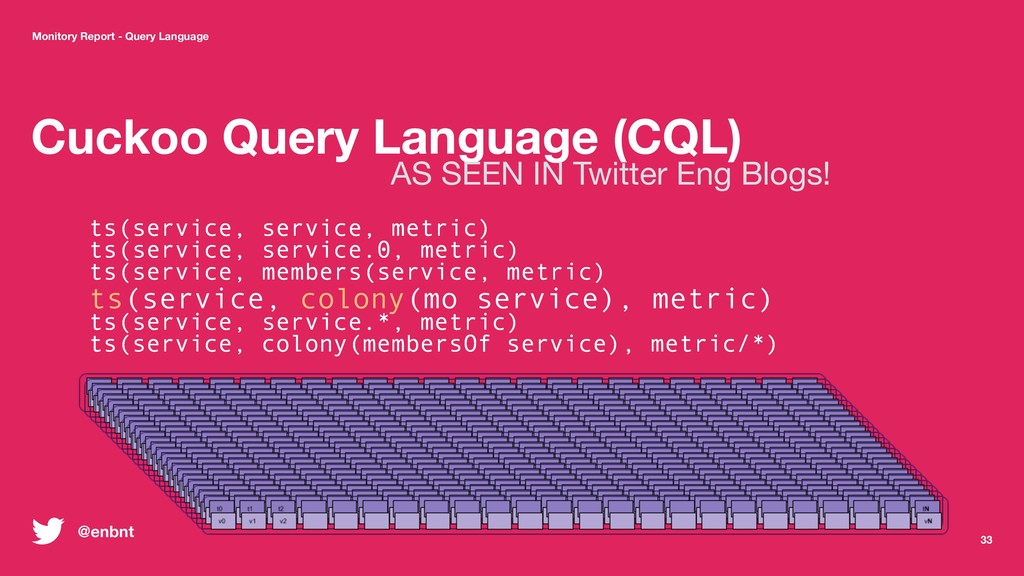
  16. 33 Monitory Report - Query Language Cuckoo Query Language (CQL)

    AS SEEN IN Twitter Eng Blogs! ts(service, service, metric) ts(service, service.0, metric) ts(service, members(service, metric) ts(service, colony(mo service), metric) ts(service, service.*, metric) ts(service, colony(membersOf service), metric/*) @enbnt
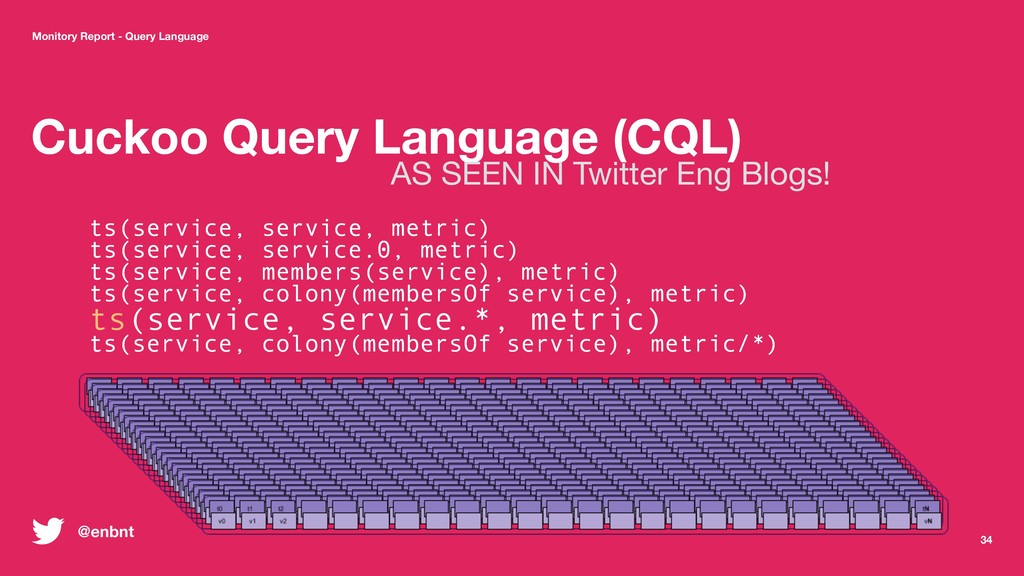
  17. 34 Monitory Report - Query Language Cuckoo Query Language (CQL)

    AS SEEN IN Twitter Eng Blogs! ts(service, service, metric) ts(service, service.0, metric) ts(service, members(service), metric) ts(service, colony(membersOf service), metric) ts(service, service.*, metric) ts(service, colony(membersOf service), metric/*) @enbnt
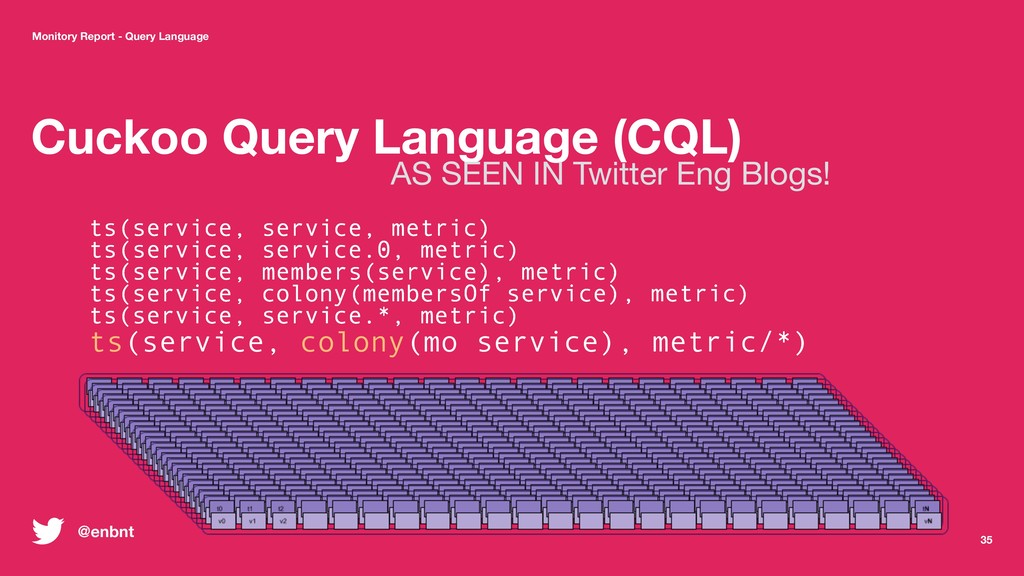
  18. 35 Monitory Report - Query Language Cuckoo Query Language (CQL)

    AS SEEN IN Twitter Eng Blogs! ts(service, service, metric) ts(service, service.0, metric) ts(service, members(service), metric) ts(service, colony(membersOf service), metric) ts(service, service.*, metric) ts(service, colony(mo service), metric/*) @enbnt
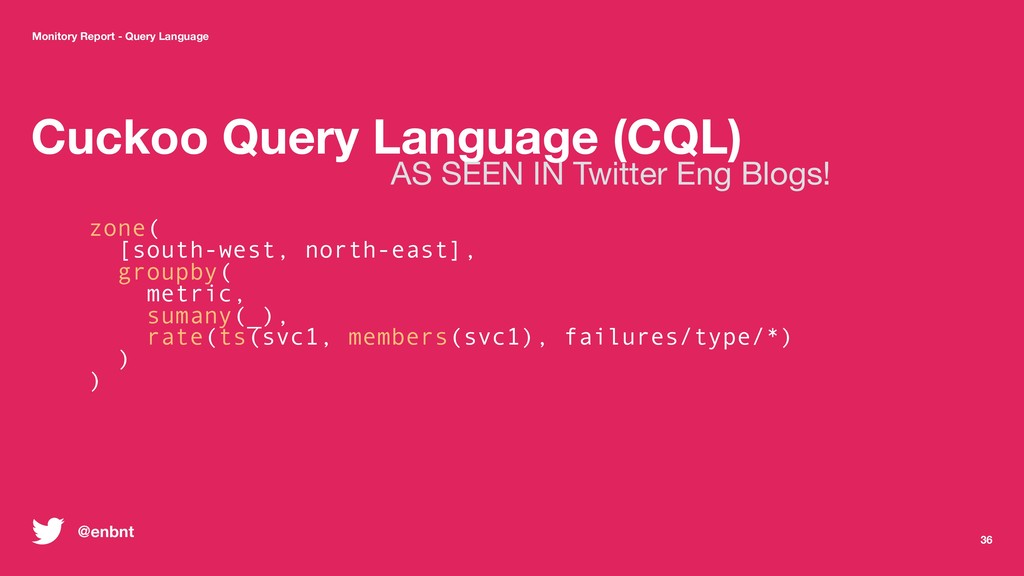
  19. 36 Monitory Report - Query Language Cuckoo Query Language (CQL)

    AS SEEN IN Twitter Eng Blogs! zone( [south-west, north-east], groupby( metric, sumany(_), rate(ts(svc1, members(svc1), failures/type/*) ) ) @enbnt
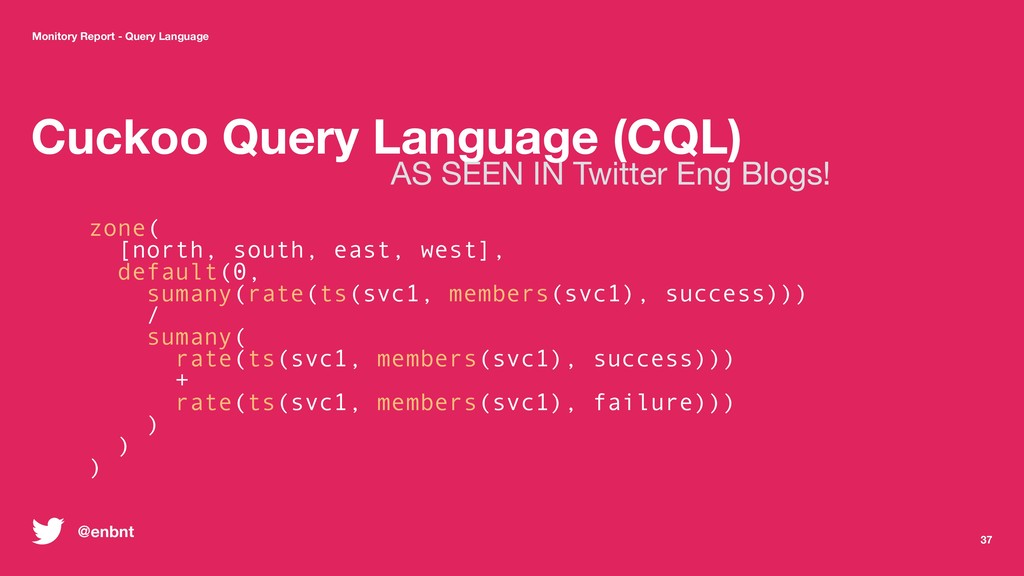
  20. 37 Monitory Report - Query Language Cuckoo Query Language (CQL)

    AS SEEN IN Twitter Eng Blogs! zone( [north, south, east, west], default(0, sumany(rate(ts(svc1, members(svc1), success))) / sumany( rate(ts(svc1, members(svc1), success))) + rate(ts(svc1, members(svc1), failure))) ) ) ) @enbnt
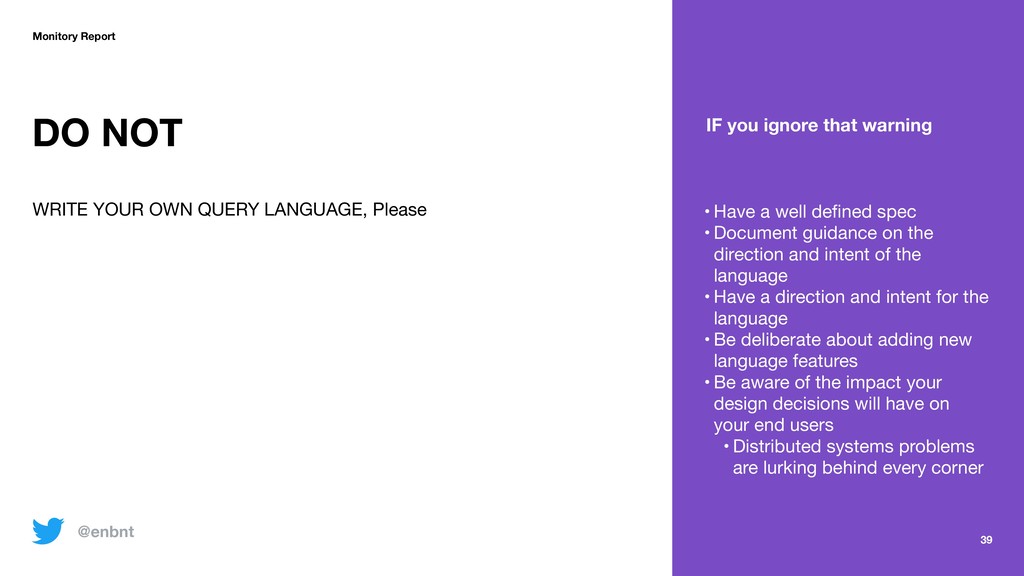
  21. 39 Monitory Report DO NOT WRITE YOUR OWN QUERY LANGUAGE,

    Please • Have a well defined spec • Document guidance on the direction and intent of the language • Have a direction and intent for the language • Be deliberate about adding new language features • Be aware of the impact your design decisions will have on your end users • Distributed systems problems are lurking behind every corner IF you ignore that warning @enbnt
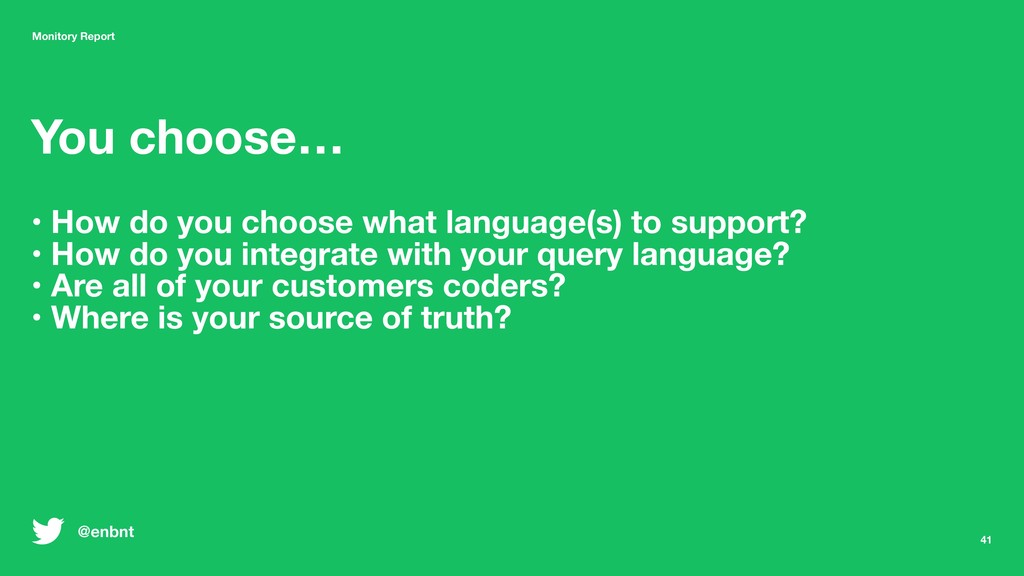
  22. 41 Monitory Report You choose… • How do you choose

    what language(s) to support? • How do you integrate with your query language? • Are all of your customers coders? • Where is your source of truth? @enbnt
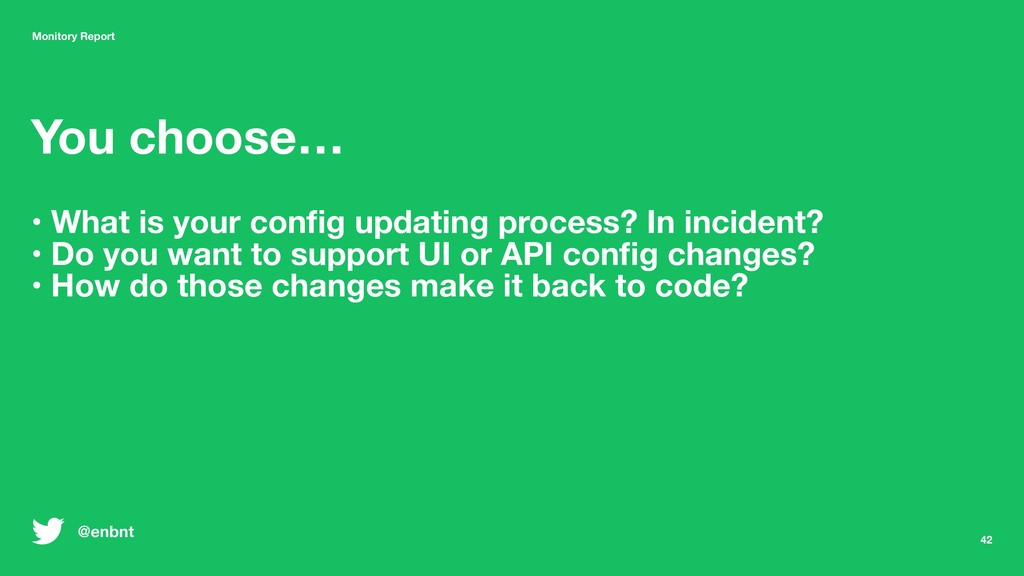
  23. 42 Monitory Report You choose… • What is your config

    updating process? In incident? • Do you want to support UI or API config changes? • How do those changes make it back to code? @enbnt
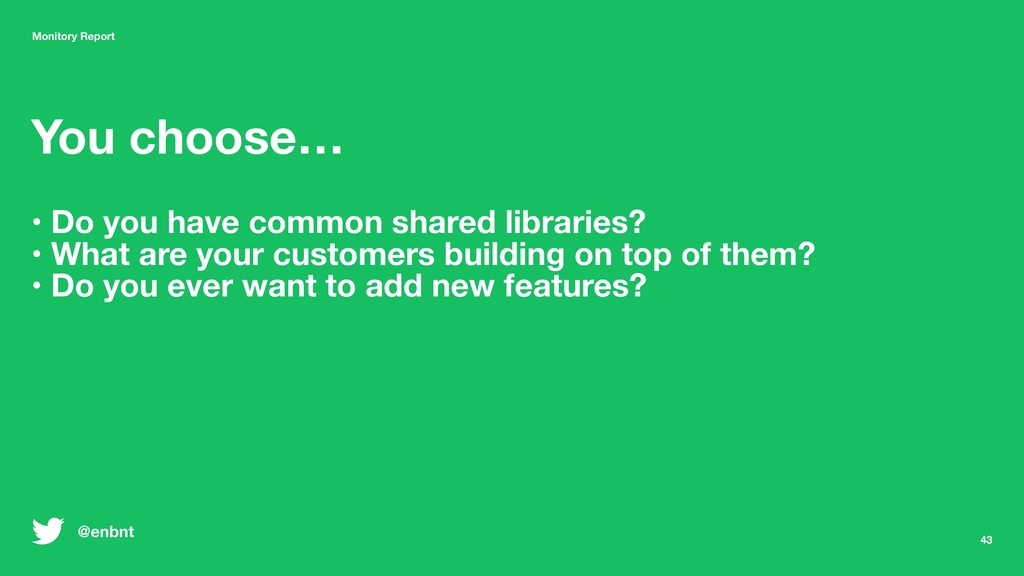
  24. 43 Monitory Report You choose… • Do you have common

    shared libraries? • What are your customers building on top of them? • Do you ever want to add new features? @enbnt
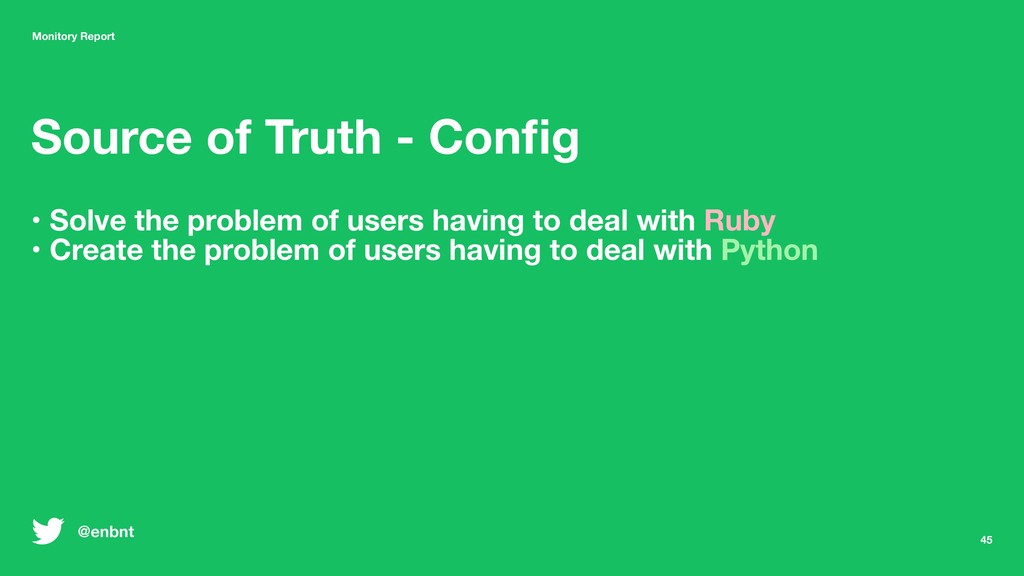
  25. 45 Monitory Report Source of Truth - Config • Solve

    the problem of users having to deal with Ruby • Create the problem of users having to deal with Python @enbnt
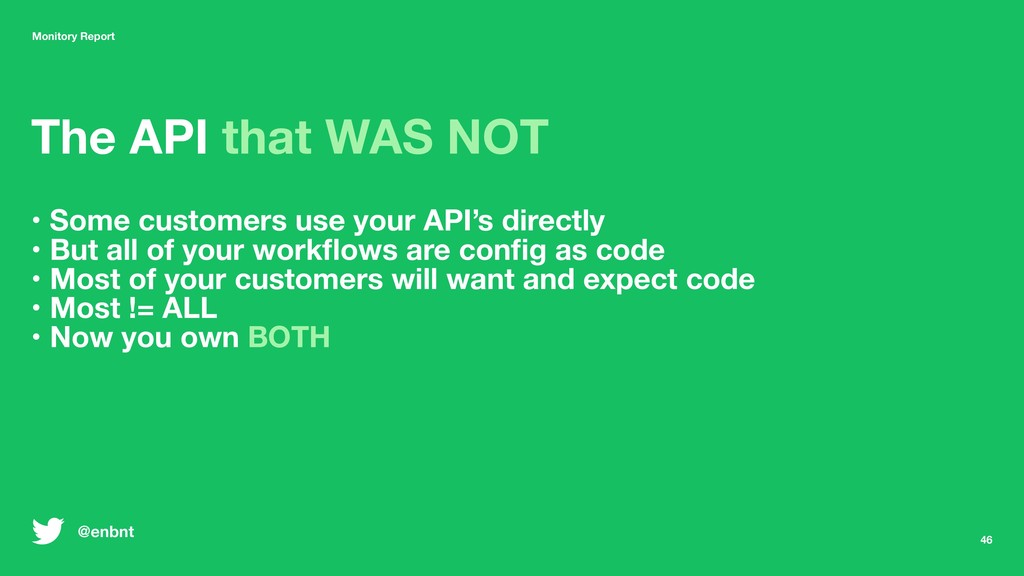
  26. 46 Monitory Report The API that WAS NOT • Some

    customers use your API’s directly • But all of your workflows are config as code • Most of your customers will want and expect code • Most != ALL • Now you own BOTH @enbnt
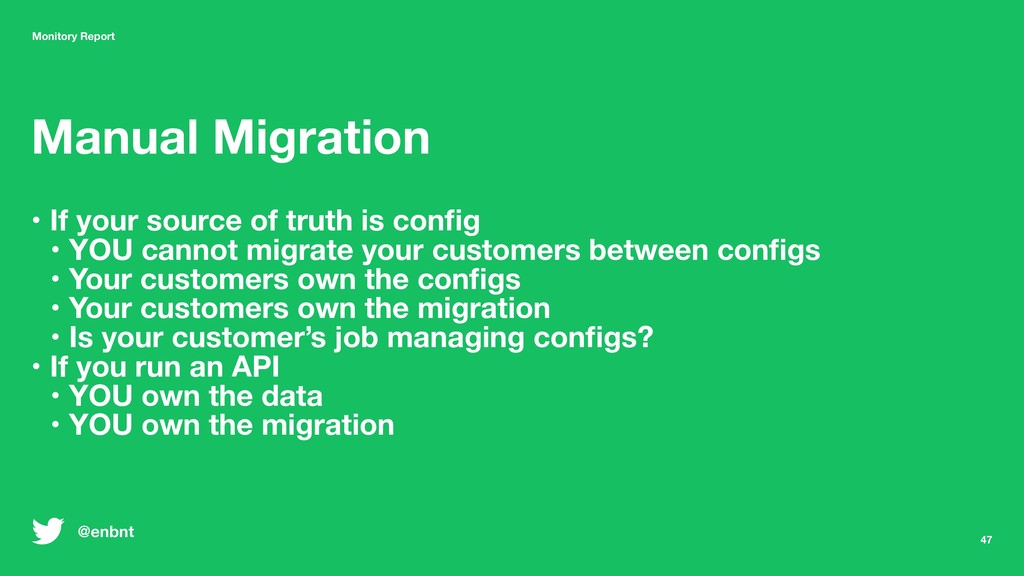
  27. 47 Monitory Report Manual Migration • If your source of

    truth is config • YOU cannot migrate your customers between configs • Your customers own the configs • Your customers own the migration • Is your customer’s job managing configs? • If you run an API • YOU own the data • YOU own the migration @enbnt
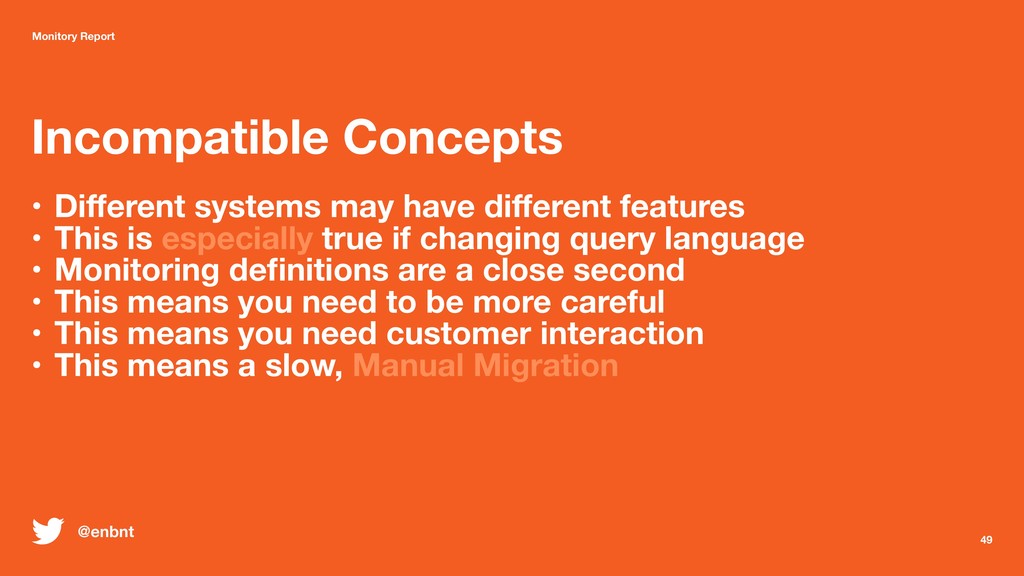
  28. 49 Monitory Report Incompatible Concepts • Different systems may have

    different features • This is especially true if changing query language • Monitoring definitions are a close second • This means you need to be more careful • This means you need customer interaction • This means a slow, Manual Migration @enbnt
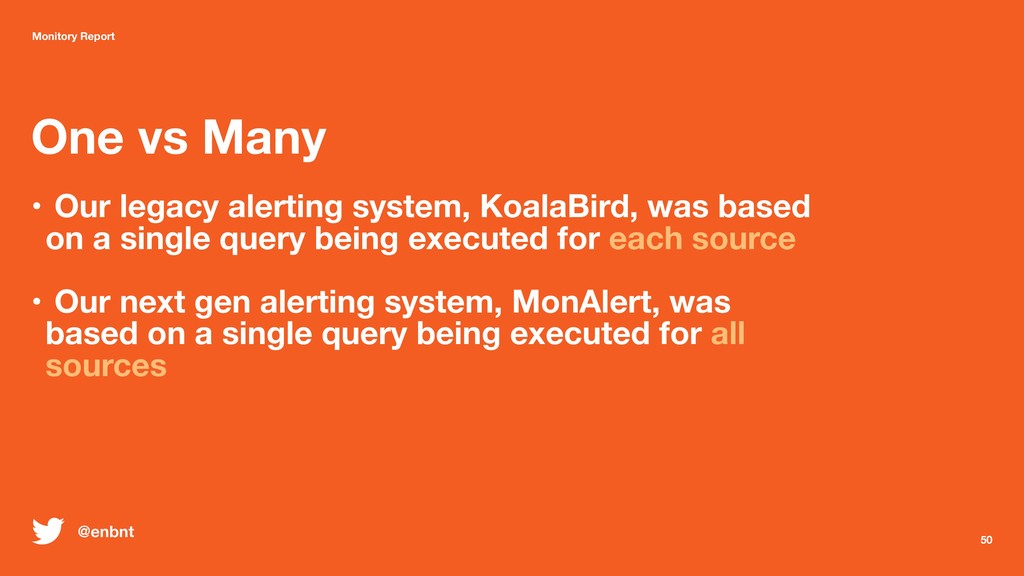
  29. 50 Monitory Report One vs Many • Our legacy alerting

    system, KoalaBird, was based on a single query being executed for each source
 • Our next gen alerting system, MonAlert, was based on a single query being executed for all sources @enbnt
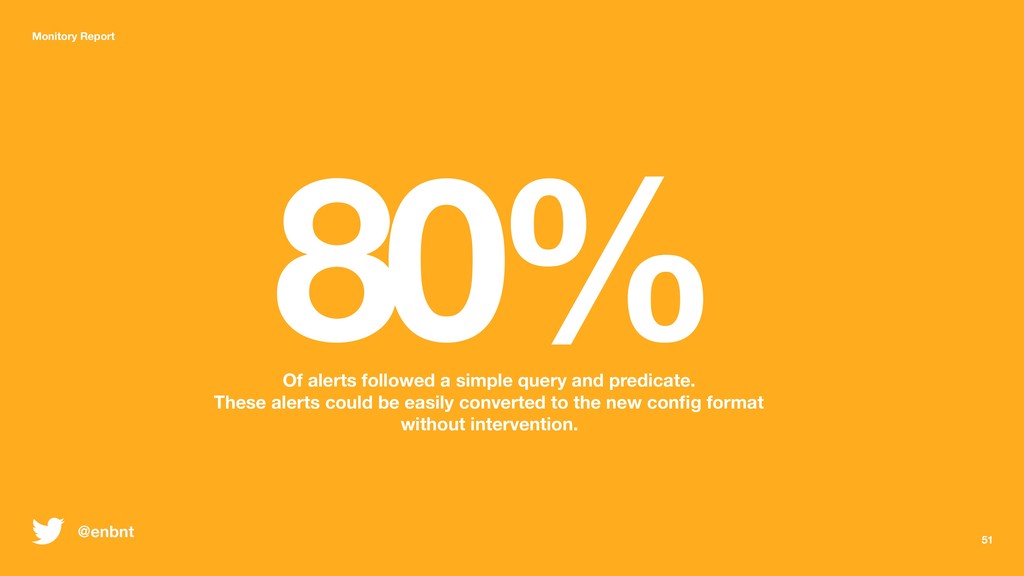
  30. 80% Of alerts followed a simple query and predicate. These

    alerts could be easily converted to the new config format without intervention. 51 Monitory Report @enbnt
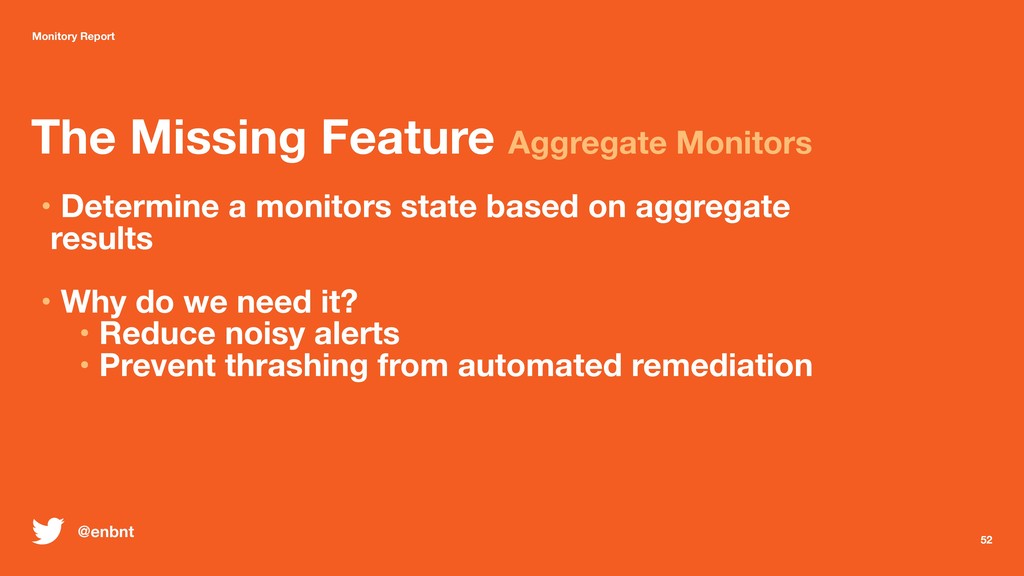
  31. 52 Monitory Report The Missing Feature Aggregate Monitors • Determine

    a monitors state based on aggregate results
 • Why do we need it? • Reduce noisy alerts • Prevent thrashing from automated remediation @enbnt
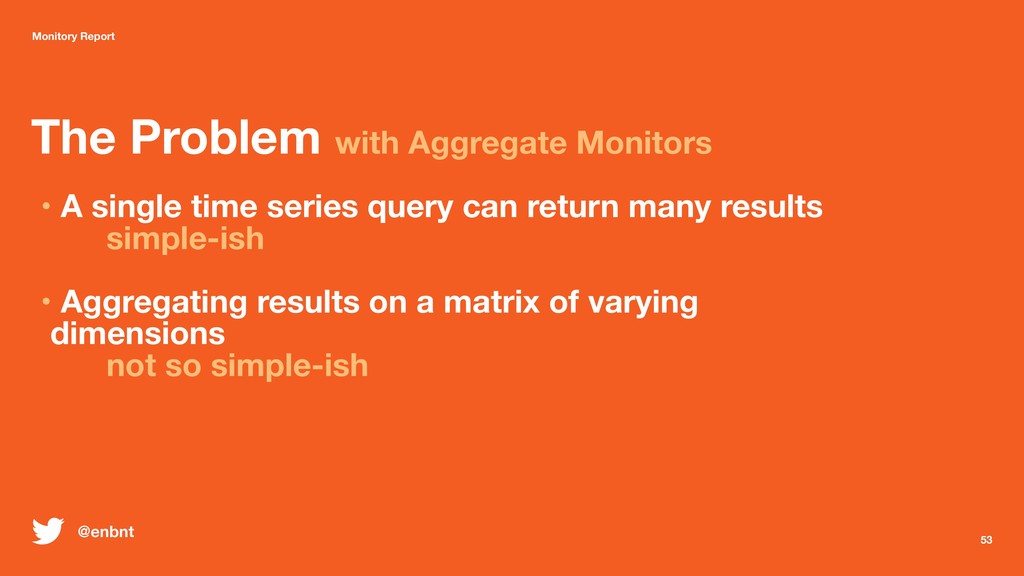
  32. 53 Monitory Report The Problem with Aggregate Monitors • A

    single time series query can return many results simple-ish
 • Aggregating results on a matrix of varying dimensions not so simple-ish @enbnt
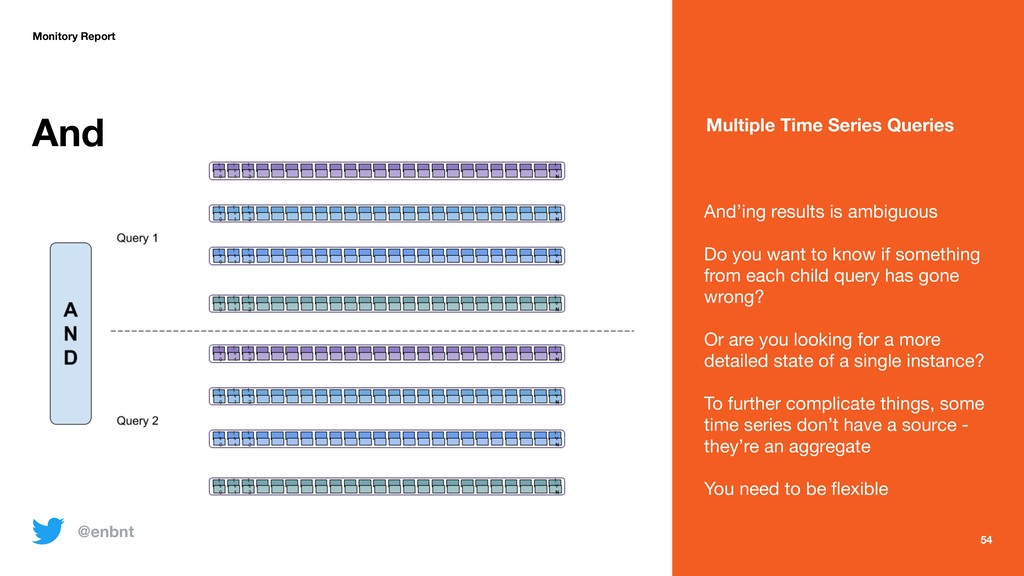
  33. 54 Monitory Report And And’ing results is ambiguous Do you

    want to know if something from each child query has gone wrong? Or are you looking for a more detailed state of a single instance? To further complicate things, some time series don’t have a source - they’re an aggregate You need to be flexible Multiple Time Series Queries @enbnt
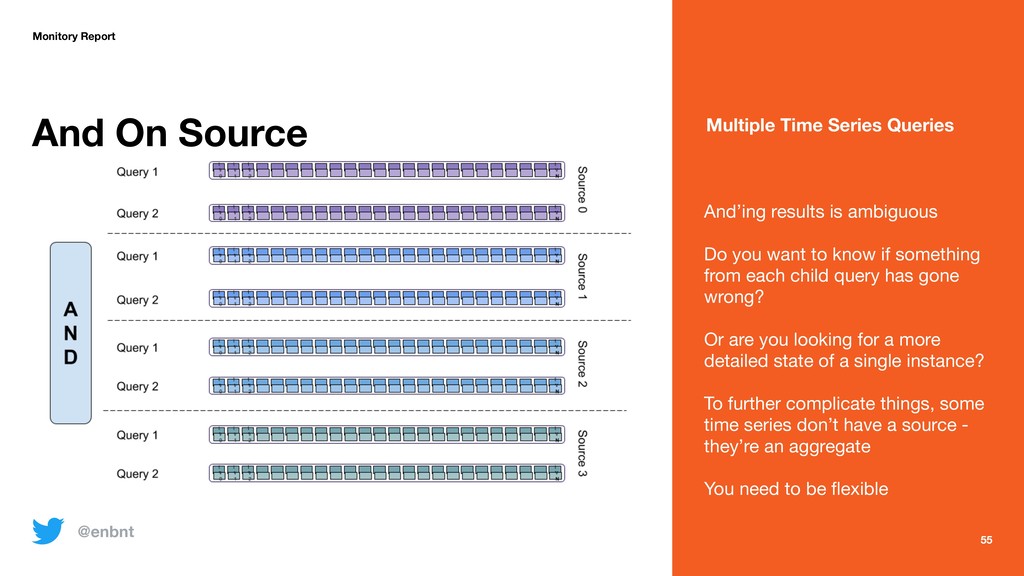
  34. 55 Monitory Report And On Source And’ing results is ambiguous

    Do you want to know if something from each child query has gone wrong? Or are you looking for a more detailed state of a single instance? To further complicate things, some time series don’t have a source - they’re an aggregate You need to be flexible Multiple Time Series Queries @enbnt
  35. 56 Monitory Report The Problem with Compound Monitors • Monitor

    definitions are vendor lock-in • They are directly tied to your queries • They live longer than your time series data • They change infrequently @enbnt
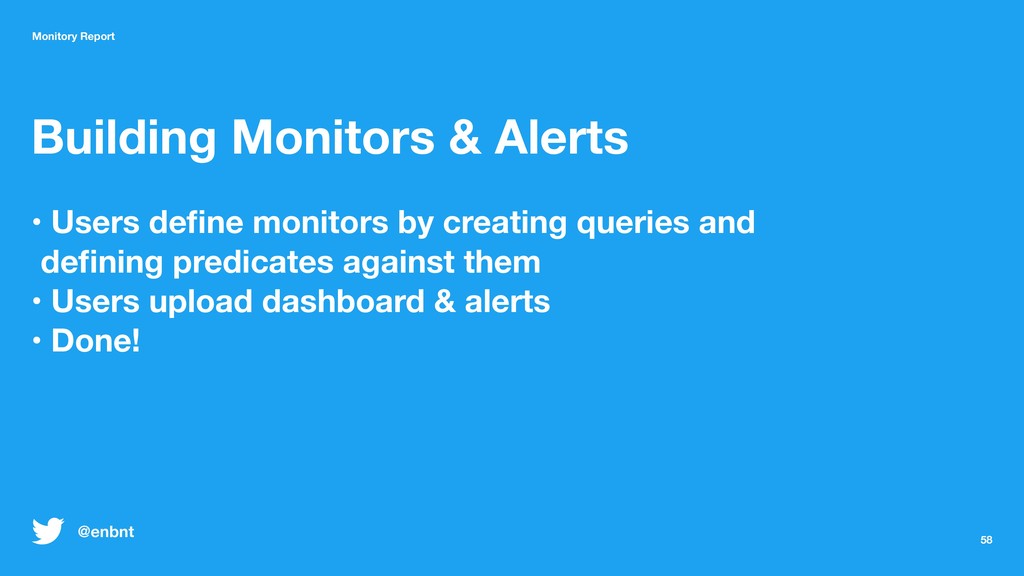
  36. 58 Monitory Report Building Monitors & Alerts • Users define

    monitors by creating queries and defining predicates against them • Users upload dashboard & alerts • Done! @enbnt
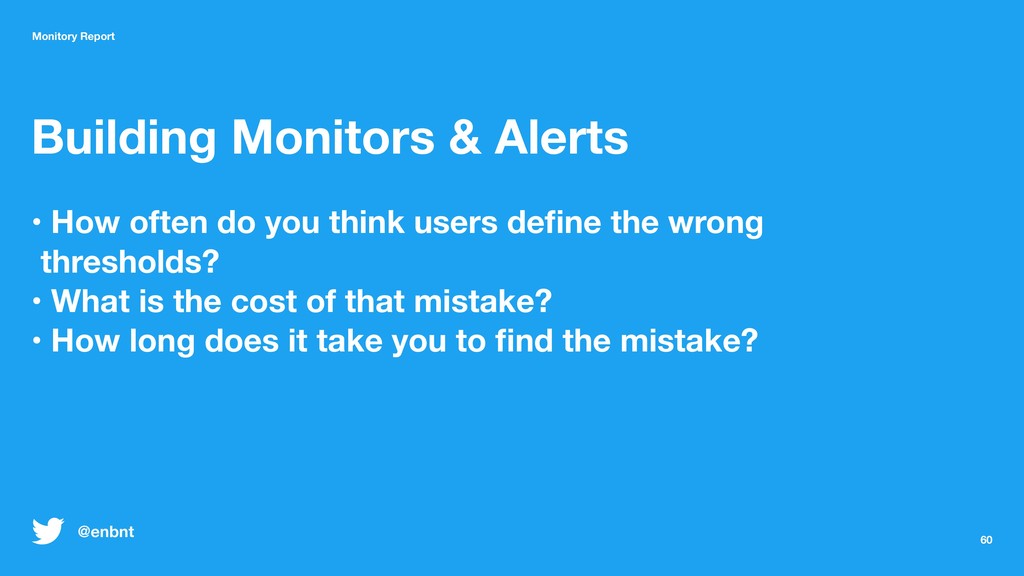
  37. 60 Monitory Report Building Monitors & Alerts • How often

    do you think users define the wrong thresholds? • What is the cost of that mistake? • How long does it take you to find the mistake? @enbnt
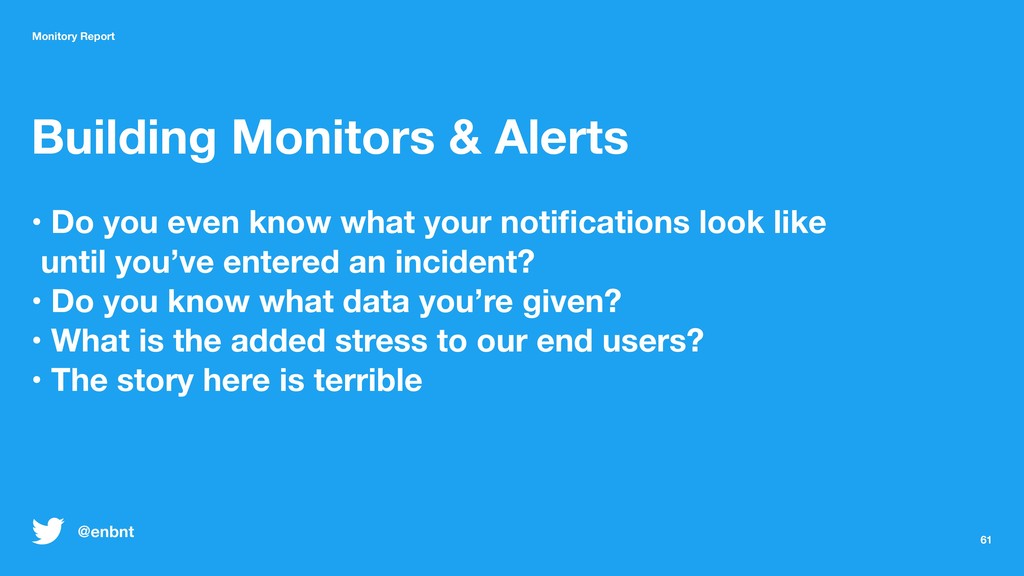
  38. 61 Monitory Report Building Monitors & Alerts • Do you

    even know what your notifications look like until you’ve entered an incident? • Do you know what data you’re given? • What is the added stress to our end users? • The story here is terrible @enbnt
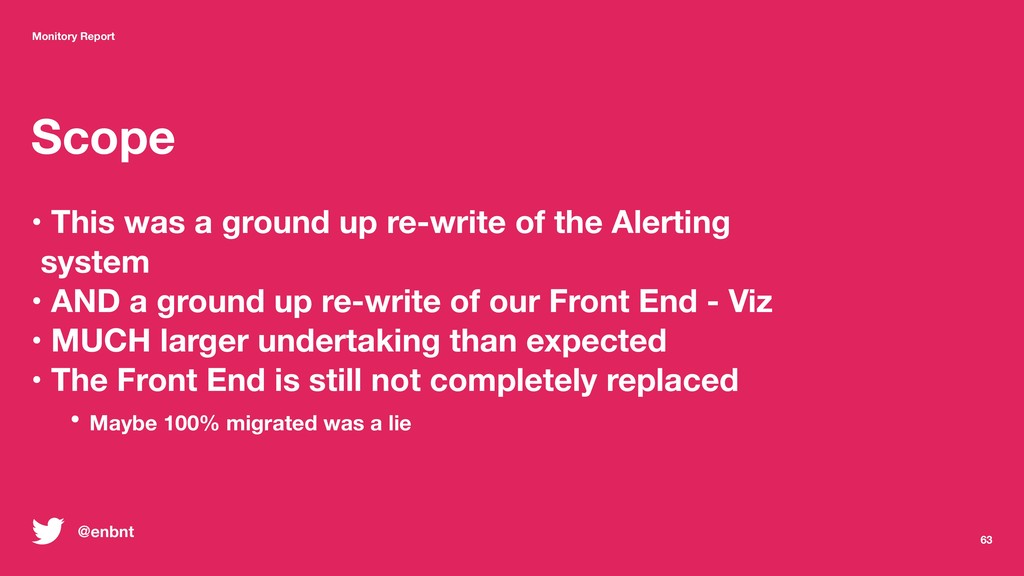
  39. 63 Monitory Report Scope • This was a ground up

    re-write of the Alerting system • AND a ground up re-write of our Front End - Viz • MUCH larger undertaking than expected • The Front End is still not completely replaced • Maybe 100% migrated was a lie @enbnt
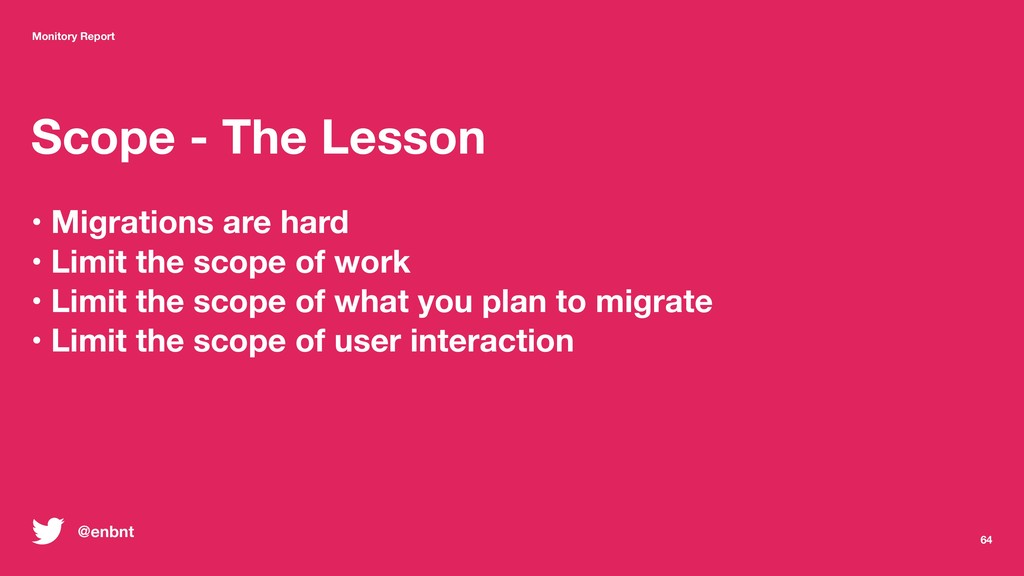
  40. 64 Monitory Report Scope - The Lesson • Migrations are

    hard • Limit the scope of work • Limit the scope of what you plan to migrate • Limit the scope of user interaction @enbnt
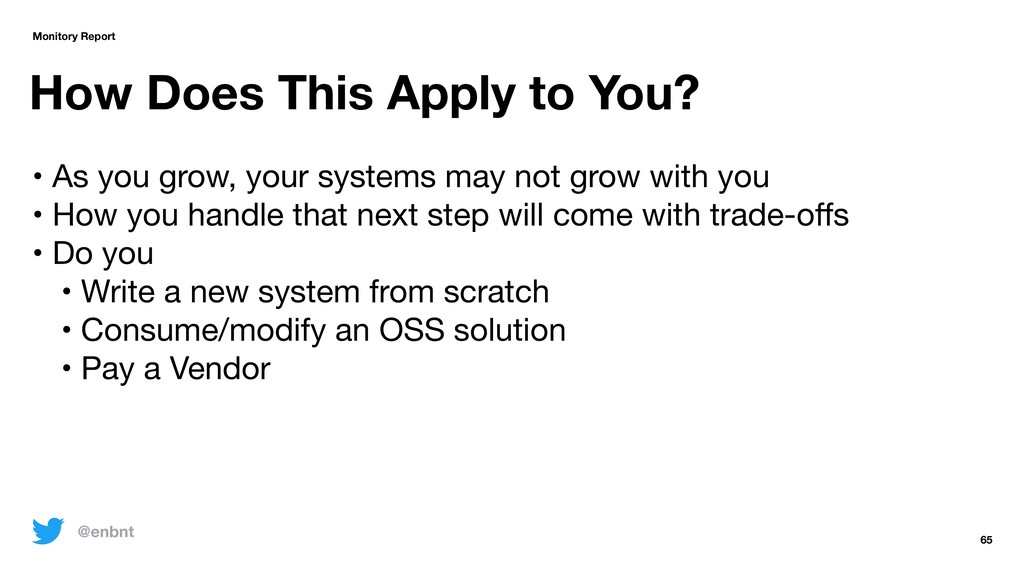
  41. How Does This Apply to You? 65 Monitory Report •

    As you grow, your systems may not grow with you • How you handle that next step will come with trade-offs • Do you • Write a new system from scratch • Consume/modify an OSS solution • Pay a Vendor @enbnt
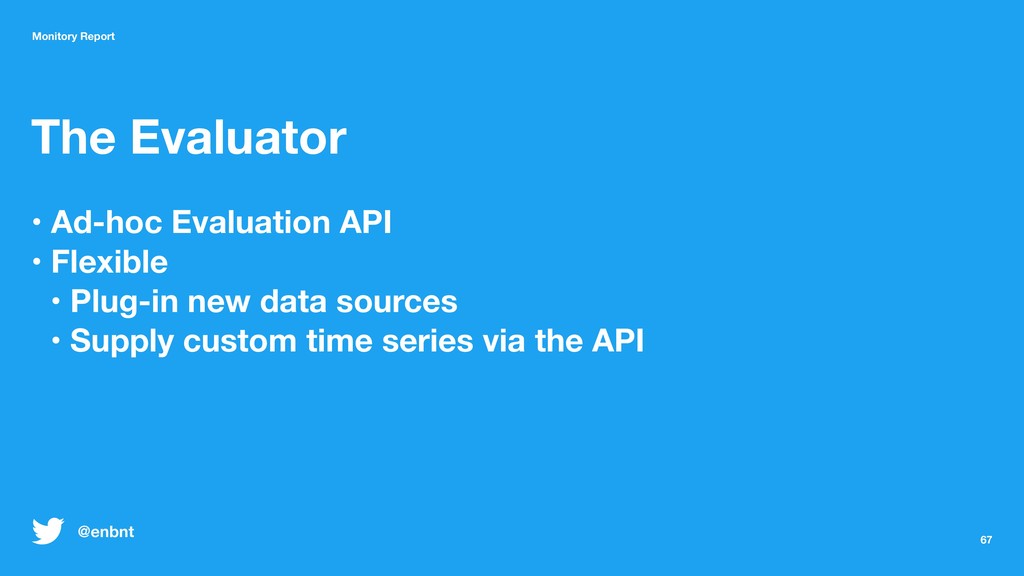
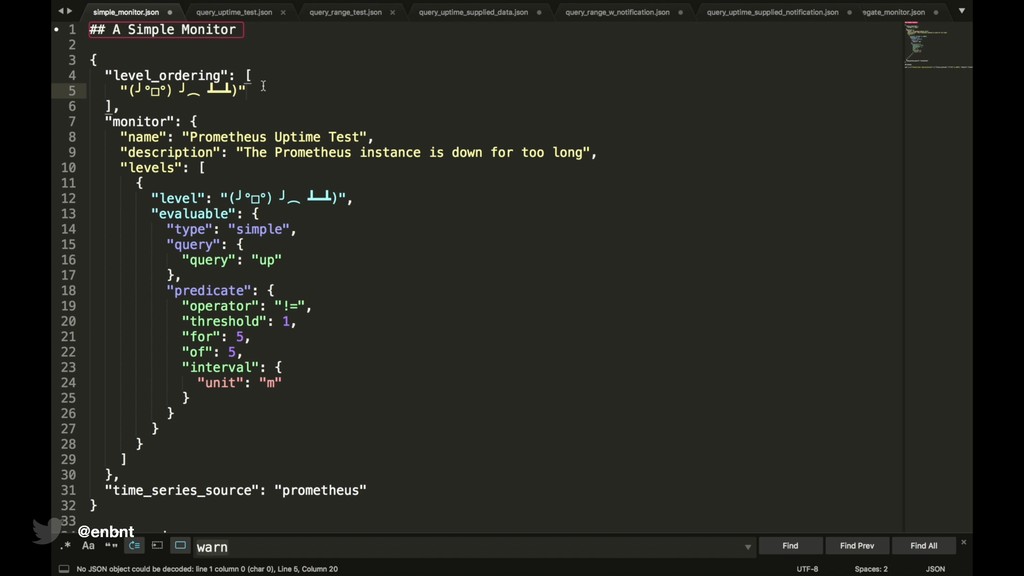
  42. 67 Monitory Report The Evaluator • Ad-hoc Evaluation API •

    Flexible • Plug-in new data sources • Supply custom time series via the API @enbnt
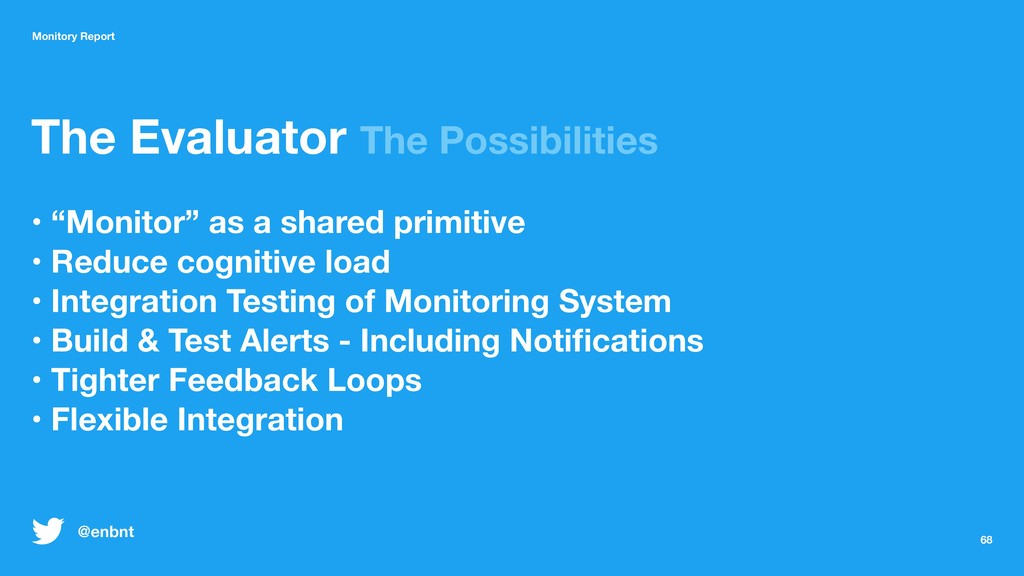
  43. 68 Monitory Report The Evaluator The Possibilities • “Monitor” as

    a shared primitive • Reduce cognitive load • Integration Testing of Monitoring System • Build & Test Alerts - Including Notifications • Tighter Feedback Loops • Flexible Integration @enbnt
  44. 74 1 2 3 4 5 Query Language Code as
    Config Incompatible Concepts Defining Monitors Scope Monitory Report @enbnt
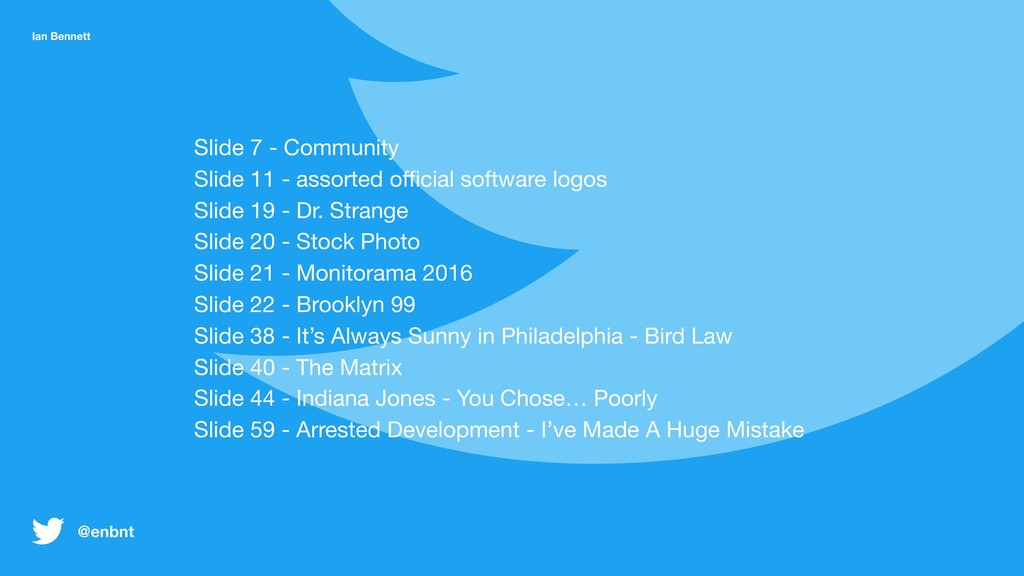
  45. Ian Bennett Slide 7 - Community Slide 11 - assorted

    official software logos Slide 19 - Dr. Strange Slide 20 - Stock Photo Slide 21 - Monitorama 2016 Slide 22 - Brooklyn 99 Slide 38 - It’s Always Sunny in Philadelphia - Bird Law Slide 40 - The Matrix Slide 44 - Indiana Jones - You Chose… Poorly Slide 59 - Arrested Development - I’ve Made A Huge Mistake @enbnt