Energize Vermont's Clean Energy Plan (Winter 2013)
Energize Vermont's Clean Energy Plan charts a path to more renewable sources of electricity generation in the State of Vermont. The plan emphasizes the highest potential, lowest impact resources for the state.
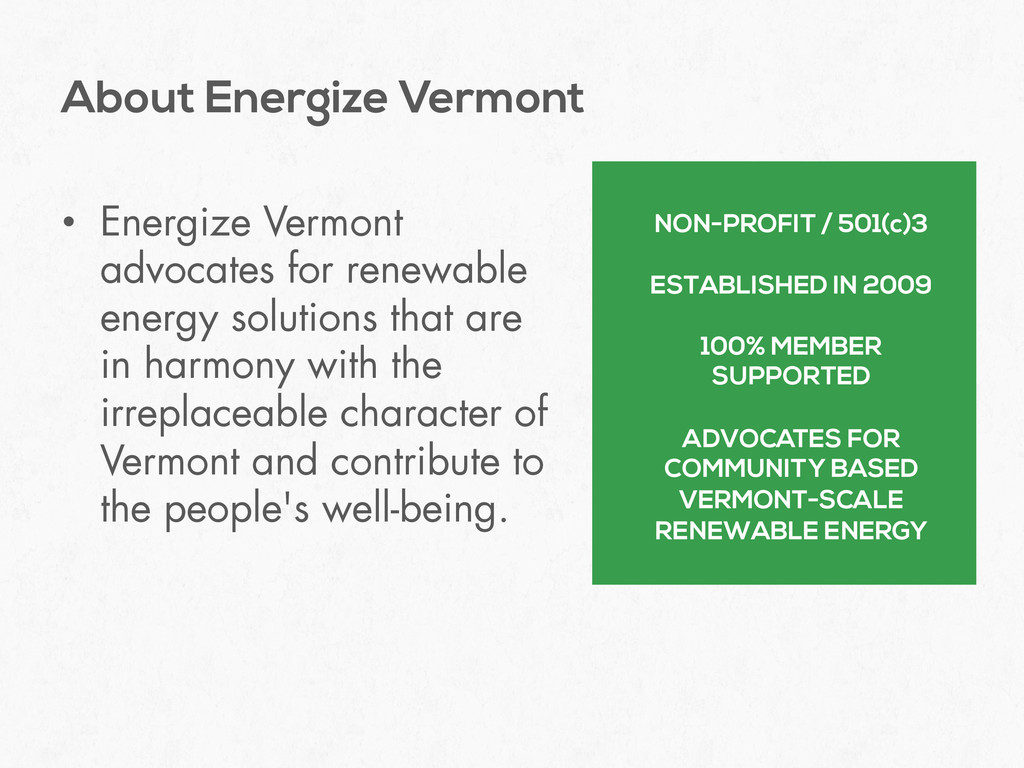
in harmony with the irreplaceable character of Vermont and contribute to the people's well-being. About Energize Vermont NON-PROFIT / 501(c)3 ESTABLISHED IN 2009 100% MEMBER SUPPORTED ADVOCATES FOR COMMUNITY BASED VERMONT-SCALE RENEWABLE ENERGY
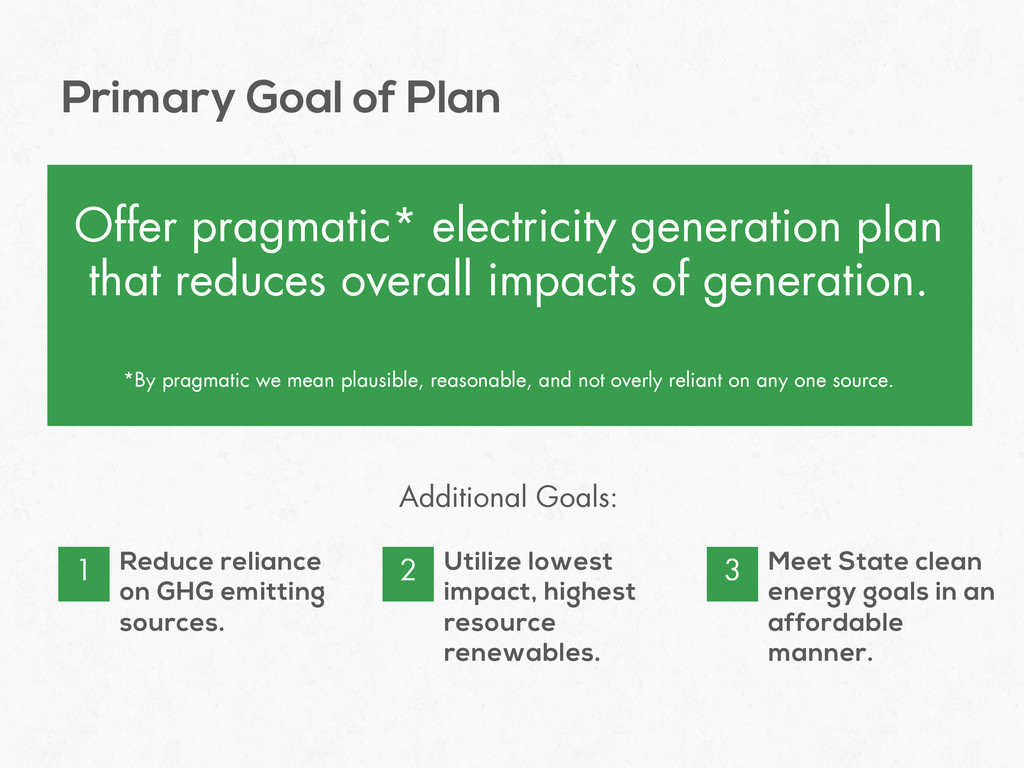
generation. *By pragmatic we mean plausible, reasonable, and not overly reliant on any one source. Additional Goals: Primary Goal of Plan Reduce reliance on GHG emitting sources. Utilize lowest impact, highest resource renewables. Meet State clean energy goals in an affordable manner. 3 2 1
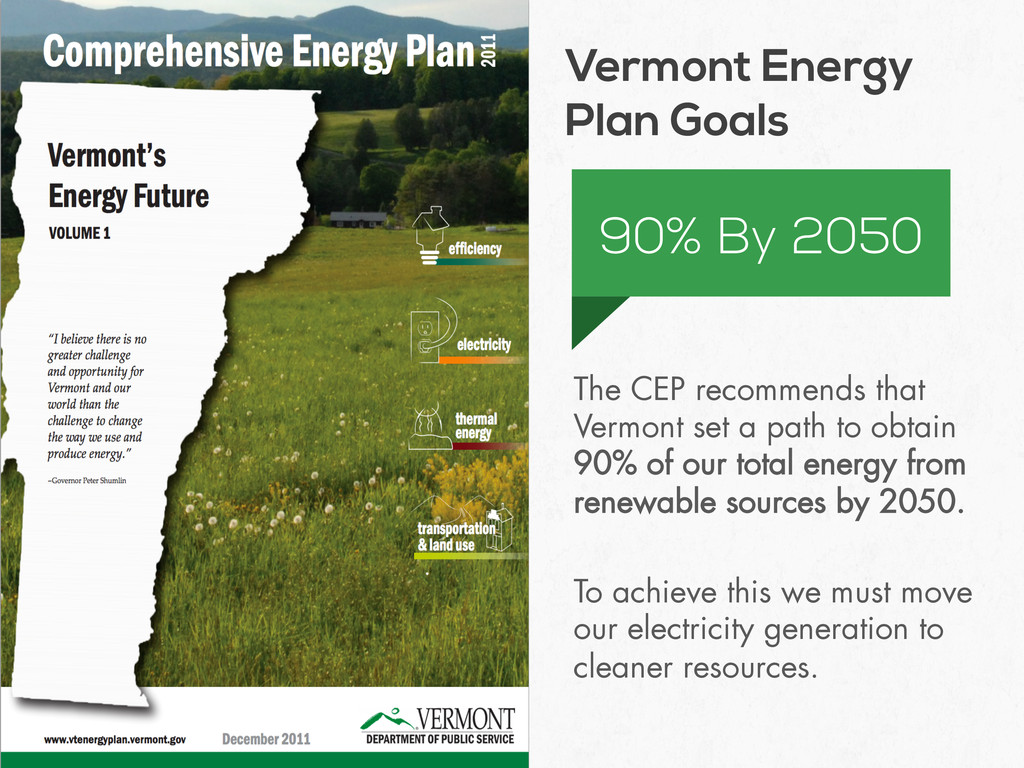
a path to obtain 90% of our total energy from renewable sources by 2050. To achieve this we must move our electricity generation to cleaner resources. 90% By 2050
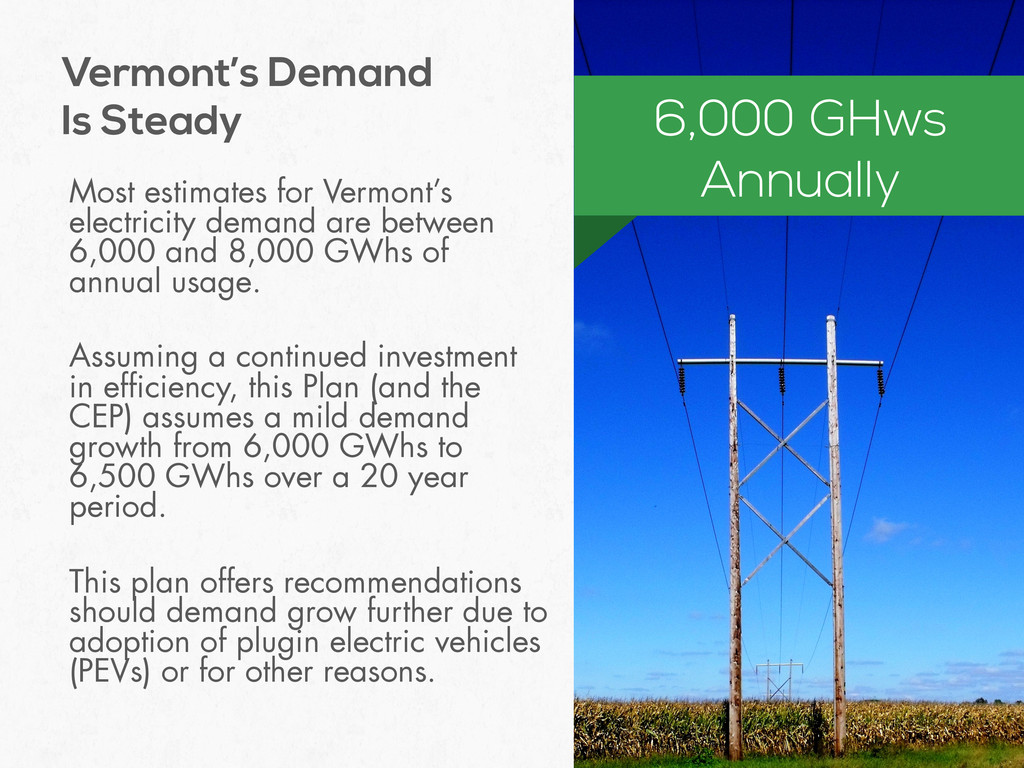
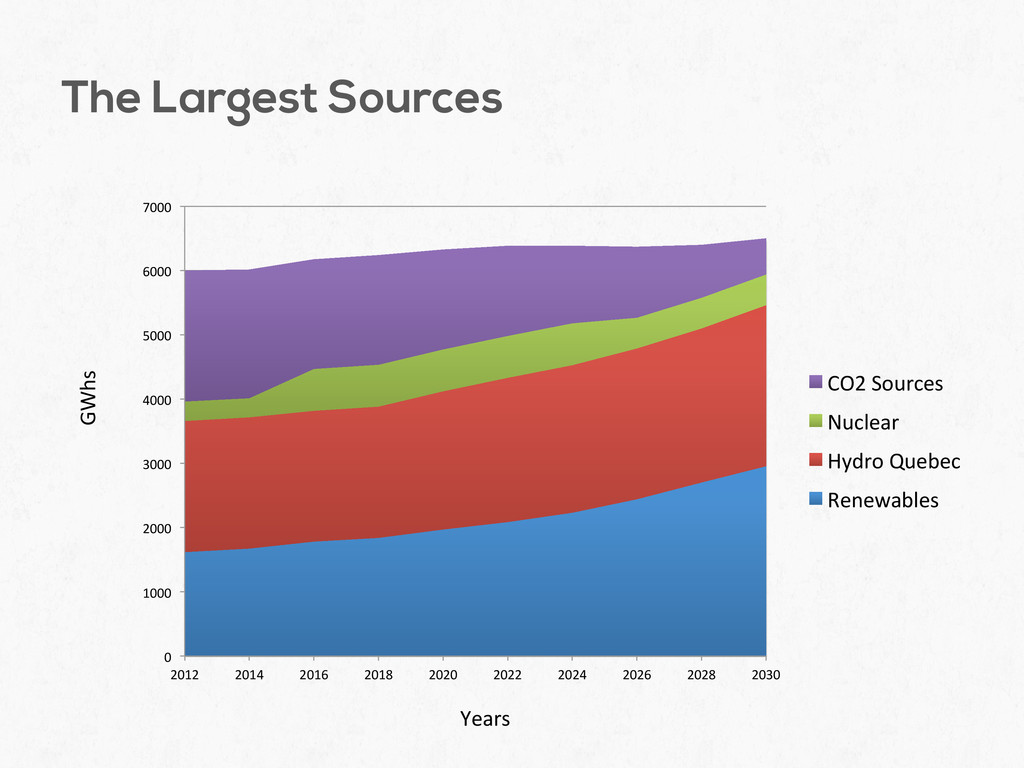
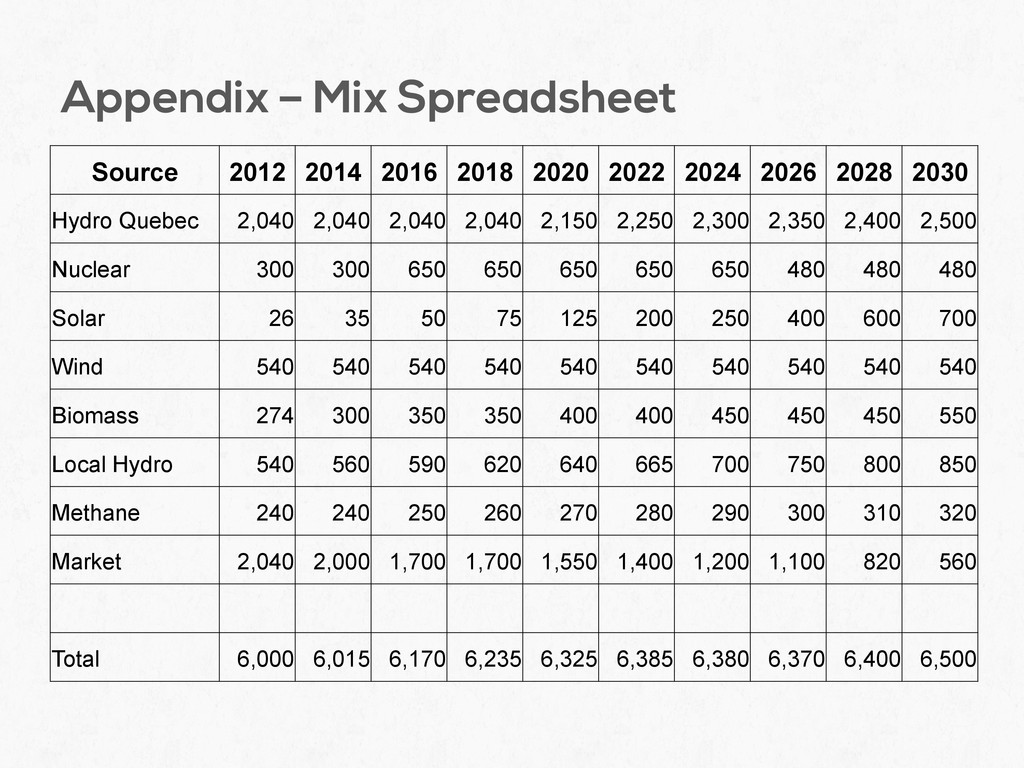
8,000 GWhs of annual usage. Assuming a continued investment in efficiency, this Plan (and the CEP) assumes a mild demand growth from 6,000 GWhs to 6,500 GWhs over a 20 year period. This plan offers recommendations should demand grow further due to adoption of plugin electric vehicles (PEVs) or for other reasons. Vermont’s Demand Is Steady 6,000 GHws Annually
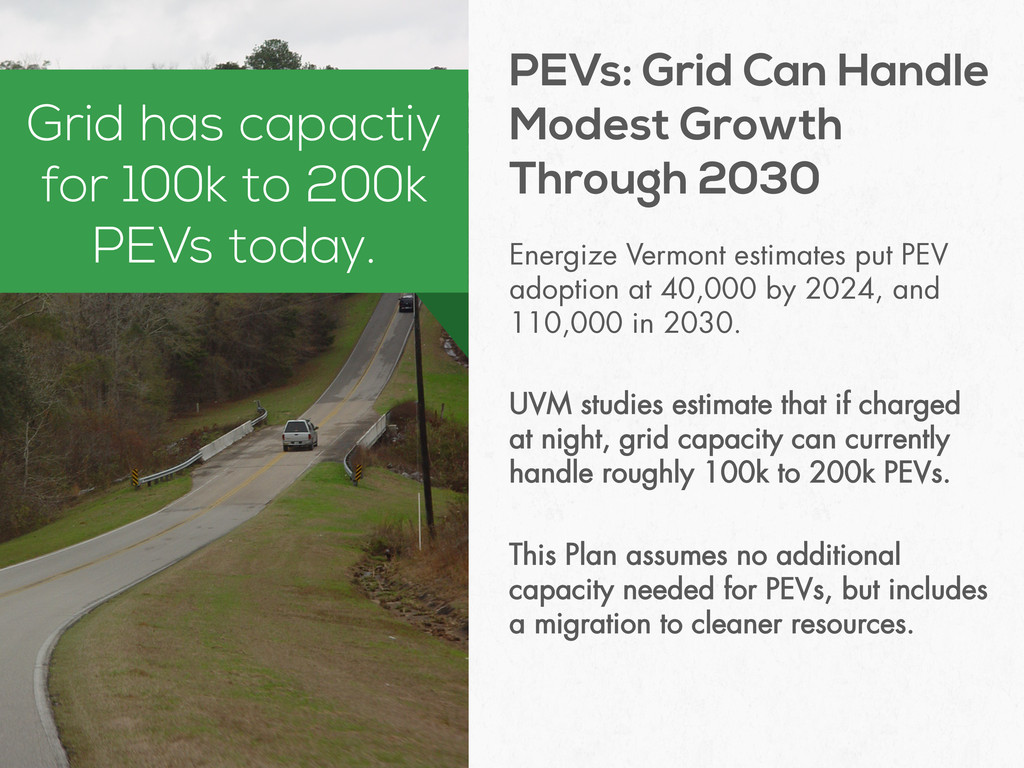
and 110,000 in 2030. UVM studies estimate that if charged at night, grid capacity can currently handle roughly 100k to 200k PEVs. This Plan assumes no additional capacity needed for PEVs, but includes a migration to cleaner resources. PEVs: Grid Can Handle Modest Growth Through 2030 Grid has capactiy for 100k to 200k PEVs today.
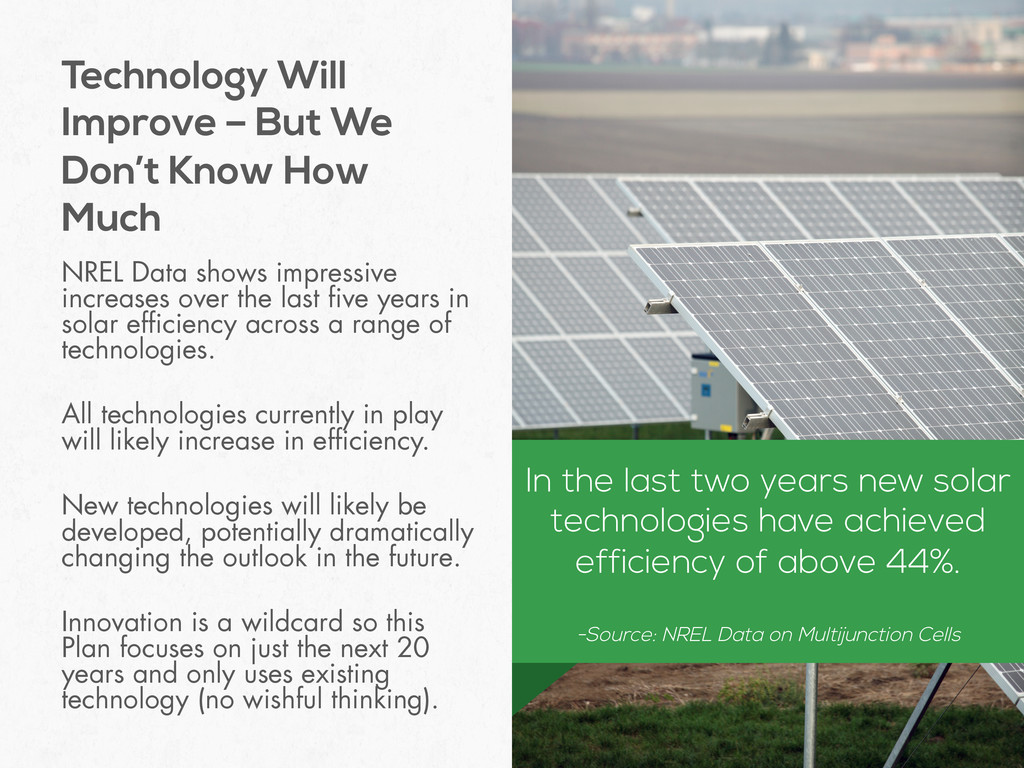
in solar efficiency across a range of technologies. All technologies currently in play will likely increase in efficiency. New technologies will likely be developed, potentially dramatically changing the outlook in the future. Innovation is a wildcard so this Plan focuses on just the next 20 years and only uses existing technology (no wishful thinking). Technology Will Improve – But We Don’t Know How Much In the last two years new solar technologies have achieved efficiency of above 44%. -Source: NREL Data on Multijunction Cells
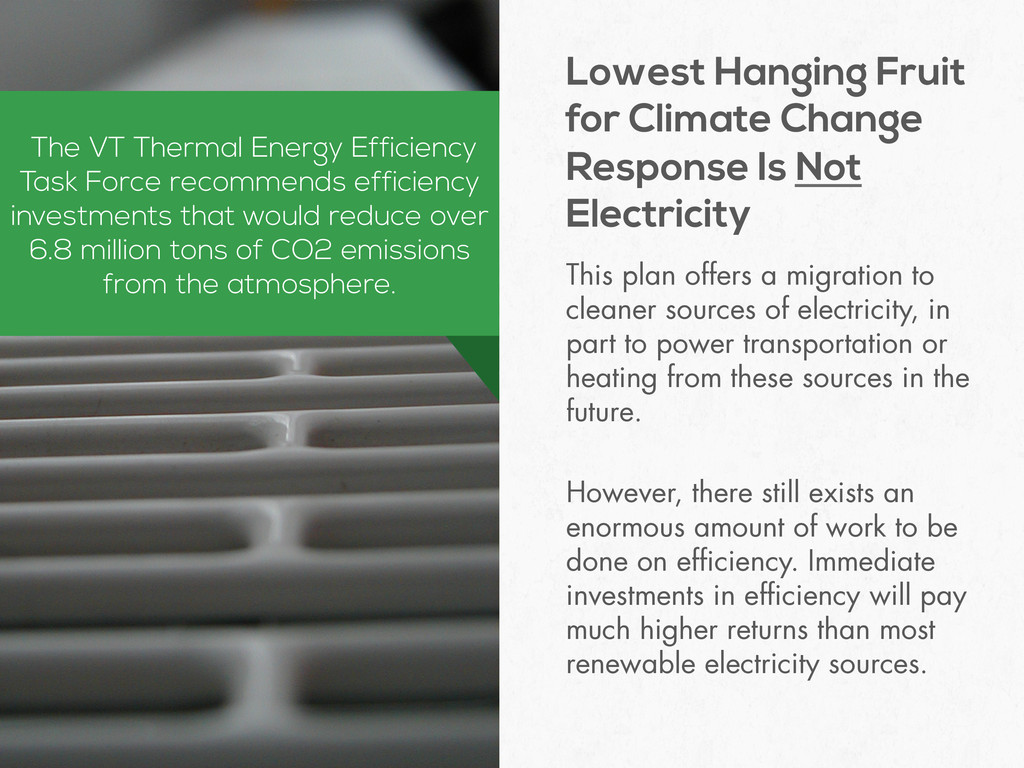
in part to power transportation or heating from these sources in the future. However, there still exists an enormous amount of work to be done on efficiency. Immediate investments in efficiency will pay much higher returns than most renewable electricity sources. Lowest Hanging Fruit for Climate Change Response Is Not Electricity The VT Thermal Energy Efficiency Task Force recommends efficiency investments that would reduce over 6.8 million tons of CO2 emissions from the atmosphere.
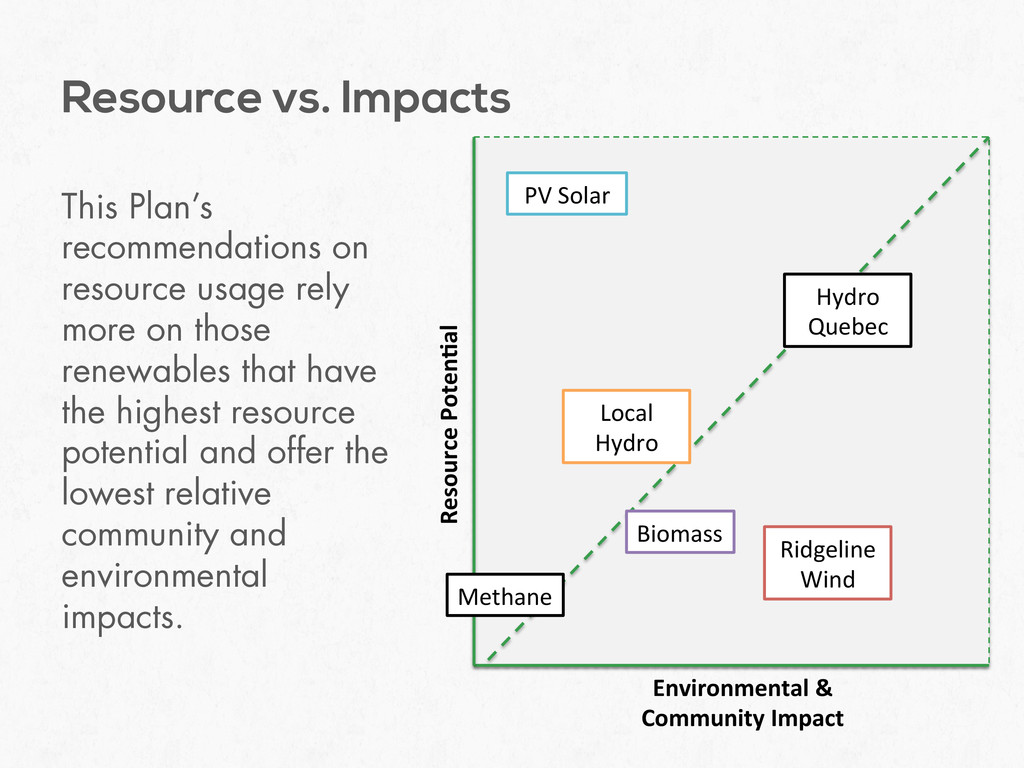
renewables that have the highest resource potential and offer the lowest relative community and environmental impacts. Resource vs. Impacts Environmental & Community Impact Resource Poten<al PV Solar Ridgeline Wind Hydro Quebec Local Hydro Methane Biomass
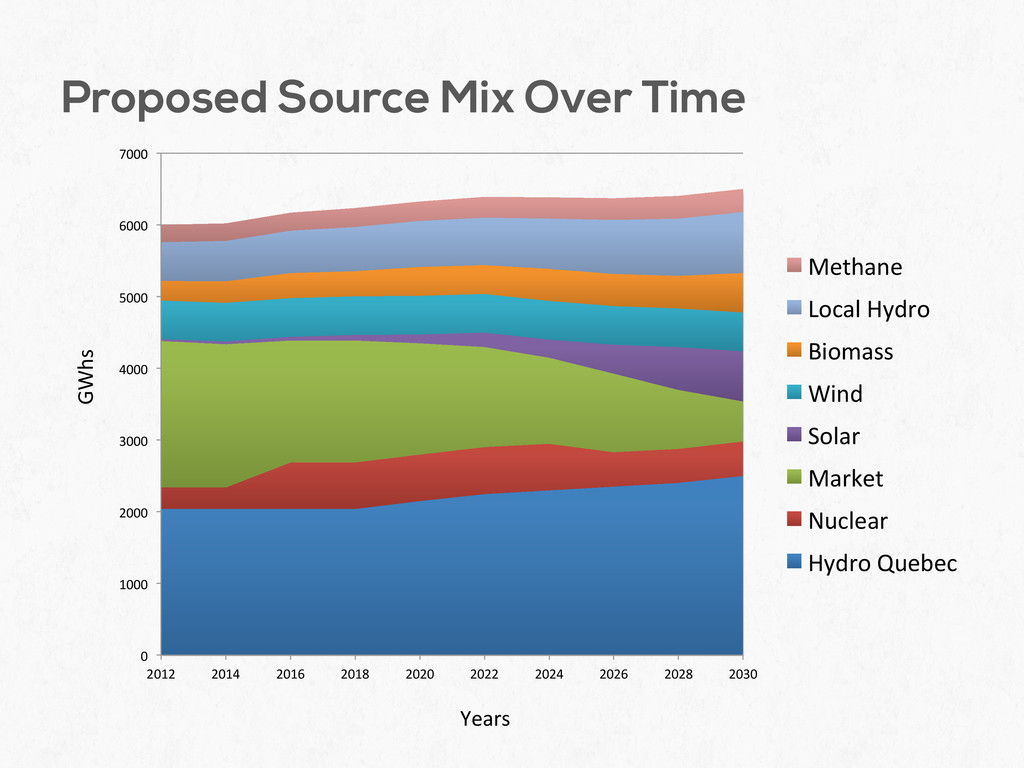
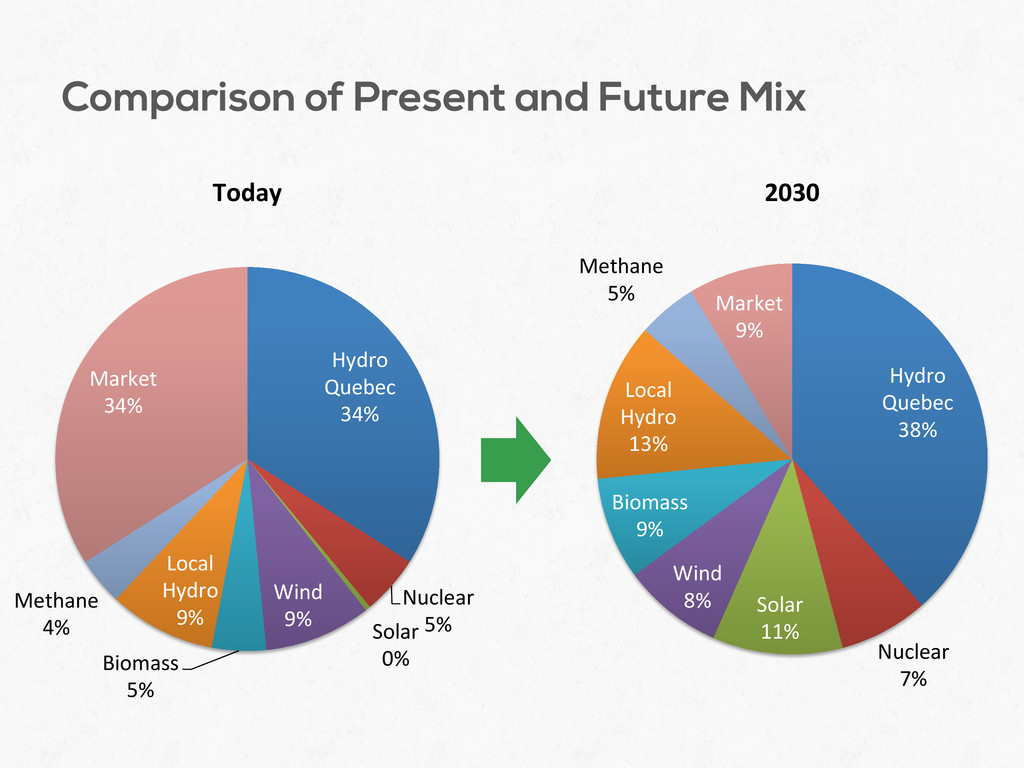
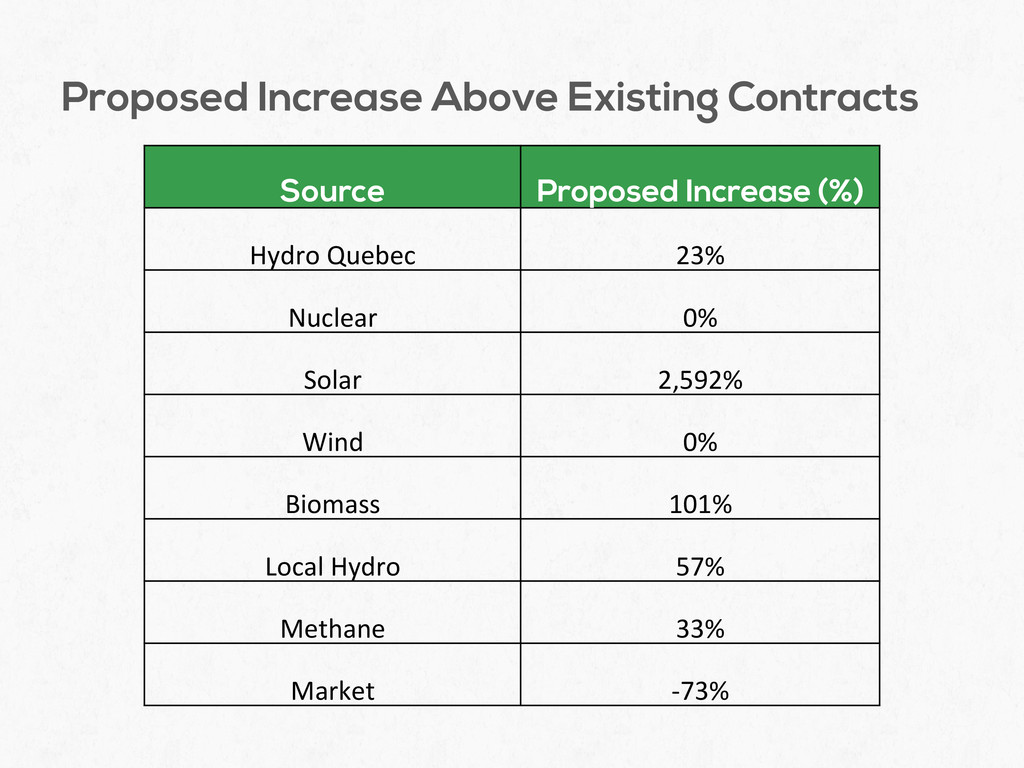
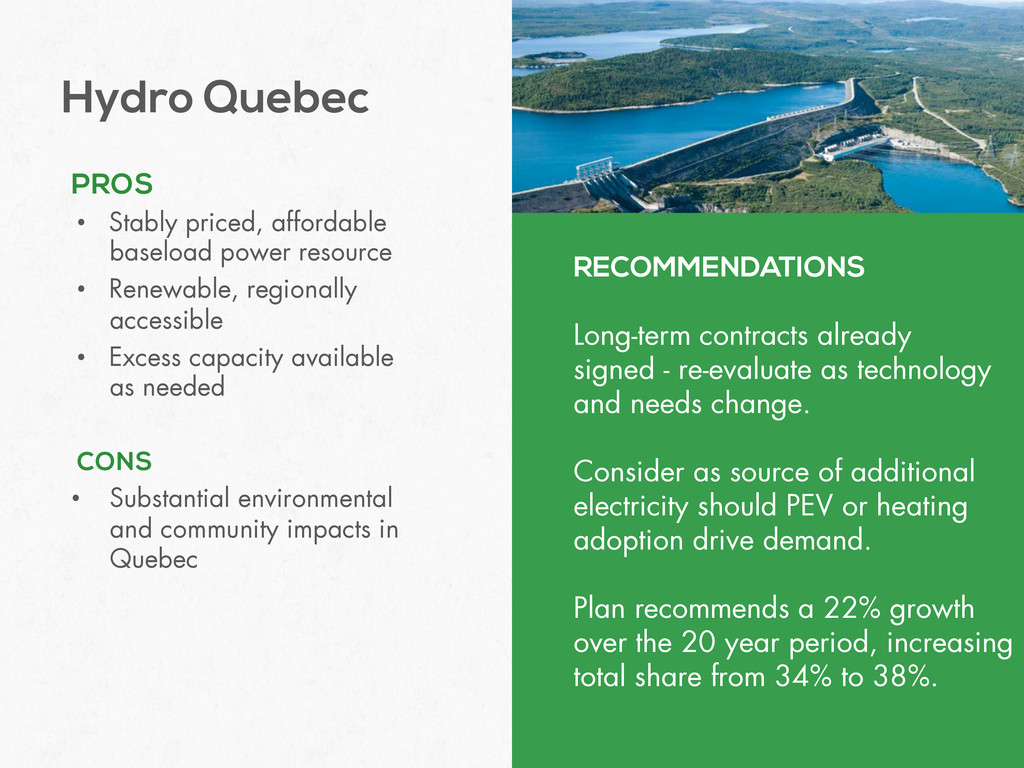
• Renewable, regionally accessible • Excess capacity available as needed CONS • Substantial environmental and community impacts in Quebec RECOMMENDATIONS Long-term contracts already signed - re-evaluate as technology and needs change. Consider as source of additional electricity should PEV or heating adoption drive demand. Plan recommends a 22% growth over the 20 year period, increasing total share from 34% to 38%.
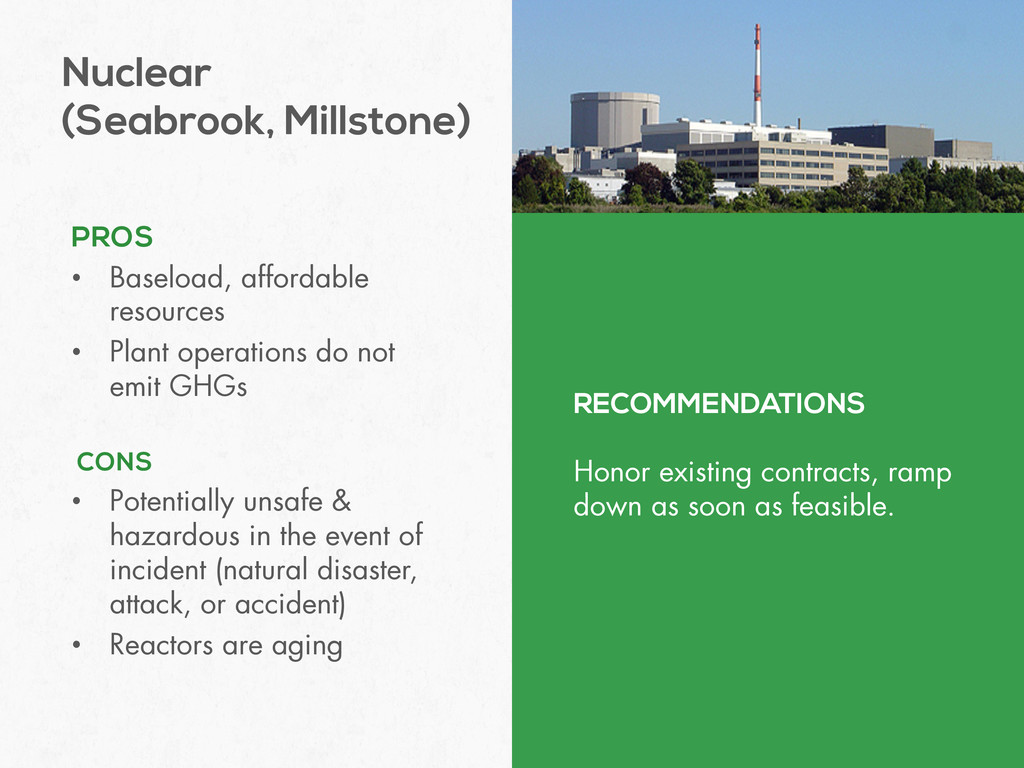
operations do not emit GHGs CONS • Potentially unsafe & hazardous in the event of incident (natural disaster, attack, or accident) • Reactors are aging RECOMMENDATIONS Honor existing contracts, ramp down as soon as feasible.
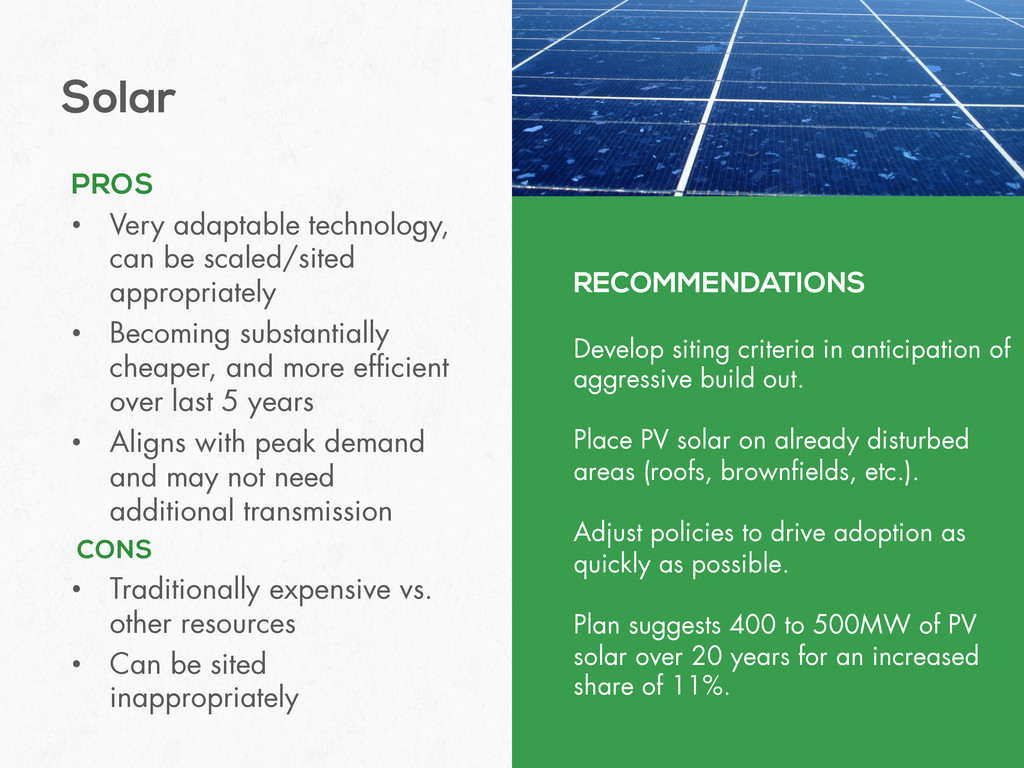
• Becoming substantially cheaper, and more efficient over last 5 years • Aligns with peak demand and may not need additional transmission CONS • Traditionally expensive vs. other resources • Can be sited inappropriately RECOMMENDATIONS Develop siting criteria in anticipation of aggressive build out. Place PV solar on already disturbed areas (roofs, brownfields, etc.). Adjust policies to drive adoption as quickly as possible. Plan suggests 400 to 500MW of PV solar over 20 years for an increased share of 11%.
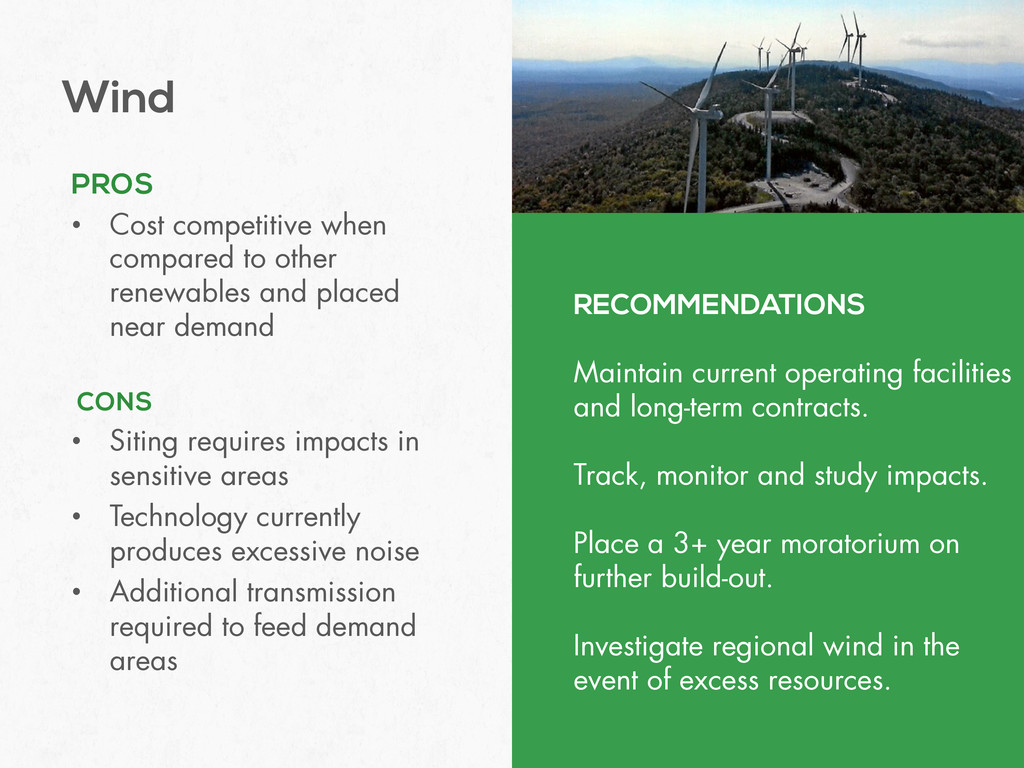
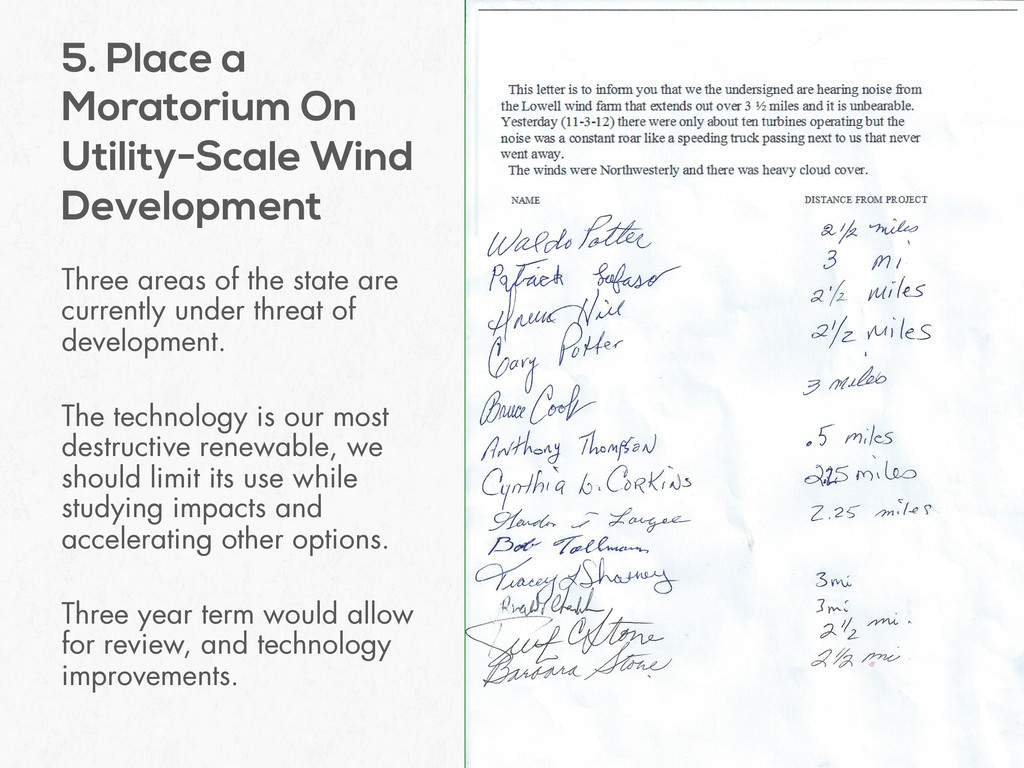
and placed near demand CONS • Siting requires impacts in sensitive areas • Technology currently produces excessive noise • Additional transmission required to feed demand areas RECOMMENDATIONS Maintain current operating facilities and long-term contracts. Track, monitor and study impacts. Place a 3+ year moratorium on further build-out. Investigate regional wind in the event of excess resources.
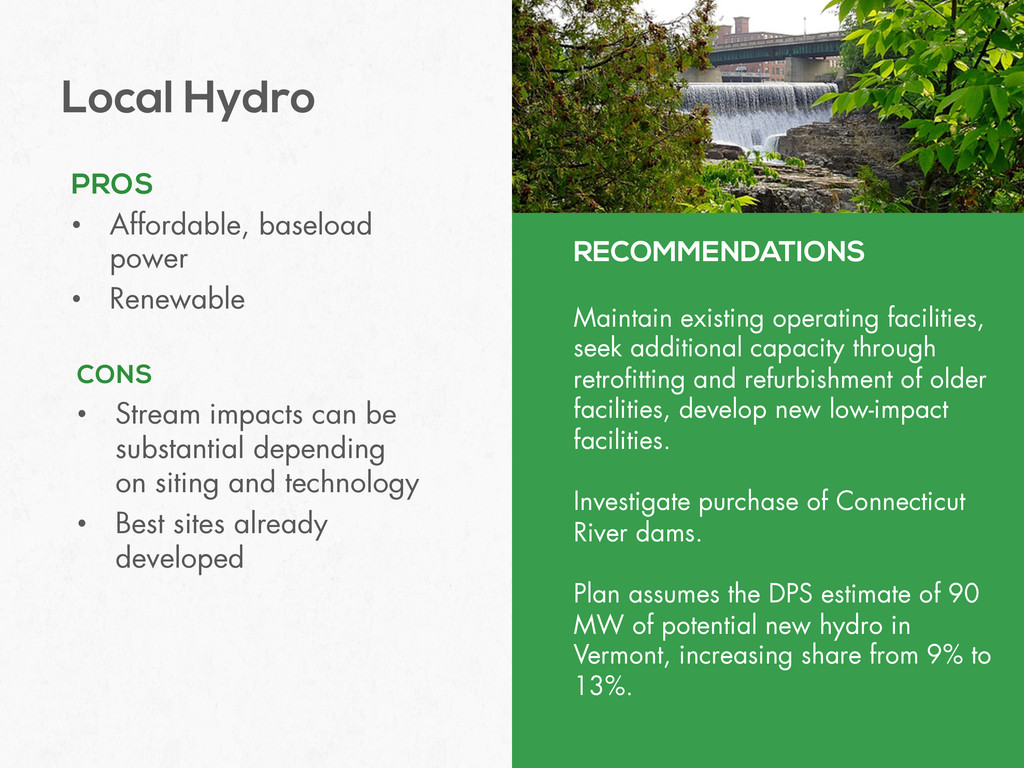
• Stream impacts can be substantial depending on siting and technology • Best sites already developed RECOMMENDATIONS Maintain existing operating facilities, seek additional capacity through retrofitting and refurbishment of older facilities, develop new low-impact facilities. Investigate purchase of Connecticut River dams. Plan assumes the DPS estimate of 90 MW of potential new hydro in Vermont, increasing share from 9% to 13%.
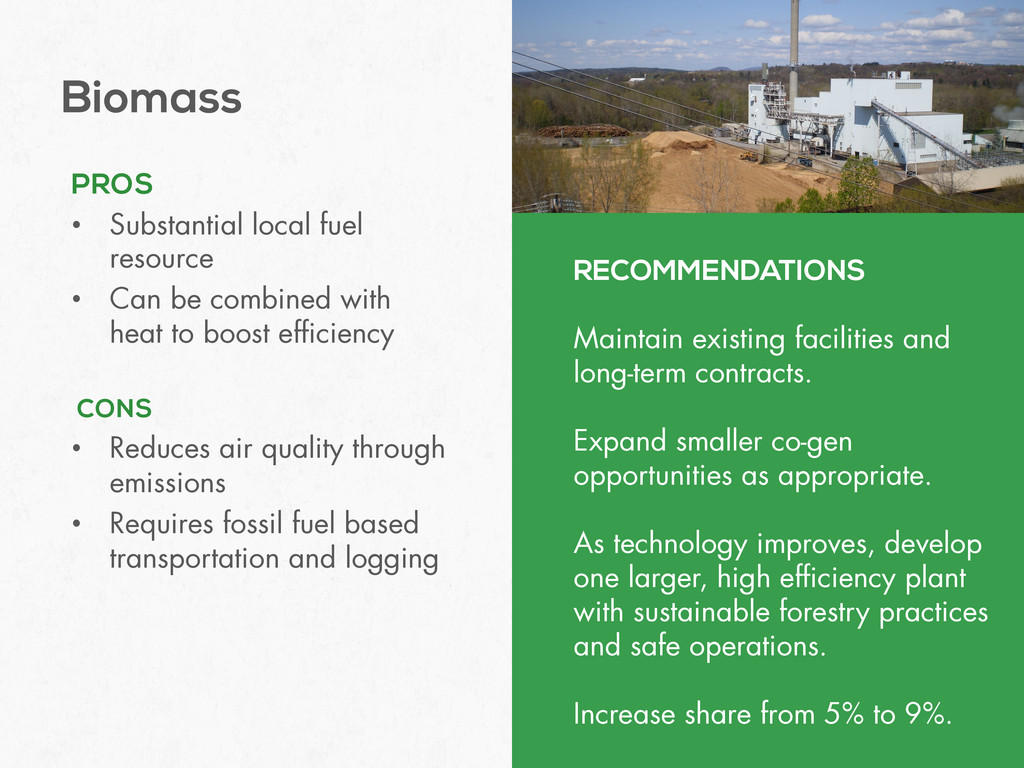
combined with heat to boost efficiency CONS • Reduces air quality through emissions • Requires fossil fuel based transportation and logging RECOMMENDATIONS Maintain existing facilities and long-term contracts. Expand smaller co-gen opportunities as appropriate. As technology improves, develop one larger, high efficiency plant with sustainable forestry practices and safe operations. Increase share from 5% to 9%.
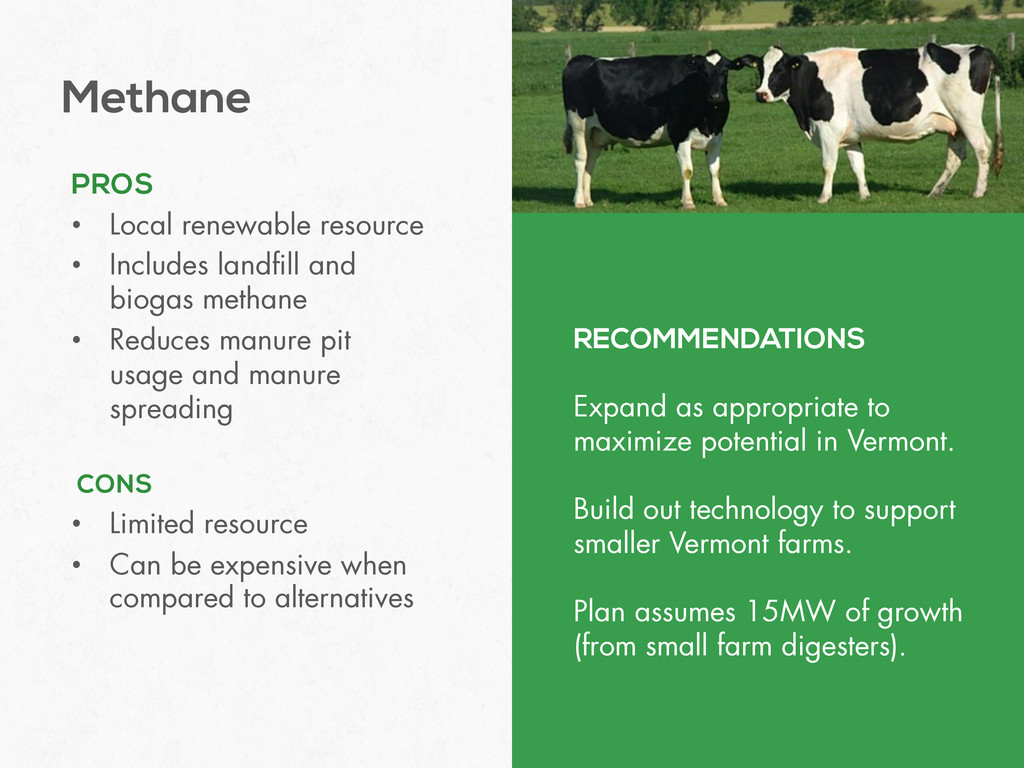
biogas methane • Reduces manure pit usage and manure spreading CONS • Limited resource • Can be expensive when compared to alternatives RECOMMENDATIONS Expand as appropriate to maximize potential in Vermont. Build out technology to support smaller Vermont farms. Plan assumes 15MW of growth (from small farm digesters).
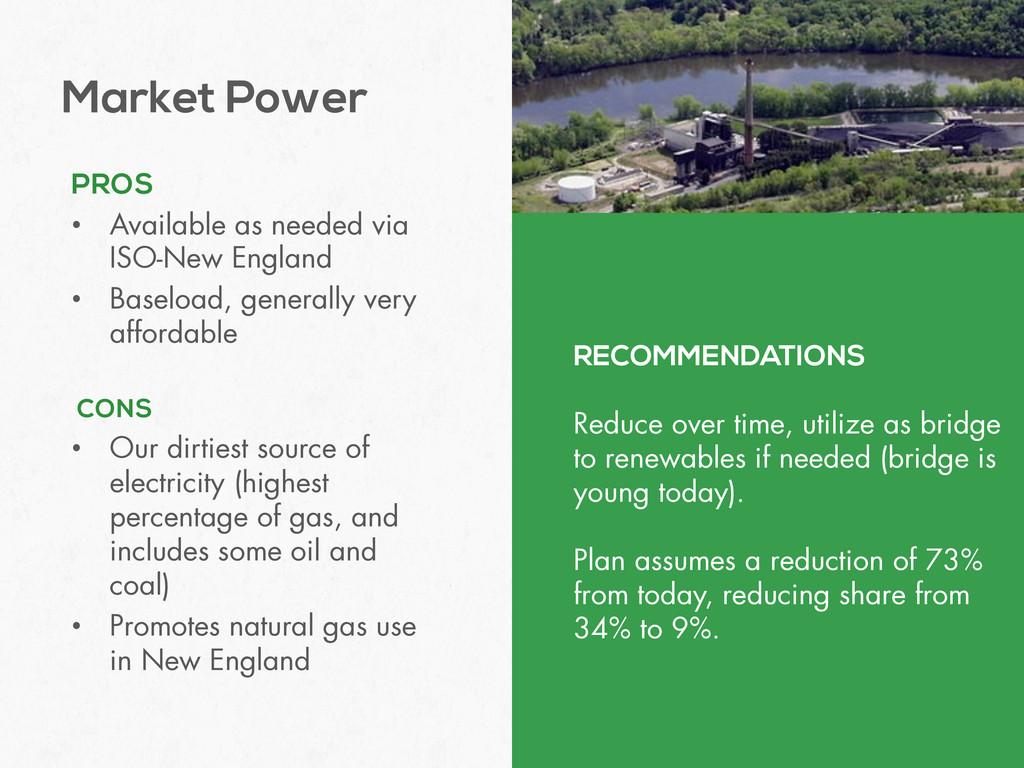
• Baseload, generally very affordable CONS • Our dirtiest source of electricity (highest percentage of gas, and includes some oil and coal) • Promotes natural gas use in New England RECOMMENDATIONS Reduce over time, utilize as bridge to renewables if needed (bridge is young today). Plan assumes a reduction of 73% from today, reducing share from 34% to 9%.
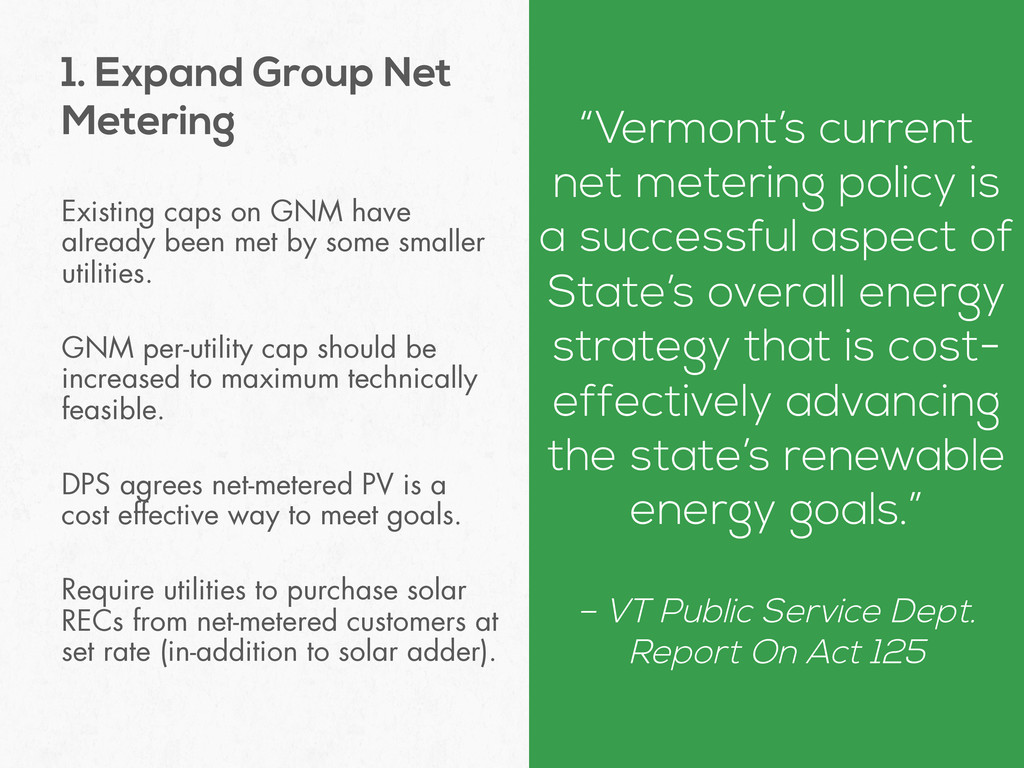
smaller utilities. GNM per-utility cap should be increased to maximum technically feasible. DPS agrees net-metered PV is a cost effective way to meet goals. Require utilities to purchase solar RECs from net-metered customers at set rate (in-addition to solar adder). 1. Expand Group Net Metering “Vermont’s current net metering policy is a successful aspect of State’s overall energy strategy that is cost- effectively advancing the state’s renewable energy goals.” – VT Public Service Dept. Report On Act 125
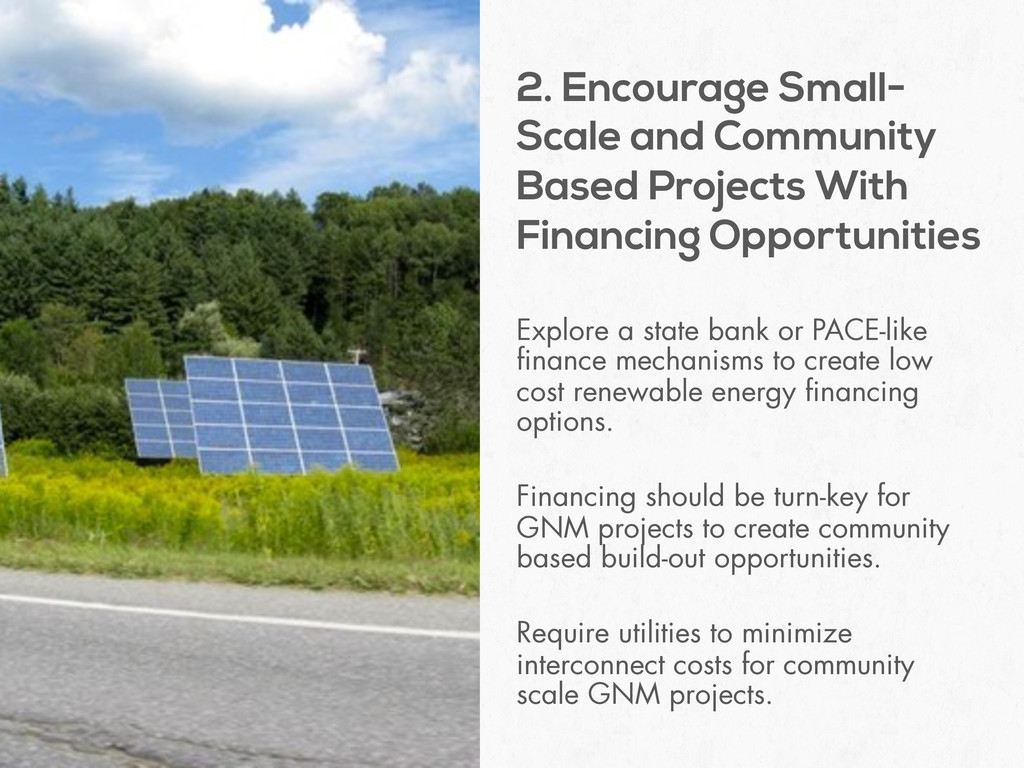
low cost renewable energy financing options. Financing should be turn-key for GNM projects to create community based build-out opportunities. Require utilities to minimize interconnect costs for community scale GNM projects. 2. Encourage Small- Scale and Community Based Projects With Financing Opportunities
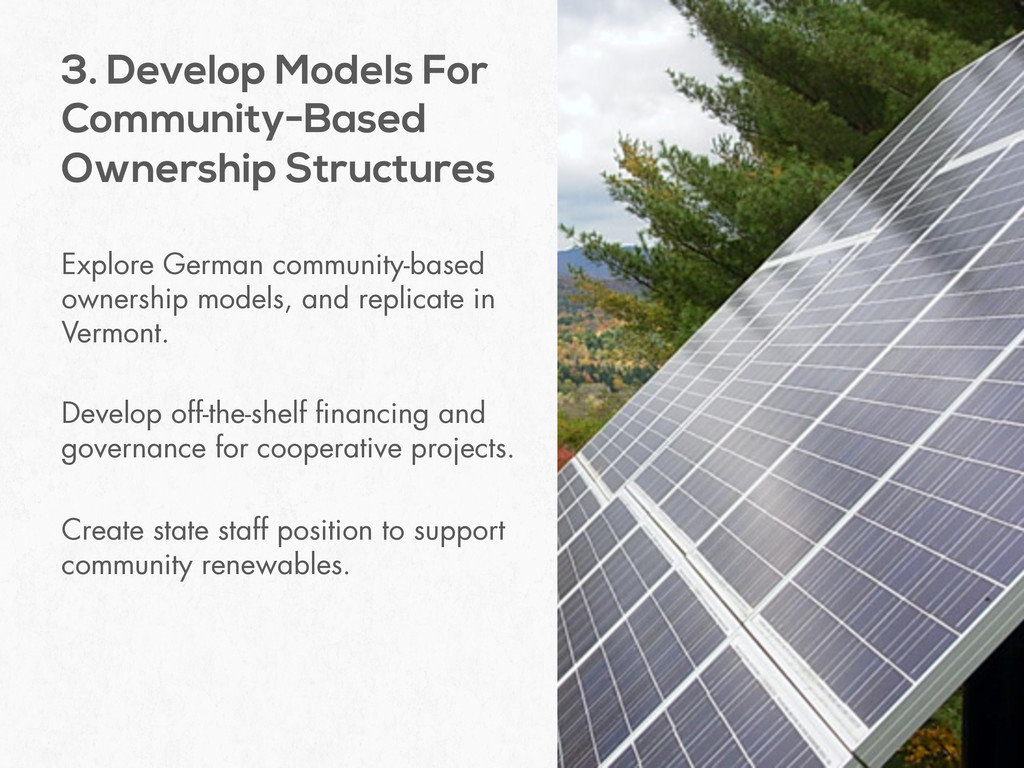
off-the-shelf financing and governance for cooperative projects. Create state staff position to support community renewables. 3. Develop Models For Community-Based Ownership Structures
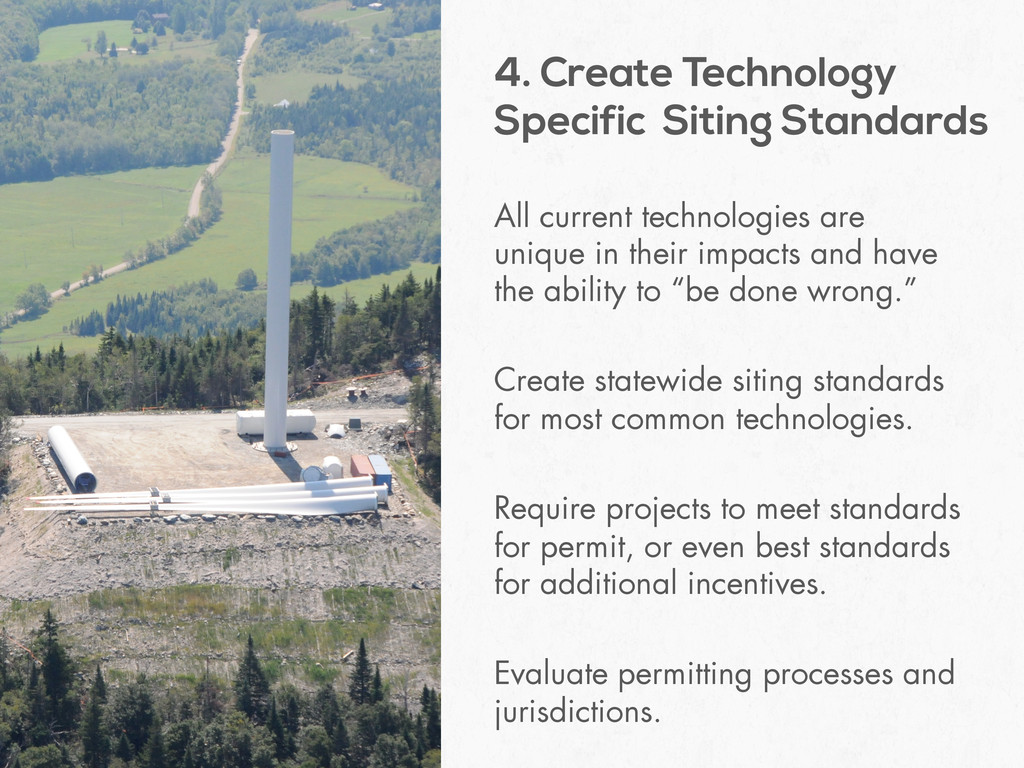
the ability to “be done wrong.” Create statewide siting standards for most common technologies. Require projects to meet standards for permit, or even best standards for additional incentives. Evaluate permitting processes and jurisdictions. 4. Create Technology Specific Siting Standards
development. The technology is our most destructive renewable, we should limit its use while studying impacts and accelerating other options. Three year term would allow for review, and technology improvements. 5. Place a Moratorium On Utility-Scale Wind Development
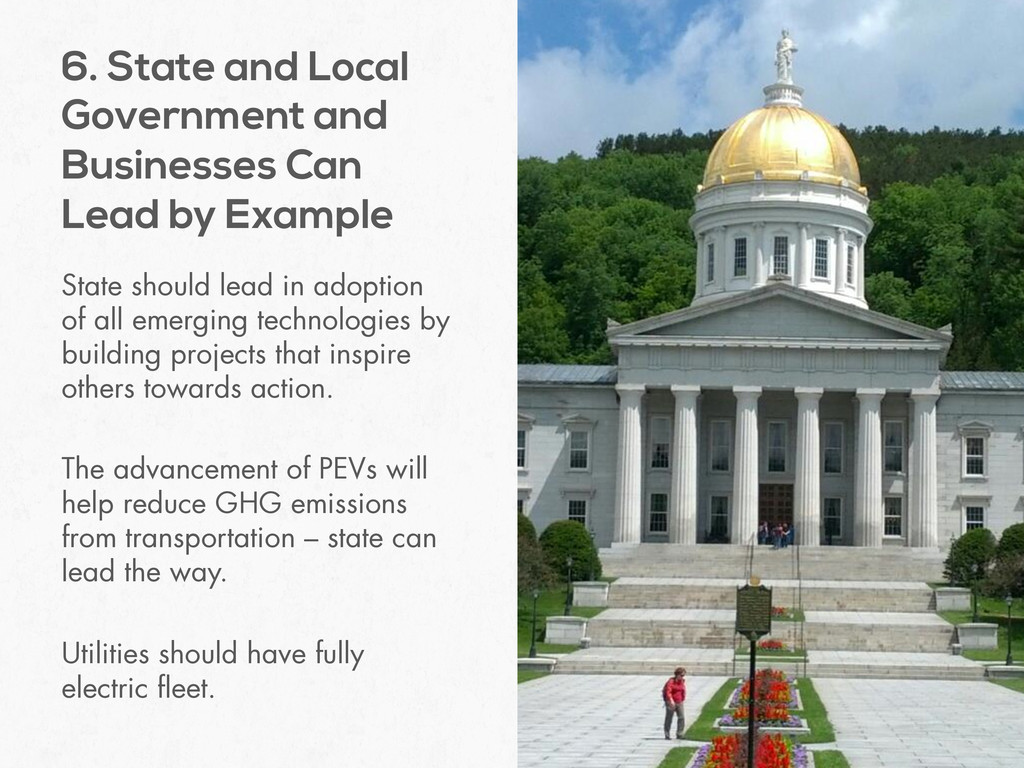
building projects that inspire others towards action. The advancement of PEVs will help reduce GHG emissions from transportation – state can lead the way. Utilities should have fully electric fleet. 6. State and Local Government and Businesses Can Lead by Example
![PO Box 605 Rutland, VT 05702 (802) 778-0660 www.EnergizeVermont.org [email protected]](https://files.speakerdeck.com/presentations/75c253104ec701307d291231381548c0/slide_32.jpg)