Upgrade to Pro — share decks privately, control downloads, hide ads and more …

Metrics are money

Metrics are money

In I.T. we all use all kinds of metrics. Operations teams rely heavily on these, especially when things go south. These metrics are sometimes overrated. Let’s dive into a few real life stories together.

Aurélien Rougemont, Synthesio

Kernel Recipes

December 22, 2021
Tweet

More Decks by Kernel Recipes

Other Decks in Technology

Transcript

  1. whoami(1) 40 years old nerd Been pushing buttons on a

    C64 since i was 9 opensource software user since 1996 ( slackware 3.1 ) Hacked kernel code for the first time in 1999 (ISDN modem) Wrote a few patches for linux/opensolaris/FreeBSD kernels over the past 19 years Contributed a few patches for various observability projects On-call for the last 19 years Woken up for stupid things for 19 years… Been happily working for synthesio.com for 2.5 years
  2. talk(1) <Friend> "wow congratulations on making it to the KR

    conferences" <Me> "Thanks !" <Friend> "i was looking at the KR speakers list. I saw the usual legends. And you. Good luck with that. Sincerely"
  3. This is not meant to be a public shaming session

    Names and bugs were voluntarily removed Explaining these bugs/patches to most of you would be… incongruous You probably wrote or validated the bug… and the fix motd(5)
  4. alarm(2) 500 HTTP error non zero shell return code Segfault

    Kernel panic OOM CRC errors Network problems No data No graph [...]
  5. sleep(1) HTTP 200 error Failed shell script returning 0 Segfault

    hidden by a process supervisor Silent data corruption Unknown states Pattern change No timeout on probe [...]
  6. prometheus(1) con 2018 Fastly 114 prometheus servers 28.4M timeseries 2.2M

    samples/s Cloudflare 267 prometheus servers Uber 400-600M datapoints/s pre-aggregation 20M stored datapoints per second 6.6B unique metric IDs 9k grafana dash 30B datapoints
  7. free(1) So ops guys brains working memory are saturated, among

    other things, by metrics What if… Even the most basic metrics weren’t what you thought they’d be ? What if… The same metric did not mean the same from a server to another ? What if… We were all wrong most part of the time ?
  8. top(1) I have played a game with other mid to

    senior ops guys : 2 out of 10 were almost correct. “Load averages are an industry-critical metric – my company spends millions auto-scaling cloud instances based on them and other metrics – but on Linux there's some mystery around them.” Brendan Gregg (2017) After all it only took around 12 screens to Brendan Gregg to explain linux load average history. Oh and good news, linux computes load differently than other kernel/OS
  9. irssi(1) /query foo <foo> is hired, replaces a dying home-made

    linux-based switch with a very common one <foo> adds metrics to this brand new switch and figures out something is wrong Switch and server are absolutely not giving the same results : at least 50% drop on all network tx/rx metrics during the usual benchmarks <foo> examines the dashboard configuration : there’s also a max() function but that was just an aggravating factor not the root cause <foo> beorn you know collectd-fu right ?
  10. vim(1) ~/collectd core/plugin code Collectd code was pretty straight forward

    Collectd reads data from /proc/net/dev No voodoo magic here
  11. history(3) The server and the linux-based-old-switch were running the exact

    same old linux kernel version And could not be simply upgraded because of proprietary drivers of specific components
  12. proc(5) /proc/net/dev When this story happens there was almost no

    documentation for /proc/net/dev Gladly there was this old email that gave some useful hints.
  13. mail(1) > How can I find out the /proc/net info

    > > eg: softnet_stat is for what purpose Much of this is only well-documented in the code. Here's an attempt at interpreting softnet_stat [no guarantee that it is correct; read the code!]: % softnet_stat.sh cpu total dropped squeezed collision 0 1794619684 0 346 0 1 36399632 0 74 2 % softnet_stat.sh -h usage: softnet_stat.sh [ -h ] [...]
  14. mutt(1) Output column definitions: cpu # of the cpu total

    # of packets (not including netpoll) received by the interrupt handler There might be some double counting going on: net/core/dev.c:1643: __get_cpu_var(netdev_rx_stat).total++; net/core/dev.c:1836: __get_cpu_var(netdev_rx_stat).total++; I think the intention was that these were originally on separate receive paths ... dropped # of packets that were dropped because netdev_max_backlog was exceeded squeezed # of times ksoftirq ran out of netdev_budget or time slice with work remaining collision # of times that two cpus collided trying to get the device queue lock.
  15. git-log(1) # git log --pretty=oneline --abbrev-commit |grep igb| grep stats

    55c05dd0295d igbvf: Use net_device_stats from struct net_device e66c083aab32 igb: fix stats for i210 rx_fifo_errors 3dbdf96928dc igb: Fix stats output on i210/i211 parts. 0a915b95d67f igb: Add stats output for OS2BMC feature on i350 devices 12dcd86b75d5 igb: fix stats handling 43915c7c9a99 igb: only read phy specific stats if in internal phy mode 128e45eb61b9 igb: Rework how netdev->stats is handled 645a3abd73c2 igb: Remove invalid stats counters 3f9c01648146 igb: only process global stats in igb_update_stats 04a5fcaaf0e1 igb: move alloc_failed and csum_err stats into per rx-ring stat 231835e4163c igb: Fix erroneous display of stats by ethtool -S 8d24e93309d6 igb: Use the instance of net_device_stats from net_device. cc9073bbc901 igb: remove unused temp variable from stats clearing path 3ea73afafb8c igb: Record host memory receive overflow in net_stats 04fe63583d46 igb: update stats before doing reset in igb_down e21ed3538f19 igb: update ethtool stats to support multiqueue
  16. git-commit(1) /* * ENOBUFS = no kernel mem, SOCK_NOSPACE =

    no sndbuf space. Reporting * ENOBUFS might not be good (it's not tunable per se), but otherwise * we don't have a good statistic (IpOutDiscards but it can be too many * things). We could add another new stat but at least for now that * seems like overkill. */
  17. ethtool(8) Over the years the Linux networking stack had hoarded:

    • Tens of (cool) features ( GRO, GSO, RPS, RFS, …) • Tens of drivers • Tons of code-paths • Multiple thousand sysctl entries • A lot of bugs Manufacturer’s tech document was 1200 pages long, and is probably bigger today Documentation was not what it is today
  18. sha512sum(1) To sum it up • notice the problem •

    Fix the graph configuration (bad aggr) • start reading the userland stats collecting (collectd here) • realize and make sure the bug was not there • read your kernel/driver code • realize the bug is really in the code path that /proc/net/dev hits • read the 1200 pages tech specs from the manufacturer • find a few related patches • rebuild the kernel/driver only 4 times (we were lucky) • And just reboot production servers for weeks All that just to read valid tx.rx packets counters !
  19. bc(1) <foo> Last year based on these metrics they doubled

    network capacity for more than 2.8M euros
  20. We had many servers of a validated type with 10Gbps

    ixgbe nics According to capacity planning we order a 240 servers batch Linux TCP/IP network statistics are bad : tcp retransmits, latencies, … The new switch metrics were green Linux did not have signal related statistics for fiber NICs Another brand/model of SFP+ worked just fine netstat(1)
  21. mutt(1) reseller <reseller> everything is fine <me> if only we’ve

    had those SFP+ DOM registers in kernel/ethtool… <CTO> you have 10 full days to prove them wrong <me> Erm it’s the network stack we’re talking about and i’m no real kernel dev <CTO> That’s why you have 10 full days to prove them wrong
  22. Read everything i could find about optical signal, SFP+ and

    DOM statistics Found a microrouter project named bifrost doing just this with a 2.6 kernel (2012) Their Patches were never pushed upstream We needed it to run on 3.4 kernels for features and hardware compatibility Emailed the guys about a 3.4 patch: no luck Let’s port this to 3.4 links(1)
  23. The network API had major changes between 2.6 and 3.4

    on this particular part. Ended up rewriting the patchset (kernel + ethtool) entirely in 5 days Patch worked in production for a 3-4 years without a glitch vim(1) patchset.diff # ethtool -D eth0 Int-Calbr: Avr RX-Power: Alarm & Warn: TX_DISABLE: TX_FAULT: RX_LOS: RATE_SELECT MON: RATE_SELECT: Wavelength: 850 nm Alarms, warnings in beginning of line, Ie. AH = Alarm High, WL == Warn Low etc Temp: 45.7 C Thresh: Lo: -45.0/-40.0 Hi: 115.0/125.0 C Vcc: 3.32 V Thresh: Lo: 2.7/2.9 Hi: 3.7/3.9 V Tx-Bias: 6.6 mA Thresh: Lo: 1.0/2.0 Hi: 12.0/15.0 mA TX-pwr: -2.9 dBm ( 0.52 mW) Thresh: Lo: -10.0/-8.3 Hi: 0.8/2.0 dBm RX-pwr: -1.9 dBm ( 0.64 mW) Thresh: Lo: -16.0/-14.2 Hi: 1.8/3.0 dBm
  24. Proud and happy i wrote an email to someone “doing

    things in the kernel” <kernelguy> “$#!$#!$$@%$#%#!$%#%@$” <me> “So what should i fix ?” <End Of Discussion> git-format-patch(1)
  25. After adding the ethtool output and the patchset into the

    reseller’s case he agreed to change the incompatible SFP+ after only 5 days of hard work 480 brand new SFP+ arrived. We changed the faulty SFP+ for weeks. And that was it Roughly 200K euros were saved with these metrics hledger(1)
  26. iozone(1) In a hosting company we built ZFS based SAN/NAS

    <coworker> last batch of servers have serious storage performances issues under load <SRE> alright let’s dig
  27. sha256sum(1) # iostat -E c0t5000C5004124B687d0 sd31 Soft Errors: 0 Hard

    Errors: 0 Transport Errors: 0 Vendor: SEAGATE Product: ST2000NM0001 Revision: PS04 Serial No: Z1P1HECD Size: 2000.40GB <2000398934016 bytes> Media Error: 0 Device Not Ready: 0 No Device: 0 Recoverable: 0 Illegal Request: 0 Predictive Failure Analysis: 0 # iostat -E c11t50014EE3000E9080d0 sd22 Soft Errors: 0 Hard Errors: 0 Transport Errors: 0 Vendor: WD Product: WD2000FYYG Revision: D1B3 Serial No: WMAWP0192044 Size: 2000.40GB <2000398934016 bytes> Media Error: 0 Device Not Ready: 0 No Device: 0 Recoverable: 0 Illegal Request: 4 Predictive Failure Analysis: 0 Disk had the same labels, same tech specs, but not exactly the same physical look
  28. alpine(1) <me> Sir it is not the same disk brand/model

    <reseller> we do not guarantee anything else that tech specs <me> [...] Please do something !
  29. orion(1) Device: rrqm/s wrqm/s r/s w/s rMB/s wMB/s avgrq-sz avgqu-sz

    await svctm %util sde 0.00 0.00 1.00 246.00 0.00 123.00 1019.89 124.77 127.80 4.05 100.10 sdc 0.00 0.00 1.00 104.00 0.00 52.00 1014.32 120.05 896.32 9.52 100.00 After extensive profiling we are able to reproduce the problematic workload Which happens to be a very important workload for ZFS
  30. sup(1) <manufacturer> Our test suite shows that the disks you

    have sent are fine <me> except they are not. see the iostat output [nothing for 1 week]
  31. smartctl(1) /dev/sde: SEAGATE ST2000NM0001 PS04 Direct access device specific parameters:

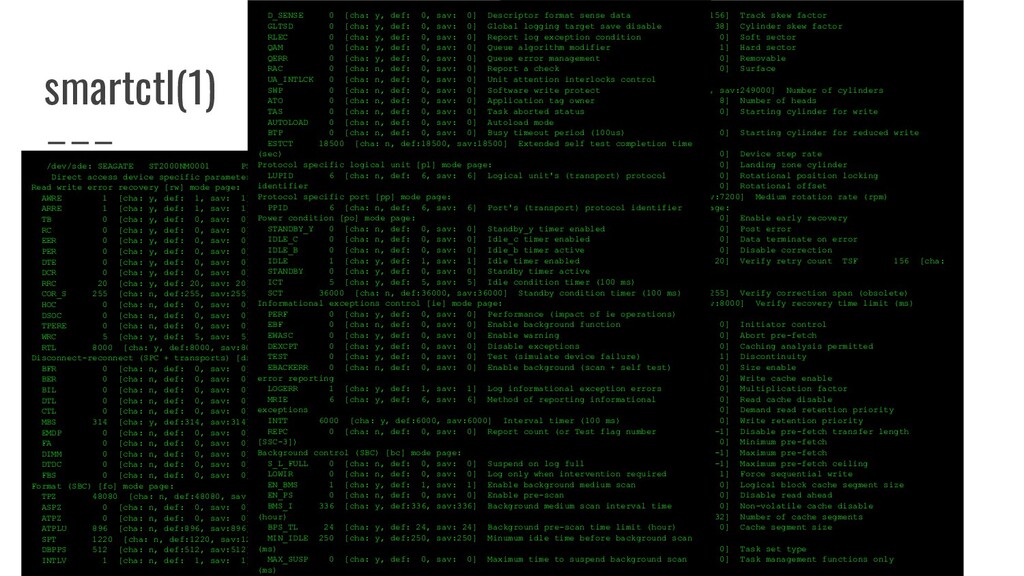
    WP=0 DPOFUA=1 Read write error recovery [rw] mode page: AWRE 1 [cha: y, def: 1, sav: 1] Automatic write reallocation enabled ARRE 1 [cha: y, def: 1, sav: 1] Automatic read reallocation enabled TB 0 [cha: y, def: 0, sav: 0] Transfer block RC 0 [cha: y, def: 0, sav: 0] Read continuous EER 0 [cha: y, def: 0, sav: 0] Enable early recovery PER 0 [cha: y, def: 0, sav: 0] Post error DTE 0 [cha: y, def: 0, sav: 0] Data terminate on error DCR 0 [cha: y, def: 0, sav: 0] Disable correction RRC 20 [cha: y, def: 20, sav: 20] Read retry count COR_S 255 [cha: n, def:255, sav:255] Correction span (obsolete) HOC 0 [cha: n, def: 0, sav: 0] Head offset count (obsolete) DSOC 0 [cha: n, def: 0, sav: 0] Data strobe offset count (obsolete) TPERE 0 [cha: n, def: 0, sav: 0] Thin provisioning error reporting enabled WRC 5 [cha: y, def: 5, sav: 5] Write retry count RTL 8000 [cha: y, def:8000, sav:8000] Recovery time limit (ms) Disconnect-reconnect (SPC + transports) [dr] mode page: BFR 0 [cha: n, def: 0, sav: 0] Buffer full ratio BER 0 [cha: n, def: 0, sav: 0] Buffer empty ratio BIL 0 [cha: n, def: 0, sav: 0] Bus inactivity limit DTL 0 [cha: n, def: 0, sav: 0] Disconnect time limit CTL 0 [cha: n, def: 0, sav: 0] Connect time limit MBS 314 [cha: y, def:314, sav:314] Maximum burst size (512 bytes) EMDP 0 [cha: n, def: 0, sav: 0] Enable modify data pointers FA 0 [cha: n, def: 0, sav: 0] Fair arbitration DIMM 0 [cha: n, def: 0, sav: 0] Disconnect immediate DTDC 0 [cha: n, def: 0, sav: 0] Data transfer disconnect control FBS 0 [cha: n, def: 0, sav: 0] First burst size (512 bytes) Format (SBC) [fo] mode page: TPZ 48080 [cha: n, def:48080, sav:48080] Tracks per zone ASPZ 0 [cha: n, def: 0, sav: 0] Alternate sectors per zone ATPZ 0 [cha: n, def: 0, sav: 0] Alternate tracks per zone ATPLU 896 [cha: n, def:896, sav:896] Alternate tracks per logical unit SPT 1220 [cha: n, def:1220, sav:1220] Sectors per track DBPPS 512 [cha: n, def:512, sav:512] Data bytes per physical sector INTLV 1 [cha: n, def: 1, sav: 1] Interleave TSF 156 [cha: n, def:156, sav:156] Track skew factor CSF 38 [cha: n, def: 38, sav: 38] Cylinder skew factor SSEC 0 [cha: n, def: 0, sav: 0] Soft sector HSEC 1 [cha: n, def: 1, sav: 1] Hard sector RMB 0 [cha: n, def: 0, sav: 0] Removable SURF 0 [cha: n, def: 0, sav: 0] Surface Rigid disk (SBC) [rd] mode page: NOC 249000 [cha: n, def:249000, sav:249000] Number of cylinders NOH 8 [cha: n, def: 8, sav: 8] Number of heads SCWP 0 [cha: n, def: 0, sav: 0] Starting cylinder for write precompensation SCRWC 0 [cha: n, def: 0, sav: 0] Starting cylinder for reduced write current DSR 0 [cha: n, def: 0, sav: 0] Device step rate LZC 0 [cha: n, def: 0, sav: 0] Landing zone cylinder RPL 0 [cha: n, def: 0, sav: 0] Rotational position locking ROTO 0 [cha: n, def: 0, sav: 0] Rotational offset MRR 7200 [cha: n, def:7200, sav:7200] Medium rotation rate (rpm) Verify error recovery (SBC) [ve] mode page: V_EER 0 [cha: y, def: 0, sav: 0] Enable early recovery V_PER 0 [cha: y, def: 0, sav: 0] Post error V_DTE 0 [cha: y, def: 0, sav: 0] Data terminate on error V_DCR 0 [cha: y, def: 0, sav: 0] Disable correction V_RC 20 [cha: y, def: 20, sav: 20] Verify retry count TSF 156 [cha: n, def:156, sav:156] Track skew factor V_COR_S 255 [cha: n, def:255, sav:255] Verify correction span (obsolete) V_RTL 8000 [cha: y, def:8000, sav:8000] Verify recovery time limit (ms) Caching (SBC) [ca] mode page: IC 0 [cha: y, def: 0, sav: 0] Initiator control ABPF 0 [cha: n, def: 0, sav: 0] Abort pre-fetch CAP 0 [cha: y, def: 0, sav: 0] Caching analysis permitted DISC 1 [cha: n, def: 1, sav: 1] Discontinuity SIZE 0 [cha: n, def: 0, sav: 0] Size enable WCE 0 [cha: y, def: 0, sav: 0] Write cache enable MF 0 [cha: n, def: 0, sav: 0] Multiplication factor RCD 0 [cha: y, def: 0, sav: 0] Read cache disable DRRP 0 [cha: n, def: 0, sav: 0] Demand read retention priority WRP 0 [cha: n, def: 0, sav: 0] Write retention priority DPTL -1 [cha: n, def: -1, sav: -1] Disable pre-fetch transfer length MIPF 0 [cha: y, def: 0, sav: 0] Minimum pre-fetch MAPF -1 [cha: y, def: -1, sav: -1] Maximum pre-fetch MAPFC -1 [cha: n, def: -1, sav: -1] Maximum pre-fetch ceiling FSW 1 [cha: n, def: 1, sav: 1] Force sequential write LBCSS 0 [cha: n, def: 0, sav: 0] Logical block cache segment size DRA 0 [cha: y, def: 0, sav: 0] Disable read ahead NV_DIS 0 [cha: n, def: 0, sav: 0] Non-volatile cache disable NCS 32 [cha: n, def: 32, sav: 32] Number of cache segments CSS 0 [cha: n, def: 0, sav: 0] Cache segment size Control [co] mode page: TST 0 [cha: n, def: 0, sav: 0] Task set type TMF_ONLY 0 [cha: n, def: 0, sav: 0] Task management functions only D_SENSE 0 [cha: y, def: 0, sav: 0] Descriptor format sense data GLTSD 0 [cha: y, def: 0, sav: 0] Global logging target save disable RLEC 0 [cha: y, def: 0, sav: 0] Report log exception condition QAM 0 [cha: y, def: 0, sav: 0] Queue algorithm modifier QERR 0 [cha: y, def: 0, sav: 0] Queue error management RAC 0 [cha: n, def: 0, sav: 0] Report a check UA_INTLCK 0 [cha: n, def: 0, sav: 0] Unit attention interlocks control SWP 0 [cha: n, def: 0, sav: 0] Software write protect ATO 0 [cha: n, def: 0, sav: 0] Application tag owner TAS 0 [cha: n, def: 0, sav: 0] Task aborted status AUTOLOAD 0 [cha: n, def: 0, sav: 0] Autoload mode BTP 0 [cha: n, def: 0, sav: 0] Busy timeout period (100us) ESTCT 18500 [cha: n, def:18500, sav:18500] Extended self test completion time (sec) Protocol specific logical unit [pl] mode page: LUPID 6 [cha: n, def: 6, sav: 6] Logical unit's (transport) protocol identifier Protocol specific port [pp] mode page: PPID 6 [cha: n, def: 6, sav: 6] Port's (transport) protocol identifier Power condition [po] mode page: STANDBY_Y 0 [cha: n, def: 0, sav: 0] Standby_y timer enabled IDLE_C 0 [cha: n, def: 0, sav: 0] Idle_c timer enabled IDLE_B 0 [cha: n, def: 0, sav: 0] Idle_b timer active IDLE 1 [cha: y, def: 1, sav: 1] Idle timer enabled STANDBY 0 [cha: y, def: 0, sav: 0] Standby timer active ICT 5 [cha: y, def: 5, sav: 5] Idle condition timer (100 ms) SCT 36000 [cha: n, def:36000, sav:36000] Standby condition timer (100 ms) Informational exceptions control [ie] mode page: PERF 0 [cha: y, def: 0, sav: 0] Performance (impact of ie operations) EBF 0 [cha: n, def: 0, sav: 0] Enable background function EWASC 0 [cha: y, def: 0, sav: 0] Enable warning DEXCPT 0 [cha: y, def: 0, sav: 0] Disable exceptions TEST 0 [cha: y, def: 0, sav: 0] Test (simulate device failure) EBACKERR 0 [cha: n, def: 0, sav: 0] Enable background (scan + self test) error reporting LOGERR 1 [cha: y, def: 1, sav: 1] Log informational exception errors MRIE 6 [cha: y, def: 6, sav: 6] Method of reporting informational exceptions INTT 6000 [cha: y, def:6000, sav:6000] Interval timer (100 ms) REPC 0 [cha: n, def: 0, sav: 0] Report count (or Test flag number [SSC-3]) Background control (SBC) [bc] mode page: S_L_FULL 0 [cha: n, def: 0, sav: 0] Suspend on log full LOWIR 0 [cha: n, def: 0, sav: 0] Log only when intervention required EN_BMS 1 [cha: y, def: 1, sav: 1] Enable background medium scan EN_PS 0 [cha: n, def: 0, sav: 0] Enable pre-scan BMS_I 336 [cha: y, def:336, sav:336] Background medium scan interval time (hour) BPS_TL 24 [cha: y, def: 24, sav: 24] Background pre-scan time limit (hour) MIN_IDLE 250 [cha: y, def:250, sav:250] Minumum idle time before background scan (ms) MAX_SUSP 0 [cha: y, def: 0, sav: 0] Maximum time to suspend background scan (ms)
  32. :(){ :|:& };: At the same time they provided us

    a “fix” firmware Performances were even better than with the good disk. Binary diff showed a 1 bit change. Yes a boolean. Their firmware was silently enabling write cache (without battery) Which is to say the least dangerous
  33. dc(1) --- st2000nm00001_sdparm.txt 2013-02-28 21:12:15.287433646 +0100 +++ wd2000fyyg_sdparm.txt 2013-02-28 21:12:28.823131392

    +0100 @@ -1,102 +1,97 @@ - /dev/sde: SEAGATE ST2000NM0001 PS04 + /dev/sdc: WD WD2000FYYG D1BB Direct access device specific parameters: WP=0 DPOFUA=1 Read write error recovery [rw] mode page: - RC 0 [cha: y, def: 0, sav: 0] Read continuous + RC 0 [cha: n, def: 0, sav: 0] Read continuous - RRC 20 [cha: y, def: 20, sav: 20] Read retry count - COR_S 255 [cha: n, def:255, sav:255] Correction span (obsolete) + RRC 255 [cha: y, def:255, sav:255] Read retry count + COR_S 0 [cha: n, def: 0, sav: 0] Correction span (obsolete) - WRC 5 [cha: y, def: 5, sav: 5] Write retry count + WRC 255 [cha: y, def:255, sav:255] Write retry count Verify error recovery (SBC) [ve] mode page: - V_RC 20 [cha: y, def: 20, sav: 20] Verify retry count - V_COR_S 255 [cha: n, def:255, sav:255] Verify correction span (obsolete) + V_RC 255 [cha: y, def:255, sav:255] Verify retry count + V_COR_S 0 [cha: n, def: 0, sav: 0] Verify correction span (obsolete) Caching (SBC) [ca] mode page: - FSW 1 [cha: n, def: 1, sav: 1] Force sequential write + FSW 0 [cha: y, def: 0, sav: 0] Force sequential write Informational exceptions control [ie] mode page: - PERF 0 [cha: y, def: 0, sav: 0] Performance (impact of ie operations) - EBF 0 [cha: n, def: 0, sav: 0] Enable background function + PERF 0 [cha: n, def: 0, sav: 0] Performance (impact of ie operations) + EBF 1 [cha: y, def: 1, sav: 1] Enable background function - EBACKERR 0 [cha: n, def: 0, sav: 0] Enable background (scan + self test) error reporting - LOGERR 1 [cha: y, def: 1, sav: 1] Log informational exception errors + EBACKERR 0 [cha: y, def: 0, sav: 0] Enable background (scan + self test) error reporting + LOGERR 1 [cha: n, def: 1, sav: 1] Log informational exception errors - REPC 0 [cha: n, def: 0, sav: 0] Report count (or Test flag number [SSC-3]) + REPC 0 [cha: y, def: 0, sav: 0] Report count (or Test flag number [SSC-3]) Background control (SBC) [bc] mode page: - S_L_FULL 0 [cha: n, def: 0, sav: 0] Suspend on log full - LOWIR 0 [cha: n, def: 0, sav: 0] Log only when intervention required + S_L_FULL 0 [cha: y, def: 0, sav: 0] Suspend on log full + LOWIR 0 [cha: y, def: 0, sav: 0] Log only when intervention required - EN_PS 0 [cha: n, def: 0, sav: 0] Enable pre-scan + EN_PS 0 [cha: y, def: 0, sav: 0] Enable pre-scan - BPS_TL 24 [cha: y, def: 24, sav: 24] Background pre-scan time limit (hour) + BPS_TL 0 [cha: y, def: 0, sav: 0] Background pre-scan time limit (hour) We proved the disks did not have the same behavior/specs using this diff The reseller changed all the 250 disks 150K euros We spent the next months changing and resilvering arrays already in production
  34. sha256sum(1) Metrics are everywhere in operations at an unprecedented scale

    and still growing fast The vast majority of I.T. professionals do not understand fully what they are currently graphing Graphs are meant to trigger a deeper questioning when the behavior changes To make a costly decision based on metrics without taking the time to ensure what is exactly this metric is pure folly Acquiring this knowledge is necessary and time consuming and requires humility
  35. task(1) add project:young_me [...] Kernel code ain’t no saint writing

    Macros make things easy if you are not a C guru Read git history per sub-system it helps a lot Ask upstream if they are interested in what you plan to write Propose a (probably stupid) way of doing the change before doing code Then code and get things upstreamed