Upgrade to Pro — share decks privately, control downloads, hide ads and more …

Leatlet Time-Dimension, Biel Frontera, SOCIB

Leatlet Time-Dimension, Biel Frontera, SOCIB

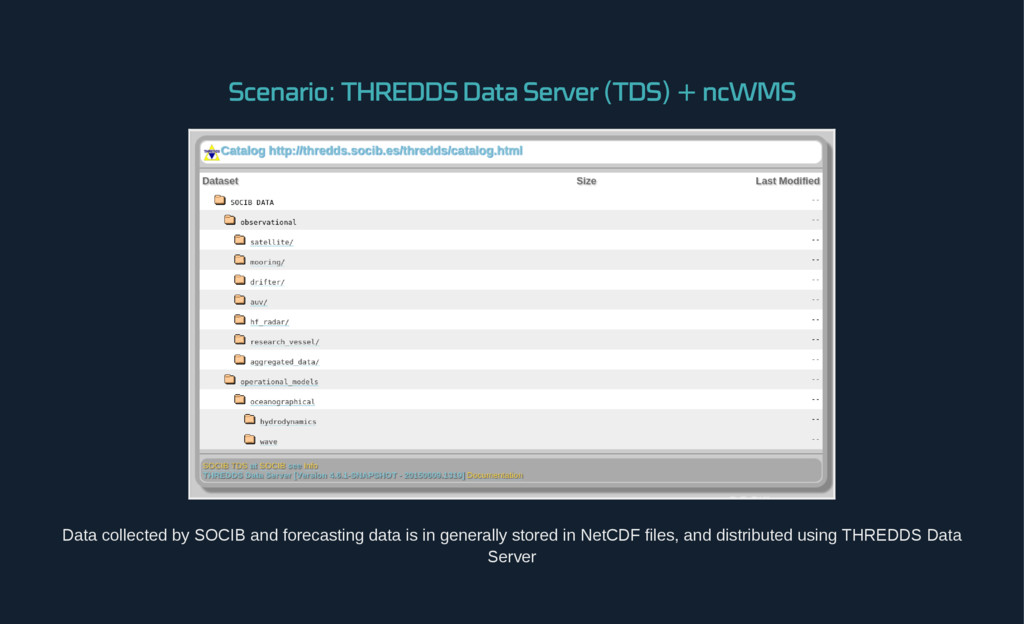
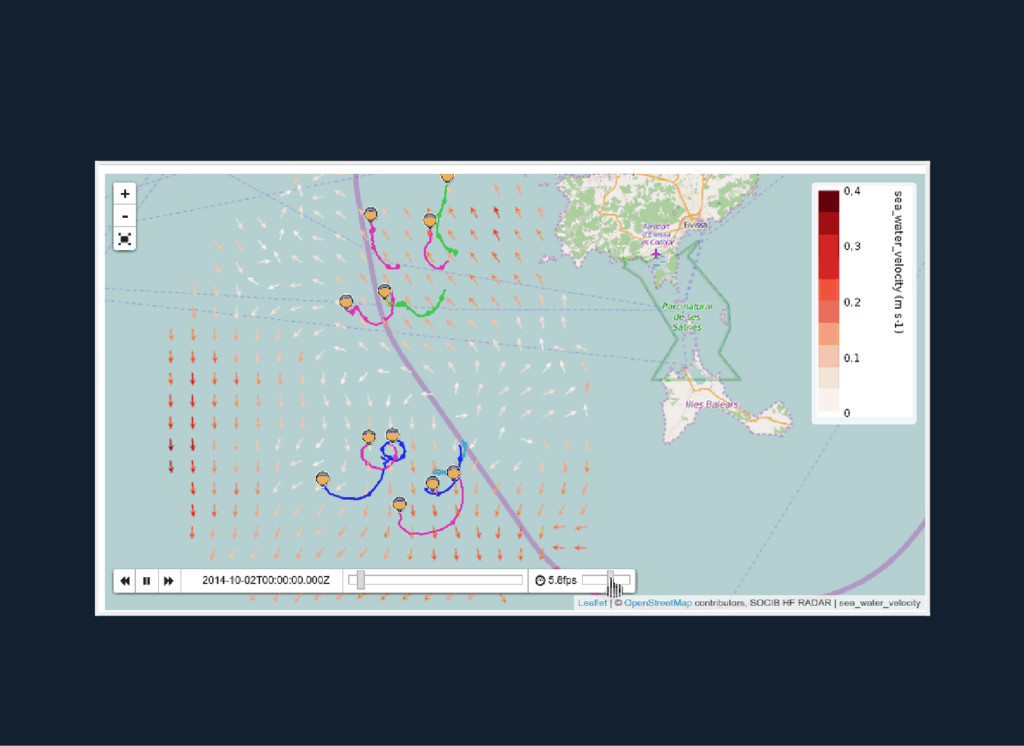
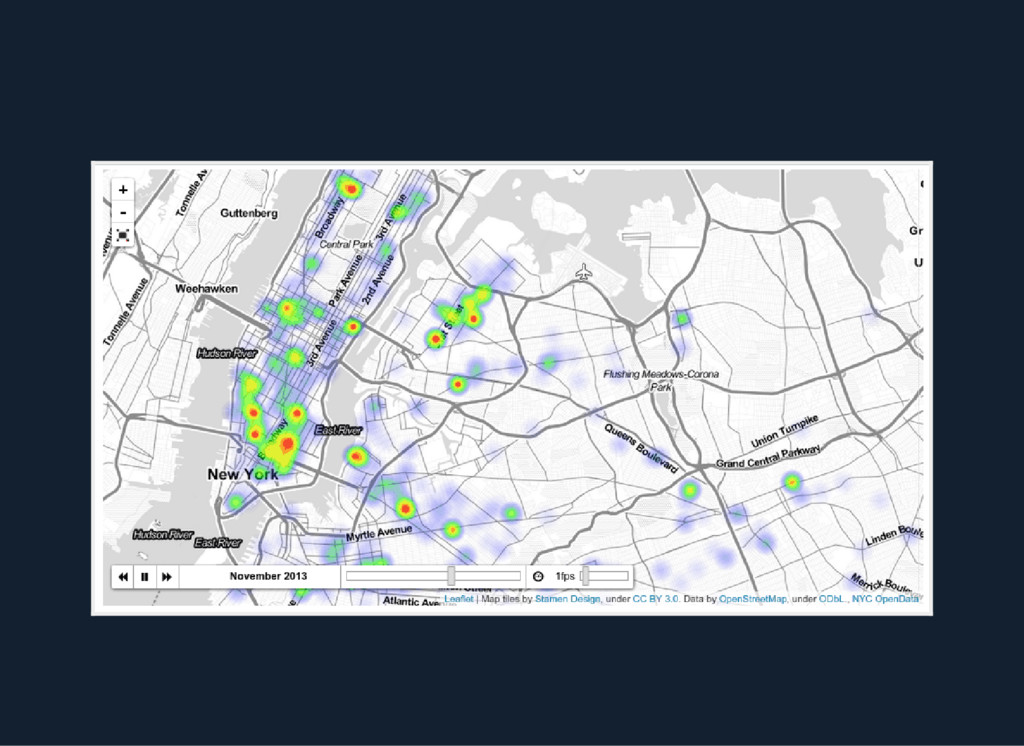
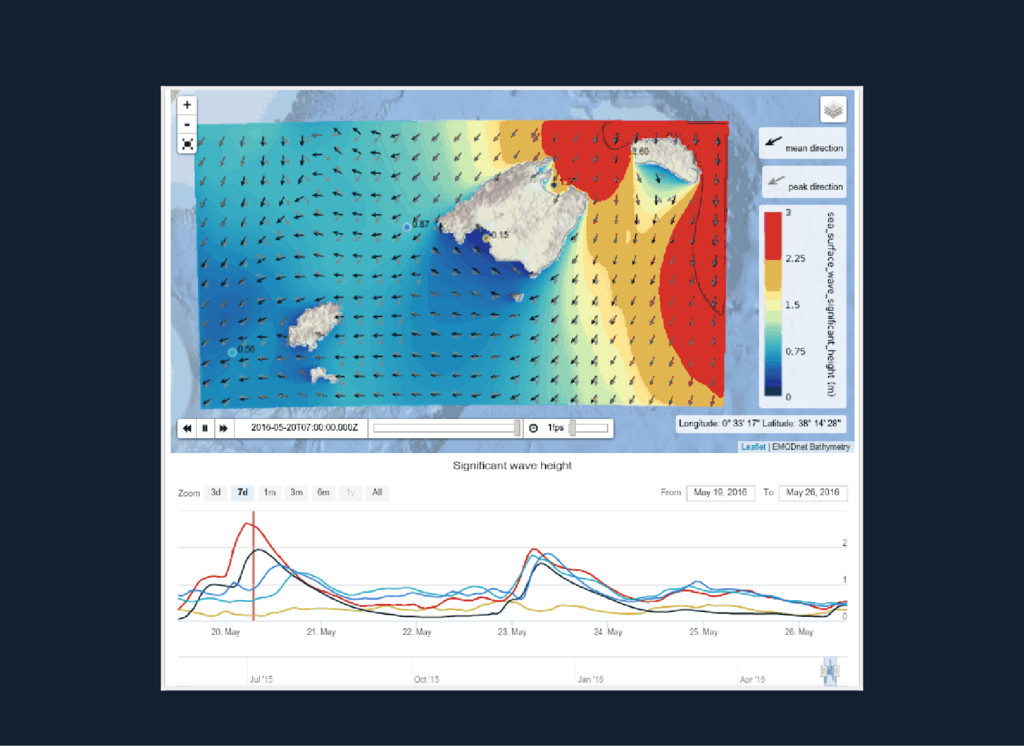
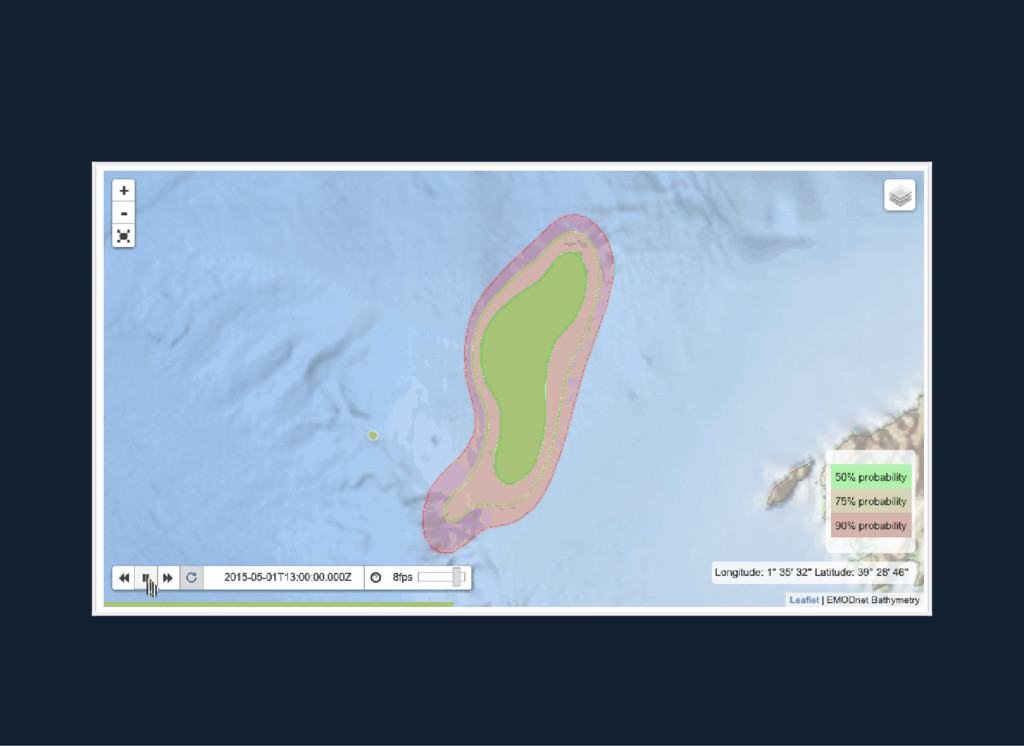
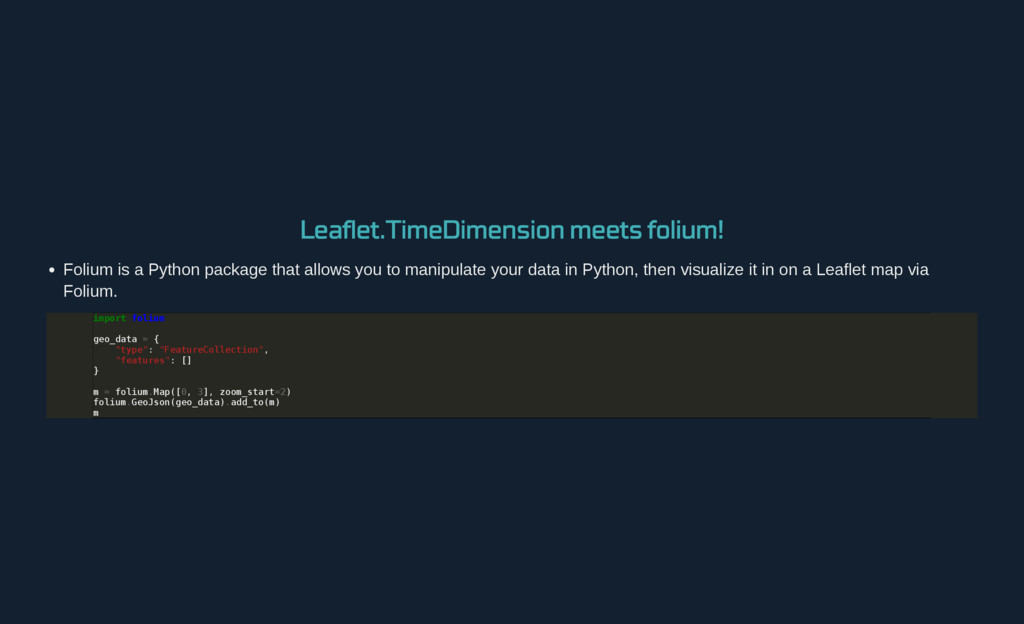
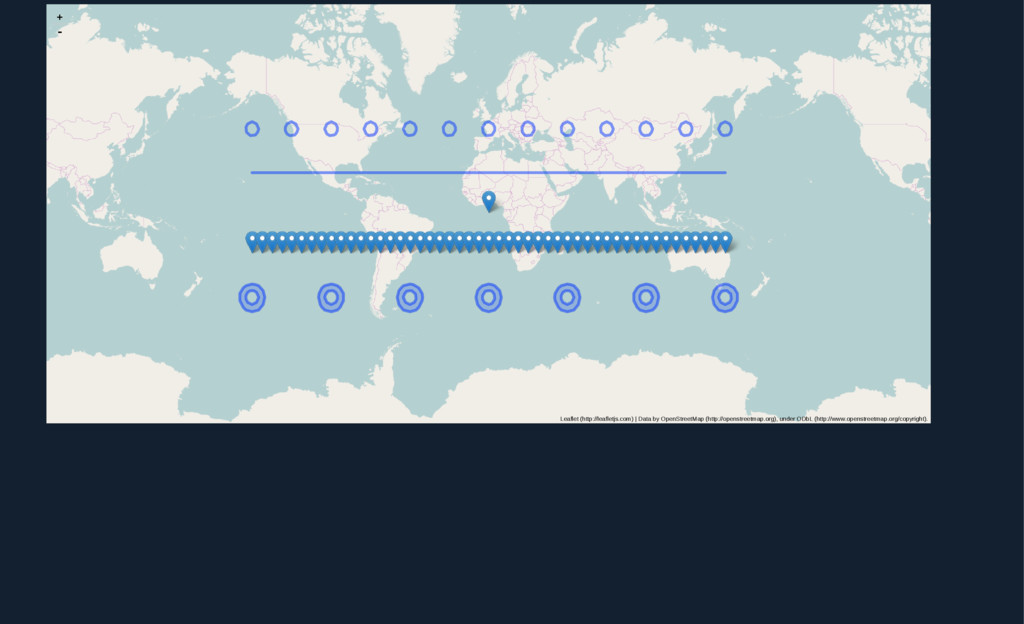
Summary: Leaflet.TimeDimension is a free, open-source Leaflet.js plugin that enables visualization of spatial data with a temporal dimension. It can manage different types of layers (WMS, GeoJSON, Overlay) and it can be easily extended. It meet some common needs, enabling web maps using observational and forecasting layers generated by a THREDDS server (via ncWMS), animating trajectories of drifters, gliders, follow a simulated oil spill, and other time dependent mapping applications.

Speaker: Biel Frontera was trained as a mathematician, and has spent most of his career developing software. He is a free software enthusiast and has worked for the last 3 years on data visualization and geospatial software issues for SOCIB, the Baleric Islands Coastal Observing and Forecasting System.

ESIP Federation

May 12, 2016
Tweet

More Decks by ESIP Federation

Other Decks in Technology

Transcript

  1. A multi­platform system with three major subsystems: Observing facilities: fixed

    stations such as oceanographic boys, coastal stations, weather stations and sea level stations. We also have a glider fleet, a mid­size research vessel, profiler drifters and surface drifters and an HF Radar station. The Forecasting and Modelling Facility: An ocean forecasting system representing currents, temperature, salinity and sea level in the western Mediterranean Sea; A meteo­tsunami forecasting system aiming at predicting the occurrence of meteo­ tsunamis ("rissagues") in Ciutadella Harbor (Menorca); A wave forecasting system implemented around the Balearic Islands A Data Centre Facility: general data management system to guarantee international standards, quality assurance and inter­ operability.
  2. Scenario : THREDDS Data Server (TDS ) + ncWMS Data

    collected by SOCIB and forecasting data is in generally stored in NetCDF files, and distributed using THREDDS Data Server
  3. Previous work : The Lightweight for NetCDF viewer (Lw4nc2 )

    Switch to map Path to thredds ncWMS service SOCIB HF Radar (3km resolution) Information Style selection Scale selection prettyvec rainbow 14 14 253 Extend 0.4 0 Controls Time selection Variable selection Opacity selection Mo Tu We Th Fr Sa Su 25 26 27 28 29 30 1 2 3 4 5 6 7 8 9 10 11 12 13 14 15 16 17 18 19 20 21 22 23 24 25 26 27 28 29 30 31 1 2 3 4 5 08:00:00.000Z Velocity Quality flag for direction Timeseries plotting in a point Transect plotting SOCIB HF Radar (3km resolution) | Data access | More information Marker Size: Marker Spacing: Num color bands: Above max: Upper: Lower: May 2016 + −
  4. LW4NC2 is an application similar to Godiva that allows the

    user to browse through gridded files by variable or date. It also allows the user to extract time series at chosen locations, change styles and perform other visualization tasks. Developed using OpenLayers (v2) Two years ago we added a time animation control This is an app that we currently use at SOCIB, and it is quite complete. But we understand it covers only an specific use case. We wanted to embed map viewers in our websites, and we also needed animations for other kind of map layers, as geojson layers, to be able to animated trajectories of our mobile platforms.
  5. Before developing Leaflet.TimeDimension, we were showing in our website only

    the last available observation of our HF Radar facility.
  6. Now, we can show an animation of the observations, among

    other improvements (see ) http://www.socib.es/? seccion=observingFacilities&facility=radar + -    2015­09­01T00:00:00.000Z 5fps  Leaflet (http://leafletjs.com) | Data by OpenStreetMap (http://openstreetmap.org), under ODbL (http://www.openstreetmap.org/copyright)., SOCIB HF Radar
  7. Or we can animate the trajectories of a bunch of

    surface drifters… This is the example of a campaign in the alboran sea. http://test.socib.es/en/facilities/observing­facilities/lagrangian­platforms/
  8. Leaflet.Timedimension : basic code examples Basic example with a WMS

    Layer: v a r m a p = L . m a p ( ' m a p ' , { t i m e D i m e n s i o n : t r u e , t i m e D i m e n s i o n C o n t r o l : t r u e , } ) ; v a r o c e a n F o r e c a s t i n g W M S = " h t t p : / / t h r e d d s . s o c i b . e s / t h r e d d s / w m s / o p e r a t i o n a l _ m o d e l s / o c e a n o g r a p h i c a l / h y d r o d y n a m i c s / m o d e l _ r u n _ a g g r e g a t i o n / w m o p / w m o p _ b e s t . n c d " ; v a r t e m p e r a t u r e L a y e r = L . t i l e L a y e r . w m s ( o c e a n F o r e c a s t i n g W M S , { l a y e r s : ' t e m p ' , f o r m a t : ' i m a g e / p n g ' , t r a n s p a r e n t : t r u e , s t y l e s : ' b o x f i l l / s s t _ 3 6 ' } ) ; v a r t e m p e r a t u r e T i m e L a y e r = L . t i m e D i m e n s i o n . l a y e r . w m s ( t e m p e r a t u r e L a y e r , { u p d a t e T i m e D i m e n s i o n : t r u e , } ) . a d d T o ( m a p ) ;
  9. Leaflet.Timedimension : basic code examples Basic example with a GeoJSON

    Layer: v a r m a p = L . m a p ( ' m a p ' , { t i m e D i m e n s i o n : t r u e , t i m e D i m e n s i o n C o n t r o l : t r u e , } ) ; $ . g e t J S O N ( ' d a t a / e x a m p l e . g e o j s o n ' , f u n c t i o n ( d a t a ) { v a r g e o J s o n L a y e r = L . g e o J s o n ( d a t a ) ; v a r g e o J s o n T i m e L a y e r = L . t i m e D i m e n s i o n . l a y e r . g e o J s o n ( g e o J s o n L a y e r , { u p d a t e T i m e D i m e n s i o n : t r u e , d u r a t i o n : ' P T 2 0 M ' , } ) ; g e o J s o n T i m e L a y e r . a d d T o ( m a p ) ; m a p . f i t B o u n d s ( g e o J s o n L a y e r . g e t B o u n d s ( ) ) ; } ) ;
  10. Remarks about GeoJSON According to GeoJSON specification, geometry coordinates can

    have only three dimensions: latitude, longitude and elevation. So, there isn't a standard way to fill time dimension information in GeoJSON format. Leaflet.TimeDimension searchs for these properties to get time information of each feature: time, times, coordTimes or linestringTimestamps
  11. Leaflet.TimeDimension : create new timedimension layer types TimeDimension.Layer is an

    abstract Layer that can be synchronized with a TimeDimension. The constructor recieves a layer (of any kind) and options. The plugin is shipped with GeoJSON and WMS TimeDimension layers (seen before). That classes can be extended, or you can create a new class than should implement at least this three methods: _onNewTimeLoading, isReady and _update TimeDimension.Layer.CircleLabelMarker is an example of this (we will see later at example13)
  12. Leaflet.TimeDimension : interact with time v a r m a

    p = L . m a p ( ' m a p ' , { t i m e D i m e n s i o n : t r u e , t i m e D i m e n s i o n C o n t r o l : t r u e , } ) ; / / M o d i f y t h e c u r r e n t t i m e m a p . t i m e D i m e n s i o n . s e t C u r r e n t T i m e ( n e w D a t e ( ) . g e t T i m e ( ) ) ; / / L i s t e n t o t i m e d i m e n s i o n e v e n t s / / t i m e l o a d : F i r e d w h e n a a l l s y n c e d l a y e r s h a v e b e e n l o a d e d / p r e p a r e d f o r a n e w t i m e ( o r t i m e o u t ) m a p . t i m e D i m e n s i o n . o n ( ' t i m e l o a d ' , f u n c t i o n ( d a t a ) { / / E x a m p l e : u p d a t e h t m l e l e m e n t s w h e n t i m e i s c h a n g e d v a r c u r r e n t D a t e = n e w D a t e ( m a p . t i m e D i m e n s i o n . g e t C u r r e n t T i m e ( ) ) ; / / o r d a t a . t i m e v a r d a t e E l e m e n t = $ ( " # d a t e " ) ; d a t e E l e m e n t . f i n d ( ' s p a n . m a p d a t e ' ) . h t m l ( c u r r e n t D a t e . f o r m a t ( " d d / m m / y y y y " , t r u e ) ) ; d a t e E l e m e n t . f i n d ( ' s p a n . m a p t i m e ' ) . h t m l ( c u r r e n t D a t e . f o r m a t ( " H H : M M " , t r u e ) ) ; d a t e E l e m e n t . s h o w ( ) ; } ) ;
  13. Leaflet.Timedimension : basic code examples Let's comment some examples from

    http://apps.socib.es/Leaflet.TimeDimension/examples/
  14. Leaflet.TimeDimension meets folium! Folium is a Python package that allows

    you to manipulate your data in Python, then visualize it in on a Leaflet map via Folium. i m p o r t f o l i u m g e o _ d a t a = { " t y p e " : " F e a t u r e C o l l e c t i o n " , " f e a t u r e s " : [ ] } m = f o l i u m . M a p ( [ 0 , 3 ] , z o o m _ s t a r t = 2 ) f o l i u m . G e o J s o n ( g e o _ d a t a ) . a d d _ t o ( m ) m
  15. f r o m f o l i u m

    i m p o r t p l u g i n s m = f o l i u m . M a p ( [ 0 , 3 ] , z o o m _ s t a r t = 2 ) t g j = p l u g i n s . T i m e s t a m p e d G e o J s o n ( g e o _ d a t a ) m . a d d _ c h i l d r e n ( t g j )
  16. + -    2015­07­01T00:00:00.000Z 5fps  Leaflet (http://leafletjs.com)

    | Data by OpenStreetMap (http://openstreetmap.org), under ODbL (http://www.openstreetmap.org/copyright).
  17. Leaflet.TimeDimension in use HF RADAR: WAVE FORECAST: MEDCLIC PROJECT: NEW

    SOCIB WEBSITE (soon) http://www.socib.es/?seccion=observingFacilities&facility=radar http://www.socib.es/?seccion=modelling&facility=sapo http://medclic.es/en/instrumentos/modelado­y­prediccion/